Life Insurance and Suicide: A Test of the Existence of Asymmetric Information
21
0
0
全文
(2) A monk died after he accidentally ate poisonous Hiratake mushrooms. His lord felt sorry for the monk and paid for his funeral. Even after hearing that incident, another monk at Todaiji temple ate Hiratake mushrooms. People wondered why he risked his life. Then he said, ‘since I don’t have any money for my funeral after my death, in order to draw the lord's sympathy and to finance my funeral, I ate Hiratake mushrooms. Yet, unfortunately, it did not work. Monks and Poisonous Hiratake Mushrooms, in Kon Jyaku Monogatari (A Japanese Book of Old Stories), circa 794-1185.. I. Introduction Suicide is one of the most serious and vexing issues faced in all modern societies. According to the World Health Organization (WHO), approximately 3,000 people commit suicide every day, and every 30 seconds, one suicide related death is reported. Moreover, in the last 45 years, suicide rate has increased by 60% worldwide (WHO, 2007). Many medical professionals consider suicide to be the results of depression and other psychiatric disorders (Mann et al., 2005). However, as early as in 1897, sociologist Émile Durkheim, in his seminal book—Le Suicide—developed the concept of social integration to understand suicides from sociological perspective.1 Moreover, Hamermesh and Soss (1974), in their economic theory on suicide, employed an expected lifetime utility maximization framework to explain suicides as rational decisions. Nonetheless, existing literature has largely disregarded the role of economic or financial incentives in inducing suicide. Suicides induced by economic incentives are not rare in real life.2 Even government. 1 Satī is an old Hindu funeral practice in which the widow sacrifices her life by burning herself on her husband’s funeral pyre; satī has been cited by Durkheim as an example of altruistic suicides in cases when there is high social integration. Contemporary sociologists have employed the same concept to explain Kamikaze pilots and suicide bombers. Chen, Choi, and Sawada (2007) also provide evidence that the coguarantor borrowing system in Japan induces suicides of borrowers in cases where the magnitude of social stigma and the degree of altruism are high. 2 More extremely, there are some evidence showing that even the timing of death can be reponsive to economic incentive. Kopczuk and Slemrod (2003) showed that when living longer, or dying sooner, could significantly affect estate-tax liability, the timing of death can be responsive to its tax consequences. Gans and Leigh (2006) also provide evidence suggesting that some deaths were shifted from the week before the abolition of the Australian federal inheritance taxes. 200.
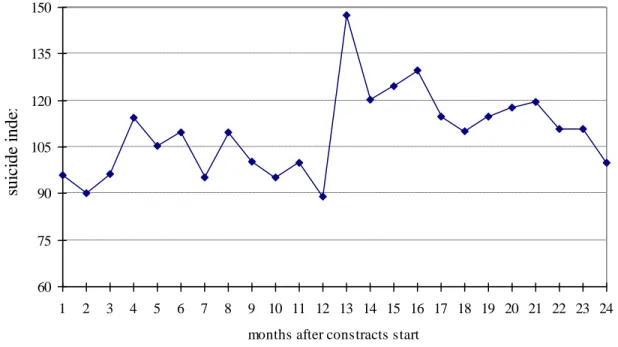
(3) policies can induce suicides through moral hazard. For example, in some states in India, there has been an increase in the suicide rate; this is probably due to the government policy of compensating bereaved families for the loss of a breadwinner who has killed himself (The Economist, June 21, 2007). Life insurance contracts also provide incentives to commit suicide as death benefits are paid in cases of suicides after the suicide exemption period.3 In fact, Toyokawa and Shiromizu (1998) and Amamiya (2002) stated that there was an increase in the number of suicides among life insurance policy holders immediately after the suicide exemption period. We reproduced a figure from Amamiya (2002) as Figure 1. It shows the suicide index, which is set to 100 for the average number of suicides in the first 12 months after contract been activated, jumped to about 150 on the thirteenth month—the month immediately after the expiration of the suicide exemption period. Moreover, according to one media report, in 2005, 10% of a major Japanese life insurance company’s total insurance payments went to suicide related deaths (Mainichi Shinbun, October 4, 2005).4 These examples imply that some suicides were induced by adverse selection and/or moral hazard under imperfect information. In the presence of substantial adverse selection and moral hazard, life insurance participants would have a higher suicide rate compared to nonparticipants. However, there has been no economic research that directly explores this potential link between suicide and life insurance (Villeneuve, 2000) except Tseng (2006) which employed the mortality data submitted by large U.S. insurance companies to the Society of Actuaries; the results revealed that the suicide rate of the insured quadrupled after the expiry of the suicide exemption period. However, Tseng (2006) reveals contradictory data: the suicide rate of the general population was two to three times higher than that among the insured.In this paper, we aim to investigate the causal relationship between life insurance demand and suicide rate based on the asymmetric information theory. The primary difficulty in establishing the causality from life insurance to suicide is the potential. 3 A suicide exemption period (suicide provision; suicide clause) states that if the insured dies as a result of suicide within the period specified in the suicide clause, the death benefit would not be paid to any beneficiaries; after this period lapses, suicide is treated the same as death caused by other reasons. 4 Some of the payments actually went to the consumer loan companies to clear the debts of the suicide victims. Indeed, according to the Japanese Financial Services Agency, in Fiscal Year 2004, there were 6,110 life insurance payments made for suicides that resulted in the person's consumer loan debts being paid off by their life insurance companies (Financial Services Agency, the Japanese Government, 2006). According to the Japn national Policy Agency, the total number of suicides in 2004 is 35,325. 201.
(4) endogeneity associated with the use of the life insurance variable to explain the suicide rate. Controlling observable socioeconomic factors, the demand for life insurance rises with an increase in unobservable factors such as risk type, i.e., tendency to commit suicide, degree of risk aversion, and degree of altruism. These unobservable factors may also affect suicide decisions, thereby causing the endogeneity problem due to omitted variables. The novelty of our analysis lies in the use of cross country variations in the lengths of the suicide exemption period of life insurance policies and foreign market shares in life insurance industries as identifying instruments for life insurance demand. Cross country variations in suicide exemption periods generate a situation of quasi natural experiments where representative agents are faced with different incentive schemes for exogenous reasons (Chiappori, 2000). Furthermore, the level of foreign market share may reflect trade barriers in the market or the degree of competitiveness among domestic insurance companies in the market. Hence, both the length of the exemption period and foreign market share in the life insurance market are correlated with life insurance demand. On the other hand, these two variables are not correlated directly with suicides: the lengths of exemption periods are mostly constant, and suicide decisions would not be affected by the nationality of policy writers. Using the data of OECD countries from 1980 to 2002, the first stage IV regression uses the lengths of exemption period and foreign market shares as instruments and the results show a negative relationship between the length of the exemption period and life insurance demand. The second stage semiparametric regressions reveal that there exists a positive causality from life insurance demand to the suicide rate. The negative relationship in the first stage regression suggests the existence of adverse selection, and the positive relationship in the second stage regression is consistent with the existence of adverse selection and/or moral hazard. We believe that these findings contribute to the literature because the existence of asymmetric information in the life insurance market— which is the largest private insurance market—has rarely been examined empirically, and existing studies such as Beliveau (1984) and Cawley and Philipson (1999) provide mixed. 202.
(5) results.5 The remainder of this paper is organized as follows. Section II presents an empirical model, and Section III describes the data used in this study. Section IV presents the results of the empirical analysis, and Section V provides some concluding remarks and implications for further study.. II. Empirical Model There are at least two types of asymmetric information problems involved in the nexus between life insurance and suicides: moral hazard and adverse selection.6 We can postulate a model of suicide as a function of the amount of life insurance purchased. If suicide and life insurance purchase are positively correlated, the finding will be consistent with the hypothesis of life insurance induced adverse selection and/or moral hazard. In order to analyze the model empirically, we employ the following semiparametric regression model of suicide as a nonparametric function of life insurance demand D: (1). log Sit = Xitθ + f (log Dit) + uit,. where i and t represent the countries and years, respectively. The dependent variable log Sit is the natural log of the suicide rate; Xit is the set of attributes including socioeconomic variables such as real GDP per capita, growth rate of real GDP per capita, Gini coefficient, female labor participation rate, birth rate, divorce rate, and per capita 5 By using a data set from the Life Insurance Marketing Research Association (LIMRA), Beliveau (1984) found a positive relationship between life insurance premium rate and the amount of coverage purchased. He then argued this as evidence in support of adverse selection. Nonetheless, this finding was challenged by Cawley and Philipson (1999). Using three data sets including LIMRA, they showed that unit prices did not rise with coverage, which is inconsistent with the theory of life insurance under asymmetric information. In contrast, there has been a wide variety of empirical tests on the theoretical implications derived from asymmetric information models in non-life insurance markets, for example, the annuity market (Finkelstein and Poterba, 2004) and the automobile insurance market (Chiappori, 2000; Chiappori and Salanié, 2000). 6 Here, the moral hazard is that some of the insured, who had no intention of committing suicide before purchasing the insurance, commit suicides. However, they would not have chosen to do so had they not been insured. Suicides are considered as ex post—costlessly verifiable events—and therefore exclude fake suicides by the insured or homicides staged as suicides by the beneficiaries. 203.
(6) alcohol consumption; and life insurance demand Dit is captured by the life insurance density, defined as the per capita gross life insurance premium sold by both domestic and foreign controlled companies. The final term, uit, is an error term. The econometric concern of Equation (1) is that the life insurance variable Dit is likely to be correlated with the error term uit due to unobserved factors affecting both suicide and the demand for life insurance. Such factors may include the risk type, the degree of risk aversion, and the extent of altruism. Therefore, there can be correlation between the error term and insurance variable such that E(u|log D, X) ≠ 0. This will generate a bias in the estimation of the nonparametric function f(・) in Equation (1). In order to resolve this endogeneity problem, we impose two refinements on Equation (1). First, we decompose the error term in Equation (1) as follows: uit = αi + βt + δiT + εit. This decomposition controls for the omitted variable bias arising from unobserved country specific and time specific fixed effects through the addition of αi and βt respectively. Further, the decomposition controls for unobserved country specific but time varying effects by allowing country specific coefficient δi for the linear time trend T: (2). log Sit = Xitθ + f (log Dit) + αi + βt + δiT + εit. Second, we introduce an IV regression equation for the life insurance density using. the length of the exemption period variables and foreign market shares as the instruments, in order to mitigate the endogeneity bias arising from the simultaneity problem. For the relationship between the life insurance density and the length of the exemption period, we can hypothesize that a shorter exemption period may increase the life insurance demand by attracting riskier types, which is consistent with the existence of adverse selection in life insurance market.7 As to the foreign market share variable, it may reflect trade barriers in the market or the degree of competitiveness among domestic insurance companies in the market. In the former, a low level of foreign participation in a domestic market suggests strong regulation and low levels of insurance demand. On the other hand, in the latter, a low level of foreign participation may be due to severe domestic competition, and hence associated with high levels of insurance demand. Therefore, the direction of the overall effect is an empirical question.8 7 In the extreme case when life insurance policies deny death benefits in suicide cases—i.e., the length of the exemption period is infinite—individuals who are seriously contemplating suicide would not purchase such life insurance policies. In other words, the adverse selection problem shall not be a concern. 8 Indeed, existing empirical results are mixed. While Li et al. (2007) finds a significant positive 204.
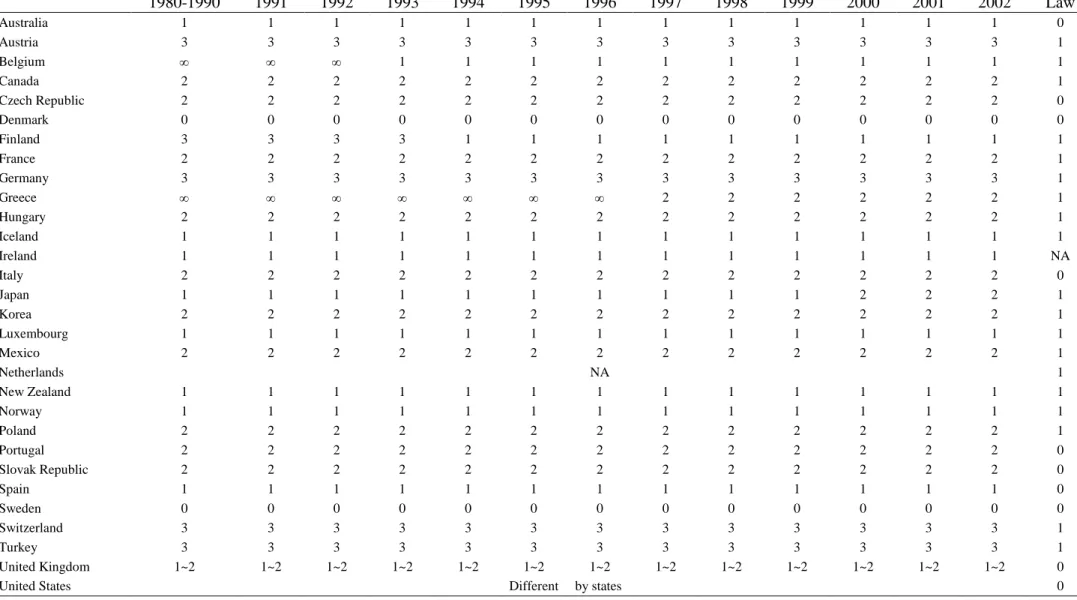
(7) In terms of the econometric framework, we apply the augmented regression technique of Holly and Sargan (1982) to the IV regression equation for the life insurance density: (3). log Dit = Zit γ + ηit,. where Z is the set of determinants of life insurance density; it includes the length of the life insurance exemption period variables and foreign market shares in life insurance industries as identifying instruments as well as the lagged log life insurance density and the socioeconomic variables X in Equation (1). Based on the previous discussion, in Equation (2), if the estimated coefficients of the length of the exemption period variables show negative signs, we can interpret them as being consistent with the presence of adverse selection in the life insurance market. Following Holly and Sargan (1982), Blundell et al. (1998), and Gong et al. (2005), we assume that E(η|Z, X) = 0 and E(ε|log D, Z, X, M) = ρη, where M includes country specific and time specific fixed effects and the country specific linear time trend. The first conditional mean assumption implies that the length of the exemption period and foreign market share in life insurance industry are uncorrelated with the error term η in Equation (3); error term η includes unobserved factors such as the risk type, the degree of risk aversion, and the extent of altruism. The second conditional mean assumption provides the structure of the way in which ε and η are related. One may have doubts about the validity of the first conditional mean assumption with respect to the lengths of the suicide exemption period variables. This is because that the life insurance industry plausibly would adopt a long exclusion period in any country in which suicide rate is high. Nonetheless, after examining the data, we can dismiss such concern. First, within the sample period, despite the variation in the suicide rates, the length of the exemption period is the same within each OECD country. It is determined either by insurance laws or industrial norms; the only exception is the United States, where the length of the suicide exemption period differs across states (see Table 1 for details). Hence, the length of the exemption period can be considered to be exogenous. 9 Second, even in Belgium, Finland, Greece, and Japan, where the lengths of the exemption periods changed, the changes were made with significant lags, and hence can be relationship, Ma and Pope (2008) suggests the relationship is non-linear. 9 The simple correlation check of suicide rates and the lengths of the exemption period for these countries shows negative (correlation coefficient=-0.0645) but insignificant result (p-value=0.4176). 205.
(8) considered as predetermined. 10 , 11 As to the validity of the first conditional mean assumption with respect to the foreign market share variable, since both foreign and domestic life insurance companies operating in the same market have the same length of the exemption period, so suicide decisions should not be affected by the nationality of the insurer. Hence, both the length of the exemption period and foreign market share in the life insurance market are correlated with life insurance demand, but not directly with the suicide rate. 12 Finally, the semiparametric regression model of Equation (2) can be rewritten as follows: (4). log Sit = Xitθ + f (log Dit) + αi + βt + δiT + ρηit + vit,. where E(v|log D, Z, X, M) = 0. We estimate Equation (4) by a two step procedure using the fitted value of η from the residual of Equation (3). As to the nonparametric estimation technique, we use Lokshin’s (2006) algorithm, which is based on the differencing method in the estimation of partial linear models introduced by Yatchew (1997).13 The bottom line is, if the estimated non parametric part in Equation (4) shows that f’(・) > 0, we can interpret the derivative as being consistent with the presence of 10 In Belgium, the suicide rates started to increase from 1991. However, contrary to the adverse selection story, the length of the exemption period decreased from infinity (no payments to suicides) to one year in 1993. In Finland, the suicide rates increased from 1981 to 1990, but there was no change in the length of the exemption period. When the suicide rates started to decrease from 1990, the length of the exemption period decreased from three years to one year in 1994, with a four-year lag. In Greece, the suicide rate has been rather stable (around 3 to 3.5 per 100,000 people) in our sample period, and the decrease in the length of the suicide exemption period from infinity to two years in 1997 did not seem to be driven by the change in the suicide rate. In Japan, there was no change in the length of the exemption period from 1986 to 1995 when there was a significant decreasing trend in the suicide rate. Meanwhile, there was a steep increase in the suicide rate (the number of suicides increased from 24,391 in 1997 to 32,863 in 1998) from 1997 to 1998, but the extension of the length of the suicide exemption period did not happen until 2000. 11Including these four countries where the lengths of the exemption period did change, the correlation check of suicide rates and the lengths of the exemption period shows either insignificant result or marginally significant but negative results. 12 The relevance tests of the potential weak instrument problem support the validity of our instruments (Staiger and Stock, 1997; Stock and Yogo, 2002). 13 In particular, first-order differencing was used to estimate Equation (4). It is assumed that f(∙) is a smooth function that belongs to a particular parametric family with bounded first derivatives. 206.
(9) adverse selection and/or moral hazard in the life insurance market.. III. Data Our data set includes all OECD countries for the period of 1980–2002. The raw number of suicides and population were obtained from the WHO Mortality Database. The age standardized suicide rate per 100,000 inhabitants was calculated by using the world standard population figures published by WHO. 14 By using this adjustment, the differences in the age structure across countries and time can be controlled. In other words, it is not necessary to include the share of specific age groups in the analysis (Neumayer, 2003). Life insurance density, defined as the per capita gross life insurance premium sold by both domestic and foreign controlled companies, is obtained from the Swiss Re Sigma Database. Foreign market share in life insurance industries, defined as the ratio of gross premium of foreign controlled undertakings and branches and agencies of foreign undertakings to total gross premiums, is obtained from the OECD Insurance Statistical Yearbook. A considerable amount of time and effort was devoted to the collection of information on the key identifying instrument, the length of the suicide exemption period, related laws and regulations, and industrial norms, through our own survey on the life insurance associations and/or companies in each OECD country. These data are gathered for the first time for this study. Dummy variables that represent the length of the suicide exemption period were constructed as follows: the one year exemption period dummy variable takes one if the exemption period is one year, and 0 otherwise; the two year exemption dummy variable takes one if the exemption period is two years, and 0 otherwise; the three year exemption dummy variable takes one if the exemption period is three years, and 0 otherwise; and the infinite year exemption dummy variable takes one if there is no payment for suicide related deaths, and 0 otherwise. The number of observations for zero year exemption period is taken as the default variable for exemption period dummy variables.15 The United States, the Netherlands, and the United Kingdom 14 Unadjusted suicide rates assign equal weight to each suicide, while adjusted suicide rates assign different weights to the suicide rates of different age groups based on the world standardized age profile. This reduces the influence of the country-specific age structure on total population (aggregated) suicide rate. 15 The number of observations on the one-, two-year, three-year and infinite year exemption dummies are 63, 87, 24, and 5, respectively (with a total of 179) in the FE-IV estimation in Table 3. The number of 207.
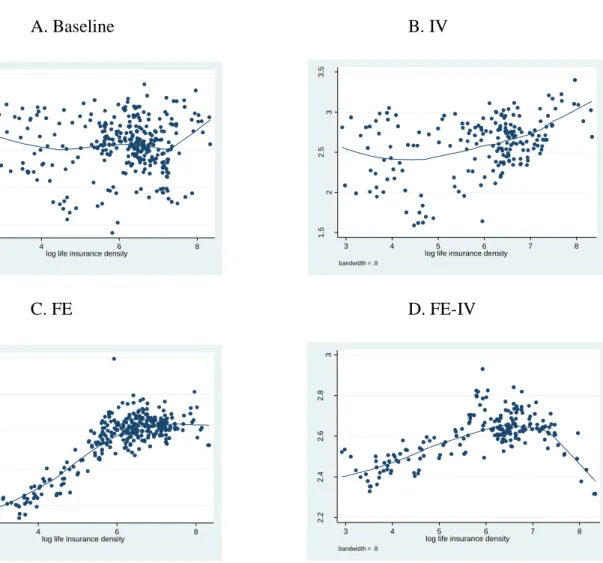
(10) were excluded because the length of the exemption period differs across states in the United States, and the precise information on the length of the suicide exemption period was not available in the cases of the Netherlands and the United Kingdom. With regard to socioeconomic variables, the economic variable—real GDP per capita—was obtained from the Penn World Table 6.2, and the growth rate was calculated based on the real GDP per capita. The unemployment rate was obtained from the OECD health data. As a proxy for income inequality, Gini coefficients based on different definitions were acquired from the United Nations University’s World Income Inequality Database (WIID), and the average of the available Gini coefficients for each country in each year was used as a single index. The birth rate, measured by the ratio of live births to the total population, was taken from the WHO Mortality Database. The divorce rate, measured by the ratio of the number of divorces to the total population, was obtained from the United Nations Common Database. The female labor force participation rate, measured as a percentage of female population ages 15-64 was acquired from the World Development Indicators of the World Bank. Finally, with respect to alcohol consumption, the sales data of pure alcohol, in liters, per individual over 15 years of age were taken from the OECD Health Data. Table 2 lists the definitions of socioeconomic variables and their sources.. IV. Results of the Empirical Analysis As discussed in Section II, since we imposed two refinements in order to deal with the endogeneity problem, we conducted the estimations in the following order: first, Equation (1) was estimated without considering the omitted variables and the simultaneity problems (the baseline specification); second, only the simultaneity problem in Equation (1) was addressed by using the IV technique through Equation (3) (the IV specification); third, only the omitted variable problem in Equation (1) was addressed by including time and country specific fixed effects as well as country specific time trend (the FE specification); finally, we estimated Equation (4), where both the omitted variable problem and the simultaneity problem were accounted for (the FE-IV specification). In the following discussion, the nonparametric estimation results are presented in Figures 2.A–D, and estimation results of the parametric part are provided in Table 3. Since the main focus is on the relationship between the suicide rate and life insurance density, we observations for zero-year exemption period is 20. Note that this is the case where life insurance benefits are paid for any kinds of death including suicide. 208.
(11) commence our discussion with the nonparametric estimation results. Figures 2.A and 1.B present the nonparametric estimation results of the baseline and IV specifications, respectively. These two figures that show a slightly U shaped relationship between suicide rate and life insurance density are quite similar. This implies that either there is no endogeneity problem or the IV method alone fails to appropriately address the endogeneity problem. Indeed, the estimate of the coefficient of η in Table 3 is not significant. However, it may be an artifact of not addressing omitted variable bias although the positive part of the U shaped relationship is consistent with the existence of adverse selection and/or moral hazard in life insurance markets. Figures 2.C and 2.D present the nonparametric estimation results of the FE and the FE-IV specifications, respectively. Taking into account the fixed effects, the results in these two figures are significantly different from the previous results. Figures 2.C and 2.D present a positive relationship between suicide rate and life insurance density, except in the right end tails where the life insurance density is high. This positive relationship is consistent with the existence of adverse selection and/or moral hazard in life insurance markets. A steeper slope in Figure 2.C suggests a more substantial asymmetric information problem. However, the estimate of the coefficient of η in the FE-IV specification (the fourth column of Table 3) is significantly positive. This positive correlation implies that the FE specification overestimates the nonparametric part without taking into account the simultaneity pertaining to life insurance density and suicide. Since the results presented in Figure 2.D and the fourth column of Table 3 take into account both refinements, we believe them to be the most convincing. In addition, a negative relationship between suicide rate and life insurance density is shown in the right end tail of Figure 2.D. This may be considered to be inconsistent with the asymmetric information theory when life insurance density is sufficiently high. One plausible interpretation is the existence of some other relevant unobservable variables that the estimation equations failed to account for. One such example is wealth. On an average, wealthier individuals are likely to purchase more life insurance (life insurance is a normal good); nevertheless, the proportion of coverage for loss in the event of death is likely to decrease with an increase in wealth.16 This implies that death benefits are less valuable for wealthier people. Hence, the financial incentives for suicides from insurance payments are weaker or minimum and hence lead to a negative relationship, as shown in the figure. However, to the best of our knowledge, there have been no studies exploring. 16 Enz (2000) provides evidence suggesting that life insurance is a normal good for high levels of income. 209.
(12) this potential wealth effect. As stated above, Equation (3)—a first stage estimation of regressing the log life insurance density on the exemption period dummies and foreign market share—is used in the IV and FE-IV specifications in order to address the simultaneity problem. In fact, since a short exemption period may induce self selection of riskier types into life insurance contracts, the estimation result of Equation (3) can provide information on the existence of adverse selection. Table 4 shows the result of the first stage estimation. We found that both the three year and infinite year exemption dummies are significantly negative with regard to the level of life insurance density; this suggests that a longer exemption period or no life insurance payment in cases of suicides is associated with a decrease in the purchase of life insurance policies. In other words, a longer exemption period may deter riskier types from purchasing life insurance contracts. As to foreign market share, the result shows a significantly negative sign, which implies that a low level of foreign participation is associated with high levels of life insurance demand, possibly due to severe competition among domestic companies. With respect to the parametric part, a consistent finding is that the real GDP per capita is significantly negative. The female labor force participation rate is significant in the baseline specification; in addition, the birth, divorce, and alcohol consumption rates are significant in the baseline and IV specifications. However, all these variables except the real GDP per capita become insignificant in the FE-IV specification. The coefficient of the Gini index in the baseline and IV specifications suggests a significantly negative relationship between suicide rate and inequality. This puzzling finding may result from the omitted variables bias. Indeed, the coefficient becomes significantly positive after controlling for the fixed effects; nevertheless, it becomes insignificant in the FE-IV specification. V. Concluding Remarks In this paper, we investigate the nexus between life insurance and suicide using OECD cross country data from 1980 to 2002. By using semiparametric IV regressions with fixed effects, this study finds a negative relationship between life insurance demand and the length of suicide exemption period together with a positive relationship between suicide rate and life insurance demand for a majority of observations. These two relationships suggest the presence of adverse selection and moral hazard in life insurance markets. Exceptions are the cases of high levels of life insurance density that may be explained by the wealth effect. 210.
(13) This result challenges the current conception in the literature that life insurance markets are immune to the problems associated with asymmetric information. The novelty of our analysis lies in the use of data on cross country variations in the length of suicide exemption periods and foreign market share in life insurance industries as the main identifying instrumental variables for life insurance density. Nevertheless, the aggregate nature of the data that we used for this study does not allow for a clean differentiation of adverse selection and moral hazard. In further studies, the issues of adverse selection and moral hazard should be investigated by using individual level data. Through this study, we would like to emphasize the importance of studying suicides by employing a somewhat rational approach. If people are willing to recognize that some suicides are rational, studies would be conducted to ascertain the different incentives behind suicides. By this way, we believe that suicide prevention can gather sufficient resources as the seriousness of the current situation warrants, and thereby effective measures of suicide prevention can be developed and implemented. Nevertheless, there is an important caveat to this study, particularly when deriving policy implications: not all suicides are driven by financial incentives. To stop paying suicide related death payments may eliminate the adverse section and moral hazard problems as discussed in this paper, but it also questions the very basic function of life insurance—to protect the beneficiaries against the sudden economic loss associated with the death of their loved ones. These issues should be investigated carefully in the future studies.. 211.
(14) References Amamiya, S., 2002. Costs of Suicide [Jisatsu No Kosuto, in Japanese]. Ohta Shuppan. Beliveau, B. C., 1984. Theoretical and Empirical Aspects of Implicit Information in the Market for Life Insurance. Journal of Risk and Insurance 51(2), 286–307. Blundell, R., Duncan, A., Pendakur, K., 1998. Semiparametric Estimation and Consumer Demand. Journal of Applied Econometrics 13(5), 435–461. Cawley, J., Philipson, T., 1999. An Empirical Examination of Information Barriers to Trade in Insurance. American Economic Review, 89(4), 827–846. Chen, J., Choi, Y., Sawada, Y., 2007. Joint Liability Borrowing and Suicide. Center for International Research on the Japanese Economy Discussion Papers, CIRJE-F534, University of Tokyo. Chiappori, P., 2000. Econometric Models of Insurance under Asymmetric Information In Handbook of Insurance, ed. Georges Dionne, 365-394. North Holland. Chiappori, P., Salanié, B., 2000. Testing for Asymmetric Information in Insurance Markets. Journal of Political Economy, 108(1), 56–78. Durkheim, É ., 1897. Le Suicide: Etude de sociologie, Paris: Alcan (translated by J. A. Spaulding, J. A. and G. Simpson, Suicide: A Study in Sociology, New York, Free Press, 1951). Enz, R., 2000. The S-curve Relationship between Per Capita Income and Insurance Penetration. Geneva Papers on Risk and Insurance 25(3), 396–406. Finkelstein, A., Porterba, J., 2004. Adverse Selection in Insurance Markets: Policyholder Evidence from the U.K. Annuity Market, Journal of Political Economy 112(1), 183-208. Financial Services Agency, 2006. Survey on Consumer Credit Group Life Insurance [in Japanese]. Financial Services Agency, the Japanese Government. Gans, J., Leigh, A., 2006. Did the Death of Australian Inheritance Taxes Affect Deaths? Topics in Economic Analysis and Policy 6(1), Article 23. Gong, X., van Soest, A., Zhang, P., 2005. The Effects of the Gender of Children on Expenditure Patterns in Rural China: A Semiparametric Analysis. Journal of Applied Econometrics 20, 509–527. Hamermesh, D. S., Soss, N. M., 1974. An Economic Theory of Suicide. Journal of Political Economy 82, 83–98. Holly, A., Sargan, D. J., 1982. Testing for Exogeneity in a Limited Information Framework. Cahiers de Recherches Economiques, No. 8204, Universite dc Lausanne. Kopczuk, W., Slemrod, J., 2003. Dying To Save Taxes: Evidence From Estate-Tax Returns On The Death Elasticity. Review of Economics and Statistics 85(2), 256– 265 Li, D., Moshirian, F., Nguyen, F., Timothy, W., 2007. The Demand for Life Insurance in OECD Countries. The Journal of Risk and Insurance 74(3), 637-652. Lokshin, M., 2006. Difference-based Semiparametric Estimation of Partial Linear Regression Models. the Stata Journal, 6, 377–383. Ma, Y., Pope, N., 2008. Foreign Share, Insurance Density, and Penetration: An Analysis of the International Life Insurance Market. Risk Management and Insurance Review 11(2), 327–347. 212.
(15) Mann, J. J., Apter,A., Bertolote,J., Beautrais, A., Currier, D., Haas, A., Hegerl, U., Lonnqvist, J., Malone, K., Marusic, A., Mehlum, L., Patton, G., Phillips, M., Rutz, W., Rihmer, Z., Schmidtke, A., Shaffer, D., Silverman, M., Takahashi, Y., Varnik, A., Wasserman, D., Yip, P., Hendin, H., 2005. Suicide Prevention Strategies: A Systematic Review. Journal of American Medical Association 294, 2064–2074. Neumayer, E., 2003. Socioeconomic Factors and Suicide Rates at Large Unit Aggregate Levels: A Comment. Urban Studies 40, 2769–76. OECD. 2008. Insurance Statistics Yearbook, 2008, OECD Publishing. Rodriguez-Andrés, A., 2005. Income Inequality, Unemployment, and Suicide: A Panel Data Analysis of 15 European Countries. Applied Economics 37(4), 439-451. Staiger, D., Stock, J.H., 1997. Instrumental Variables Regression with Weak Instruments, Econometrica, 65, 557–586. Stock, J. H., Yogo, M., 2002. Testing for Weak Instruments in Linear IV Regression. NBER Working Paper Series 284. Toyokawa, Y., Shirouzu, T., 1998. On the Recent Trend in Suicide Rate [Saikin No Jisatsu-Ritsu No Doukou Ni Tsuite, in Japanese]. Journal of the Association of Life Insurance Medicine of Japan 96, 143–148. Tseng, S. H., 2006. The Effect of Life Insurance Policy Provisions on Suicide Rates, in Chapter 2, Ph.D. dissertation, Three Essays on Empirical Applications of Contract Theory, Department of Economics, University of Chicago. Villeneuve, B., 2000. Life Insurance. Handbook of Insurance, ed. Georges Dionne, 901932. North Holland. WHO. 2007. World Suicide Prevention Day, World Health Organization, September 10, 2007. http://www.who.int/dediacentre/news/statements/2007/s16/en.print.html. Yatchew, A., 1997. An Elementary Estimator of the Partial Linear Model. Economics Letters, 57, 135–143.. 213.
(16) Australia Austria Belgium Canada Czech Republic Denmark Finland France Germany Greece Hungary Iceland Ireland Italy Japan Korea Luxembourg Mexico Netherlands New Zealand Norway Poland Portugal Slovak Republic Spain Sweden Switzerland Turkey United Kingdom United States. Table 1 The Length of Exemption Periods in OECD Countries 1992 1993 1994 1995 1996 1997 1998. 1980-1990. 1991. 1 3 2 2 0 3 2 3 2 1 1 2 1 2 1 2. 1 3 2 2 0 3 2 3 2 1 1 2 1 2 1 2. 1 3 2 2 0 3 2 3 2 1 1 2 1 2 1 2. 1 3 1 2 2 0 3 2 3 2 1 1 2 1 2 1 2. 1 3 1 2 2 0 1 2 3 2 1 1 2 1 2 1 2. 1 3 1 2 2 0 1 2 3 2 1 1 2 1 2 1 2. 1 1 2 2 2 1 0 3 3 1~2. 1 1 2 2 2 1 0 3 3 1~2. 1 1 2 2 2 1 0 3 3 1~2. 1 1 2 2 2 1 0 3 3 1~2. 1 1 2 2 2 1 0 3 3 1~2. 1 1 2 2 2 1 0 3 3 1~2 Different. 1 3 1 2 2 0 1 2 3 2 1 1 2 1 2 1 2 NA 1 1 2 2 2 1 0 3 3 1~2 by states. 1999. 2000. 2001. 2002. Law. 1 3 1 2 2 0 1 2 3 2 2 1 1 2 1 2 1 2. 1 3 1 2 2 0 1 2 3 2 2 1 1 2 1 2 1 2. 1 3 1 2 2 0 1 2 3 2 2 1 1 2 1 2 1 2. 1 3 1 2 2 0 1 2 3 2 2 1 1 2 2 2 1 2. 1 3 1 2 2 0 1 2 3 2 2 1 1 2 2 2 1 2. 1 3 1 2 2 0 1 2 3 2 2 1 1 2 2 2 1 2. 1 1 2 2 2 1 0 3 3 1~2. 1 1 2 2 2 1 0 3 3 1~2. 1 1 2 2 2 1 0 3 3 1~2. 1 1 2 2 2 1 0 3 3 1~2. 1 1 2 2 2 1 0 3 3 1~2. 1 1 2 2 2 1 0 3 3 1~2. 0 1 1 1 0 0 1 1 1 1 1 1 NA 0 1 1 1 1 1 1 1 1 0 0 0 0 1 1 0 0. Data sources: The authors’ survey of life insurance associations in each OECD country. Australia: Accident Research Center: Monash University; Austria: UNIQA Versicherungen AG; Belgium: Vanbreda Insurance Policy; Canada: Judgements of the supreme court of Canada; Czech Republic: Insurance Contact Act: Act No. 37/2004; Denmark: The Danish Insurance Association; Finland: Veritas Life Insurance Company Ltd; France: Insurance code (www.legifrance. gouv.fr); Germany: AXA Konzern AG; Greece: Association of Insurance Companies; Hungary: Hungarian Financial Supervisory Authority; Iceland: Act on Insurance Contracts, No 30/2004; Ireland: Eagle Star; Italy: Assicurazioni Generali; Japan: Life Insurance Association of Japan; Korea: Korea Life Insurance Association, Luxembourg: Association des Compagnies d'Assurances; Mexico: Asociacion Mexicana de Instituciones de Seguros; Netherlands: Dutch Association of Insurers; New Zealand: Insurance Council of New Zealand Inc.; Norway: Norwegian Financial Services Association; Poland: Polish Chamber of Insurance; Portugal: Portuguese Insurers Association; Slovak: Republic Slovenská asociácia poisťovní; Spain: Association of Spanish Insurers; Sweden: Svenska Försäkringsföreningen; Switzerland: Swiss Insurance Association; Turkey: Association of the Insurance and Reinsurance Companies of Turkey; United Kingdom: Association of British Insurers; and United States: different across states. Notes: 1. In the United States, most states(33) have a two-year suicide exemption period: Alabama, Alaska, Arizona, Arkansas, California, Delaware, Georgia, Hawaii, Idaho, Illinois, Kentucky, Louisiana, Maine, Maryland, Minnesota, Montana, Nebraska, Nevada, New Hampshire, New Mexico, New York, North Carolina, Oklahoma, South Carolina, South Dakota, Tennessee, Texas, Utah, Virginia, Washington, West Virginia, Wisconsin, and Wyoming. Two states—Colorado and North Dakota—specify a one-year provision. In the following fourteen states and the District of Columbia, the length of the suicide exemption period exclusion is not addressed: Connecticut, Florida, Indiana, Iowa, Kansas, Massachusetts, Michigan, Mississippi, New Jersey, Ohio, Oregon, Pennsylvania, Rhode Island, and Vermont. Finally,214 Missouri has a law that invalidates the suicide clause. 2. With the exception of the United States, among the OECD countries, there are laws governing the length of the suicide exemption period (in 20 countries; law = 1). The length of the suicide exemption period in the other nine countries were determined by industrial norms (law = 0)..
(17) Table 2 Variables and Data Sources Variable. Definition. Source(s). Suicide rate. Rate per 100,000 people. Birth rate. Live birth to total population. Population. --. Life insurance density. Life insurance premium/population. Swiss Re Sigma database. Foreign market share. Foreign-controlled undertakings and branches, and agencies of foreign undertakings/total domestic business on a gross premiums basis. OECD Insurance Statistical Yearbook. Per capita GDP. Real GDP. Per capita GDP growth rate. Real GDP growth rate. Unemployment rate. % of total labor force. WHO Mortality Database (last updated: Nov 17, 2006). Penn World Table 6.2, 2006. Alcohol consumption. liters per person aged 15 and above. OECD Health Data 2005 Additional source for alcohol consumption (only for Japanese data): National Tax Agency, Japan. Divorce rate. % of total population. United Nations Common Database, 2007. Gini coefficient. Average of Gini indices from different definitions. World Income Inequality Database, V 2.0b, May 2007. Female labor force participation. % of female population ages 15-64. World Development Indicators, 2006. 215.
(18) Table 3 Summary Results of the Parametric Part Model specification Controlled for fixed effects Instrumental variable estimation Variables Per capita GDP Per capita GDP growth rate Unemployment rate Female labor force participation Birth rate Divorce rate Alcohol consumption Gini coefficient. ηˆ Number of observations. Baseline No No. IV No Yes. FE Yes No. FE-IV Yes Yes. Estimate. Estimate. Estimate. Estimate. ***. -0.1301 (0.0552) -0.8214 (0.9446) * -1.1835 (0.6828) *** 0.0524 (0.0103) *** 0.3899 (0.1456) ** 0.0852 (0.0339) *** 0.0475 (0.0101) *** -0.0389 (0.0057) ---. -0.2853 (0.0657) 0.7240 (1.0836) 0.0895 (0.7669) 0.0074 (0.0135) 0.4708 (0.1701) 0.3541 (0.0570) 0.0378 (0.0111) -0.0298 (0.0083) 0.2466 (0.1915). ***. ***. ***. ***. ***. ***. –0.4600 (0.0993) –0.1560 (0.2405) -0.0211 (0.4279) -0.0128 (0.0152) 0.0430 (0.0757) ** 0.0615 (0.0305) -0.0012 (0.0147) ** 0.0049 (0.0020) ---. ***. -0.6364 (0.1183) 0.1380 (0.2774) -0.3068 (0.5457) -0.0194 (0.0180) -0.1115 (0.1756) 0.0305 (0.0404) -0.0209 (0.0179) 0.0040 (0.0026) ** 0.1367 (0.0543). R-squared. 308 0.4421. 196 0.6237. 308 0.9861. 196 0.9914. Significance test statistics for the nonparametric part [p-value]. 1.284 [0.100]. 1.785 [0.037]. 4.880 [0.000]. 7.088 [0.000]. Notes: 1. The estimation is done by using the nonparametric part for life insurance density country-fixed effect, time-fixed effect, and country-specific linear time trend, which are not shown in the table. 2. Robust standard errors provided in parentheses. 3. * significant at 10%; ** significant at 5%; *** significant at 1%.. 216.
(19) Table 4 Life Insurance Density Equation Regression Results (First-Stage Instrumental Variable Regression) Coefficient 0.0251 -0.0180 -0.0480 -0.0932 -0.0014 0.9607 -0.0191 1.1573 -0.3586 0.0049 -0.1401 -0.0120 0.0038 0.0019 0.3123. One-year exemption dummy Two-year exemption dummy Three-year exemption dummy Infinite year exemption dummy Foreign Market Shares Lag life insurance density Per capita GDP Per capita GDP growth rate Unemployment rate Female labor force participation Birth rate Divorce rate Alcohol consumption Gini coefficient Constant Overall R-squared. * * ** ***. **. ***. Std.Err. (0.0255) (0.0168) (0.0234) (0.0454) (0.0006) (0.0159) (0.0194) (0.7056) (0.1807) (0.0038) (0.0444) (0.0217) (0.0031) (0.0026) (0.2268). 0.9864 171301.36. Wald statistics for zero coefficients [p-value] Number of observations Number of countries. 0.0000 207 25. Notes: 1. The estimation is done by using random effects; robust standard errors are in parentheses. 2. * significant at 10%; ** significant at 5%; *** significant at 1%.. 217.
(20) Figure 1. A Jump on the Suicide Index after the Expiration of the Suicide Exemption Period in Japan. 150. suicide index. 135 120 105 90 75 60 1. 2. 3. 4. 5. 6. 7. 8. 9 10 11 12 13 14 15 16 17 18 19 20 21 22 23 24 months after constracts start. Note: The suicide index of the average number of suicides in the first 12 months is set to 100. Source: This figure is reproduced from Figure 5-4 in Costs of Suicide [Jisatsu No Kosuto, in Japanese], Amamiya, Shorin, 2002, Ohta Shuppan.. 218.
(21) Figure 2. Nonparametric Plots of the Relationship between Suicide Rate and Life Insurance Density. B. IV. 3 2.5. log suicide rate. 2.5. 1.5. 1.5. 2. 2. log suicide rate. 3. 3.5. 3.5. A. Baseline. 2. 4. 6 log life insurance density. 3. 8. 4. 7. 8. D. FE-IV. 2.6 2.2. 2.2. 2.4. 2.4. 2.6. log suicide rate. 2.8. 2.8. 3. 3. C. FE. log suicide rate. 5 6 log life insurance density. bandwidth = .8. bandwidth = .8. 2. 4. 6 log life insurance density. 3. 8. bandwidth = .8. bandwidth = .8. 219. 4. 5 6 log life insurance density. 7. 8.
(22)
數據
相關文件
Wang, Solving pseudomonotone variational inequalities and pseudocon- vex optimization problems using the projection neural network, IEEE Transactions on Neural Networks 17
volume suppressed mass: (TeV) 2 /M P ∼ 10 −4 eV → mm range can be experimentally tested for any number of extra dimensions - Light U(1) gauge bosons: no derivative couplings. =>
We explicitly saw the dimensional reason for the occurrence of the magnetic catalysis on the basis of the scaling argument. However, the precise form of gap depends
Define instead the imaginary.. potential, magnetic field, lattice…) Dirac-BdG Hamiltonian:. with small, and matrix
incapable to extract any quantities from QCD, nor to tackle the most interesting physics, namely, the spontaneously chiral symmetry breaking and the color confinement..
• Formation of massive primordial stars as origin of objects in the early universe. • Supernova explosions might be visible to the most
Miroslav Fiedler, Praha, Algebraic connectivity of graphs, Czechoslovak Mathematical Journal 23 (98) 1973,
and Jorgensen, P.l.,(2000), “Fair Valuation of Life Insurance Liabilities: The Impact of Interest Rate Guarantees, Surrender Options, and Bonus Policies”, Insurance: Mathematics
