Modeling an emergency medical services system
using computer simulation
Syi Su
a,*
, Chung-Liang Shih
baInstitute of Health Care Organization Administration, School of Public Health, National Taiwan University, No. 1, Sec. 1, Jen Ai Road, Rm. 1512, Taipei 100, Taiwan, ROC
bDepartment of EmergencyMedicine, National Taiwan UniversityHospital, No. 1, Sec. 1, Jen Ai Rd, Rm. 1512, Taipei 100, Taiwan, ROC
Received 29 January 2003 ;received in revised form 19 August 2003;accepted 21 August 2003
KEYWORDS Reallocation; Computer simulation; Emergency medical service; Prehospital care; Utilization
Summary Studyobjectives: In the emergency medical services (EMS) system,
appro-priate prehospital care can substantially decrease casualty mortality and morbidity. This study designed a simulation model, evaluated the existing EMS system, and sug-gested improvements. Methods: The study focused on 23 networked EMS hospitals affiliated with 36 emergency response units (subgroups) to perform two-tier rescues (advanced life support [ALS] in addition to basic life support [BLS] services) in Taipei, Taiwan. Using the existing EMS model as a base, this research constructed a computer simulation model and explored several model alternatives to achieve the study’s ob-jectives. The virtual models varied with staffing level, number of assigned emergency network hospitals, and various two-tier rescue probabilities. Results: Increasing the staffing to two teams for Hospital 22 lessened the call waiting probability (delay be-tween rescue call and ambulance dispatch) by 50%, even if the dispatch rate of the two-tier rescue increased from the empirical 2% to a simulated 10 and 20%. Changing the two-tier rescue pattern so each EMS subgroup cooperated with two specific, preas-signed network hospitals lowered the probability of patients having to wait for rescue dispatch to under 1%. Conclusion: The following alternatives provided the greatest combination of effectiveness, quality patient care, and cost-efficiency: (1) because of its unique location, increase Hospital 22’s staffing level to two ALS teams. (2) Es-tablish a specific rescue protocol for the two-tier system that preassigns two network hospitals to each of the 36 EMS subgroups along with a prearranged calling sequence. If implemented, this will improve EMS performance, streamline the system, reduce randomness, and enhance efficiency.
© 2003 Elsevier Ireland Ltd. All rights reserved.
1. Introduction
Prehospital care is an important issue in the emer-gency services system. There is much
documen-*Corresponding author. Tel.: +886-11-2-2341-2520; fax: +886-11-2-2341-2520.
E-mail address: [email protected] (S. Su).
tation in the literature that appropriate prehos-pital care can significantly decrease the mortality and morbidity of casualties. The literature reveals that the survival rate for those non-traumatic car-diac arrest patients can be raised substantially through appropriate prehospital care [1—8]. The possible impact factors range from the prehospi-tal care intervention time, the execution of car-diac pulmonary resuscitation (CPR) by bystanders,
1386-5056/$ — see front matter © 2003 Elsevier Ireland Ltd. All rights reserved. doi:10.1016/j.ijmedinf.2003.08.003
58 S. Su, C.-L. Shih population density, the ambulance transportation
distance, the execution of automatic external de-fibrillators and the emergency services models
[4,9—11]. Cummins pointed out that for cardiac arrest clients every minute delayed on rescue in-tervention decreases the survival rate by 7—10%
[12]. Cummins et al. also observed that if CPR was executed within 5 min of cardiac arrest and defibrillation occurred within 10 min of cardiac arrest, the percentage of survival until hospital discharge was 30%;otherwise, it was less than 7%
[13]. As to the impact of the emergency services model on the survival rate of those cardiac arrest patients, Eisenberg et al. mentioned that if basic life support (BLS) technicians were assigned for the prehospital rescue, the success rate was about 2—9%. If advanced life support (ALS) technicians were assigned instead, the survival rate may reach 7—18%. Moreover, if basic life support technicians can cooperate with advanced life support techni-cians to serve as a two-tier rescue model, then the survival rate can be expected to reach 4—26%[9]. Nichol et al. evaluated the cost-effectiveness of various emergency services models from society’s viewpoint and explored the method where BLS technicians provide the rescue service at the first tier and ALS technicians provide the rescue at the second tier. Such a two-tier rescue model was far more cost-effective than the one-tier one[14]. Al-though research showed that the two-tier rescue model has a higher survival rate than the one-tier rescue model for prehospital cardiac arrest pa-tients, the question ‘‘Which model is best?’’ does not have a definite answer. Different countries and regions, based on their resource availability and specificity, developed their own rescue model. De-veloping countries, particularly, may equip a com-plex ambulance transportation system to provide rescue services. However, no matter which kind of emergency services system it is, the expenditure is not low. Hence, it is the policy maker’s goal to develop and provide a cost-effective emergency rescue model that meets the population’s demand despite limited resources.
The United States developed its emergency ser-vices system in the mid-1960s. The 1973 Emergency Services Act defined emergency services as ‘‘[a] system that provides for the arrangement of per-sonnel, facilities, and equipment for the effective and coordinated delivery of health care services un-der emergency conditions and that is administered by a public or non-profit entity with authority and the resources to provide effective administration of the system’’ [15]. In 1981, the emergency ca-sualties rescue codes and ambulance management rule was enacted in Taiwan. This was the beginning
of Taiwan’s emergency services system. In 1995, the Emergency Services Law was passed and hence acted as a prehospital rescue basis. Until now, most areas in Taiwan operated the EMS model mainly with a one-tier system that was staffed with BLS teams (Level I emergency medical technicians [EMTs]) pro-viding rescue for traffic accidents, traumatic in-juries, emergency diseases, intoxication accidents, etc.;however, the 2—6% survival rate of prehospi-tal cardiac arrest patients was far lower than the foreign countries’ rate of 2—44% [16]. Thus, the Taipei municipal government selected a number of specially qualified hospitals to form an emergency care hospital network with responsibility for the en-tire urban area. The secondary tier rescue model provided by these network hospitals can cooperate with the original first-tier BLS rescue model pro-vided by the fire department. Thus, jointly, they can gradually establish the two-tier rescue model. The cost-effectiveness of this two-tier system should be carefully evaluated to provide a reference for fu-ture EMS model planning.
It was the goal of this study to devise an EMS model to provide the desired high performance at the lowest possible resources.
2. Material and methods
2.1. Overview
This research utilized a computer simulation method and took the EMS model of the subject sys-tem, the Taipei Emergency Medical Services System (TEMSS), as a base. We constructed a simulation model and manipulated the model’s parameters and outcome analysis to identify optimum condi-tions. Analysis and evaluation revealed the effi-ciency of the two-tier rescue model. The model proposed several alternatives that may enhance the performance.
2.2. The Taipei Emergency Medical
Services System
Taipei is located in northern Taiwan and is a highly industrialized city with an area of 272 km2, a
popu-lation of 2.6 million, and 12 administrative districts. From those hospitals with special capabilities to handle emergency services, 23 were selected to form a network responsible for all 12 administra-tive districts. One or two network hospitals were assigned to each district to provide treatment of prehospital patients. The network hospitals co-operate with the Municipal Fire Department’s 36
affiliated emergency service subgroups within the districts to make up the Taipei Emergency Medical Services System (TEMSS). The TEMSS had used the two-tier rescue model since June 1999. Emergency medical technicians from the fire department act as the first tier to provide basic life support. Hos-pital medical care personnel act as the second tier and integrate with the first tier to provide advanced life support services.
2.3. Two-tier rescue system procedure
2.3.1. Basic procedure
Whenever the 119 Rescue Center gets an inci-dent rescue call, the rescue center dispatcher obtains details of the incident (which could be, for example, prehospital cardiac arrest, chest pain, falls, trauma, poisoning, etc.) and make a spur-of-the-moment decision whether advanced life support techniques should intervene in this specific prehospital rescue event. If so, the nearest EMS subgroup’s response unit (staffed with two BLS EMTs) is dispatched to the rescue task. Simulta-neously, the rescue center informs the designated network hospital to send medical care personnel to participate in the event-site rescue. The first-tier response unit offers primary assessment and basic management but still has to wait for the second-tier medical team’s arrival. After an advanced as-sessment and treatment, the casualties are then transported to the assigned network hospital. The first-tier team accompanies the second-tier rescue team to the emergency department. The teams re-port the process and transfer the casualties to the hospital. The first-tier team may then return to its base to be available for the next response.
If the dispatcher judges the incident a general case (not requiring advanced life support tech-niques), he or she dispatches the EMTs of the BLS re-sponse unit to the event site. Through their on-site assessment and primary treatment, they indepen-dently send the casualties to the assigned network hospital for advanced medical care treatment.
2.3.2. Current system details
Under the current system, generally each EMS sub-group cooperates with three hospitals;however, a single hospital may have up to 13 subgroups within its jurisdiction. Thus, hospitals located in the bor-derline of two areas may end up with too many assignments. This makes the dispatcher’s job of selecting hospitals complex. The system does not run smoothly and rapidly. The irregular dispatching pattern of responsible hospitals makes the system confusing, depending highly on the dispatcher’s experience. No established calling sequence or
pro-tocol exists. Each hospital has one ALS rescue team available. If this team is busy and a new rescue call comes in, patients may have to wait, or the dis-patcher may call another hospital. It rarely happens that both of the two assigned hospitals are busy, but if they are, the dispatcher may call a third hospital. This aim of the study was to streamline and bal-ance the system;to determine the optimal solu-tion of preassigning specific, responsible hospitals to each EMS to speed up and enhance the system; and to fulfill rescue errands with the lowest cost and yet decrease in response time while reducing call waiting probability (delay in rescue dispatch).
2.4. Model building
This research utilized fourth generation, object-oriented simulation software, eM-Plant [17], to build the model and took the Taipei Emergency Ser-vices System as the subject. The steps and methods were as follows:
1. Clarification of the operational flowchart of the
subject system: Interviews were conducted with
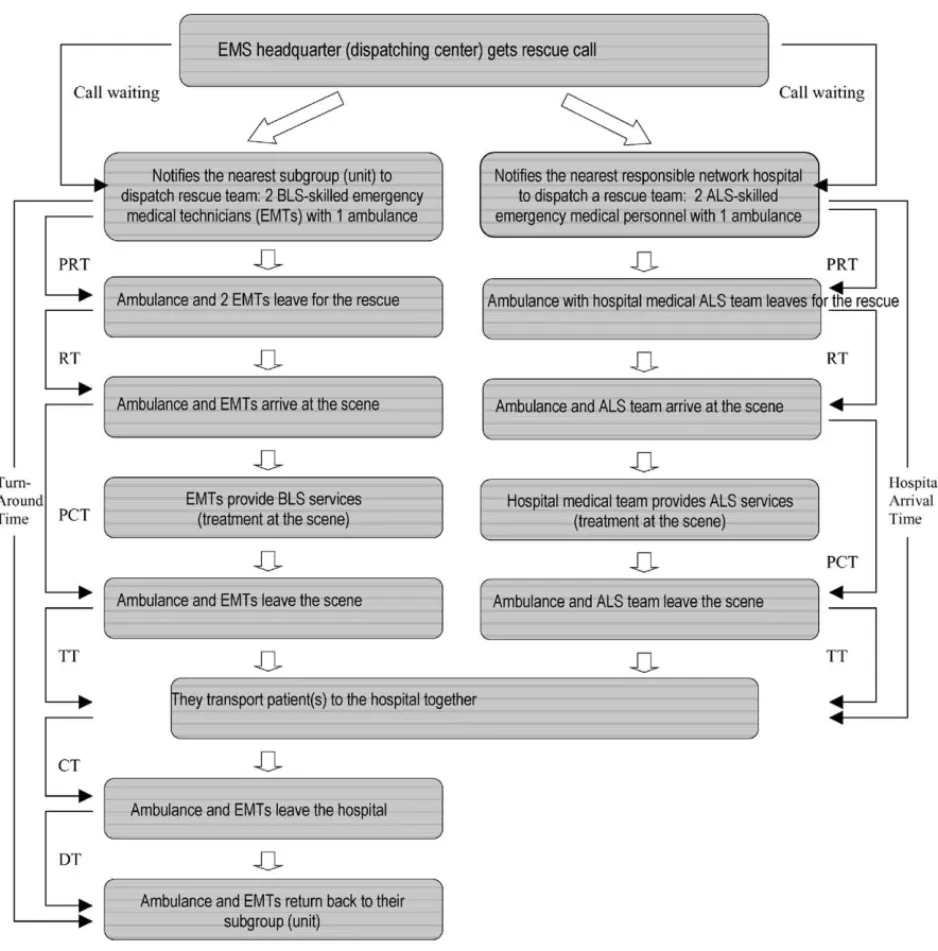
three specialists familiar with the complete res-cue model of both tiers of the subject system (seeFig. 1).
2. Data collection and analysis: The prehospital rescue records including BLS and ALS informa-tion dating from 1—31 December 2000, were collected. The content covered information such as name of the response unit, time dispatch notified, time unit notified, time unit responds, time of arrival at scene, time at which the unit left the scene, time of arrival at destination hospital, time at which the unit left the hos-pital, and time back in service [18]. The time interval between every two event segments for a rescue event was counted to determine the following: preparation time (PRT, interval between the time the unit is notified and the time it responds), response time (RT, interval between the time the unit responds and the time it arrives at the scene), processing time (PCT, interval between the time the unit arrives at the scene and the time it leaves the scene),
transport time (TT, interval between the time
the unit leaves the scene and arrives at hospi-tal), caring time (CT, interval between the time the unit arrives at the hospital and the time it leaves the hospital), and departure time (DT, interval between the time the unit leaves the hospital and the time the unit is back in service for the next rescue call) (seeFig. 1). The input variables and definitions were summarized in
60 S. Su, C.-L. Shih
Fig. 1 Two-tier rescue pattern—a complete turn-around. EMS: emergency services;BLS: basic life support;ALS:
advanced life support;EMT: emergency medical technician. Call waiting time: interval between patient’s emergency call, the dispatcher assigning a specific EMS subgroup (with corresponding network hospital) to the rescue, plus any potential waiting time if the ambulance rescue team is currently occupied with another job. Hospital arrival time: period between dispatching call and patient’s hospital arrival (includes the on-site rescue time). Turn-around time: interval between the dispatching call and the BLS team’s return back to its subgroup. Preparation time: PRT, interval between the time the rescue unit is notified and the time it responds. RT: response time, interval between the time the unit responds and the time it arrives at the scene. PCT: processing time, interval between the time the unit arrives at the scene and the time it leaves the scene. TT: transport time, interval between the time the unit leaves the scene and arrives at hospital. CT: caring time, interval between the time the unit arrives at the hospital and the time it leaves the hospital. DT;departure time, interval between the time the unit leaves the hospital and the time the unit is back in service for the next rescue call.
Table 1 Input variables and definitions Input variables Definitions
Inter-arrival time
distribution Probability distribution of inter-arrival time which two successive rescue calls were placedto the dispatch center Arrival distribution Probability distribution of time which dispatch center was notified by rescue call
Preparation time Interval between the time the unit is notified and the time it responds
Response time Interval between the time the unit responds and the time it arrives at the scene Processing time Interval between the time the unit arrives at the scene and the time it leaves the scene Transport time Interval between the time the unit leaves the scene and arrives at hospital
Caring time Interval between the time the unit arrives at the hospital and the time it leaves the hospital Departure time Interval between the time the unit leaves the hospital and the time the unit is back in
service for the next rescue call
select the best-fitting distribution of the above times. Then, the corresponding distributions were fed into the simulation model-building program. This included the following: dispatch frequency, type of rescue (one-tier or two-tier), utilization distribution of the two rescue types, and percentage of each assigned network hos-pital as a rescue destination.
3. Establishment of the basic model: Based on the previously confirmed prehospital rescue flowchart, the system simulation model was developed by eM-Plant as depicted in Figs. 2 and 3. This simulation software is an entirely object-oriented program using object-oriented graphic and integrated modeling for simulating and visualizing systems and business processes. Its users have the following advantages: (1) can built hierarchical models either from bottom-up or top-down;(2) can reuse of submodels or part of models stored in engineering data base;(3) can use several modeling techniques for dif-ferent levels to verify the results of each level and increase productivity dramatically;(4) can centralize and define changes of all relevant system’s parameters in one table;(5) can real time integrate with other software. Its input data were distributions of event inter-arrival time, preparation time, response time, pro-cessing time, transport time, caring time, and
leave time (departure from the subgroup for a
rescue) or idle errand (IE) time (time interval between departure from the subgroup and re-turn to the subgroup without fulfilling a rescue). The two-tier rescue probability and distribu-tion types of the corresponding time periods copied the probability distribution types of the historical data. The outcome variables included the utilization rates of each ambulance/rescue team, each subgroup, and the clients’
wait-ing time (time between event report call and
rescue team’s arriving). Different random
num-ber seeds were utilized to replicate the event 100 times in order to derive the outcome variables.
4. Validation and verification of the simulation
model: (1) The established simulation model was
presented to experts familiar with prehospital rescue operations to confirm the correctness and logic of the system flow. (2) Experts of simula-tion software and programming were requested to verify the developed simulation model. (3) The simulation outputs were compared with the empirical data to validate the model.
5. Analysis of output data: Potential alternatives were proposed to improve system performance. Each alternative was simulated, and the cor-responding performances were observed and compared. Significant performance variables included the following: (1) call waiting (a call for ambulance dispatch that awaits execution). A rescue delay occurs when a hospital receives a dispatch order and has no ALS ambulance team available to go to the rescue because it is occupied with another job. Call waiting time (interval between patient’s emergency call, the dispatcher assigning a specific EMS subgroup [with corresponding network hospital] to the rescue, plus any potential waiting time if the ambulance rescue team is currently occupied with another job). (2) ALS and BLS event-site
arrival times (interval between the
dispatch-ing call and arrivals of the first and second tier teams on-site). (3) Hospital arrival time. (Period between the dispatching call and the patient’s hospital arrival. It includes the on-site rescue time.) (4) Ambulance utilization rate (percentage of time the ambulance is being used instead of being idle). (5) Turn-around
time (interval between the dispatching call and
the BLS team’s return back to its subgroup). The following alternatives were analyzed in sequence:
62 S. Su, C.-L. Shih
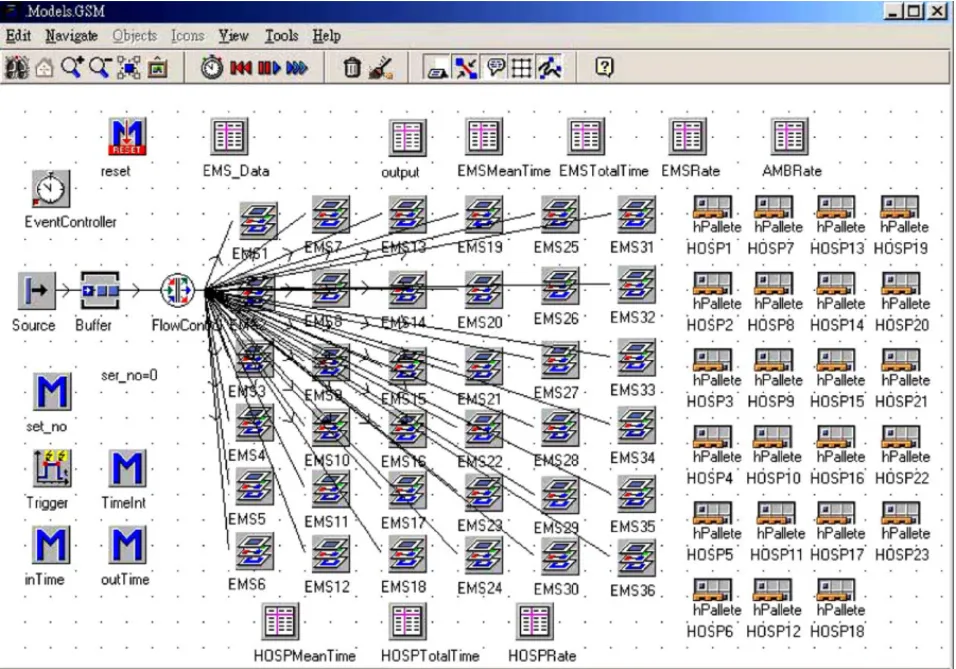
Fig. 2 The main system simulation model of the Taipei Emergency Medical Service System (two-tier rescue pattern)
Screen display of software program eM-Plant, version 4.6.4. [28]The program is started with the Trigger object. Entities (event calls) are created in the Source object. The arrival times of three work shifts are entered. This activates the TimeInt object (method). The entities are then sent to the Buffer object to await entering the Flow Control object. The Flow Control object contains the probability distribution of dispatches across the 36 EMS subgroups (units). Based on this probability distribution, each entity is sent to its corresponding dispatcher, one of the EMS subgroups (EMS1 to EMS36). Event Controller object: coordinates and synchronizes the different events taking place during a simulation. reset object (method): reactivates a simulation model. Output, EMSMeanTime, EMSTotalTime, EMSRate, AMBRate, HOSPMeanTime, HOSPTotalTime, HOSPRate objects: the tables that carry the simulation output data. EMS Data object: the basic input data for simulation modeling. HOSP1—HOSP23 objects: cooperative/assigned network hospitals set no object (method): counts the number of entities (event calls) and their sequence. inTime, outTime object (method): gathers the start and end time of each rescue event segment.
• Alternative 1: One fixed network hospital was assigned to each emergency services sub-group to provide a two-tier rescue service. Each hospital’s rescue unit was composed of one ALS-skilled medical team and one ambulance.
• Alternative 2: The number of two-tier rescue
units (rescuers and ambulances) assigned to
each network hospital was adjusted, based on the utilization rate and the probability of patients having to wait for rescue (due to the hospital not having a rescue team available). After the software simulated the various com-binations of utilization rates and level of reso-urces committed, the results were compared.
• Alternative 3: The cooperation team mix be-tween the emergency services subgroup and the assigned network hospitals was changed, taking the proximity of the area into consid-eration. Each emergency services subgroup had the flexibility to cooperate with two to three network hospitals to provide two-tier rescue services. Each subgroup could arrange the dispatch sequence among the potentially cooperative hospitals in advance. When the first sequence was not available, then the sec-ond sequence performed the rescue. Based on this rule, three dispatch models were sim-ulated separately and then compared:
Model 2— two hospitals in prearranged sequence,
and Dispatch Model 3—three hospitals in prear-ranged sequence.
• Alternative 4 (Varied dispatch rate): Using the three dispatch models from above, the dispatch rate of the two-tier rescue was manipulated as 2, 10, and 20%, respectively. The dispatch rate was defined as the percentage of runs to which a given ALS ambulance might be assigned. The probabil-ity of calls waiting and the utilization rates were then compared.
Table 2 Current personnel staffing level, rescue unit dispatch rate, and cooperative/assigned network hospitals across 36 emergency services subgroups
Emergency
services subgroup BLS personnel staffing level(number of rescue teams) Dispatchrate (%) Cooperative/assignednetwork hospitals
EMS 1 2 4 HOSP 10, 13, 6 EMS 2 2 2.38 HOSP 12, 2, 20 EMS 3 1 1.14 HOSP 12, 19, 23 EMS 4 1 1.43 HOSP 14, 16, 1 EMS 5 1 0.67 HOSP 19, 23, 20 EMS 6 2 2.32 HOSP 3, 10, 6 EMS 7 2 5.87 HOSP 1, 23, 14 EMS 8 2 1.7 HOSP 23, 19, 11 EMS 9 3 5.47 HOSP 22, 8, 5 EMS 10 1 2.03 HOSP 5, 8, 3 EMS 11 2 2.76 HOSP 23, 11, 20 EMS 12 2 2.29 HOSP 23, 19, 20 EMS 13 3 5.17 HOSP 3, 15, 4 EMS 14 2 1.46 HOSP 2, 12, 23 EMS 15 1 1.73 HOSP 5, 3, 15 EMS 16 2 1.4 HOSP 16, 1, 9 EMS 17 2 2.37 HOSP 9, 3, 13 EMS 18 2 3.83 HOSP 12, 10, 6 EMS 19 1 4.3 HOSP 20, 12, 19 EMS 20 3 3.24 HOSP 3, 5, 15 EMS 21 2 4.64 HOSP 4, 9, 15 EMS 22 2 2.46 HOSP 9, 10, 14 EMS 23 1 2.13 HOSP 5, 2, 8 EMS 24 2 1.39 HOSP 12, 2, 5 EMS 25 3 2.8 HOSP 22, 18, 5 EMS 26 2 1.31 HOSP 5, 12, 2 EMS 27 1 0.25 HOSP 19, 11 EMS 28 2 3.33 HOSP 12, 10, 5 EMS 29 2 2.03 HOSP 22, 10, 21 EMS 30 1 0.45 HOSP 20, 19, 23 EMS 31 2 3.21 HOSP 20, 19, 23 EMS 32 2 2.69 HOSP 8, 5, 1 EMS 33 3 4.74 HOSP 8, 2, 5 EMS 34 2 7.58 HOSP 8, 5, 7 EMS 35 2 4.2 HOSP 19, 12, 5 EMS 36 1 1.23 HOSP 17, 19, 23
Note: Currently each subgroup cooperates with one assigned (fixed) hospital and has the flexibility to cooperate with one or two additional cooperative network hospitals to provide two-tier rescue services. Each subgroup is equipped with one BLS rescue unit consisting of one rescue team (two EMS technicians) and one ambulance. BLS: basic life support.
3. Results
3.1. Empirical data
The subject system performed a total of 6421 pre-hospital rescue jobs from 1—31 December 2000. Among those, 128 jobs (about 2%) were a two-tier rescue. The current BLS personnel staffing levels, dispatch rates, and cooperative/assigned network hospitals across the 36 emergency services sub-groups are revealed in Table 2. The established
64 S. Su, C.-L. Shih
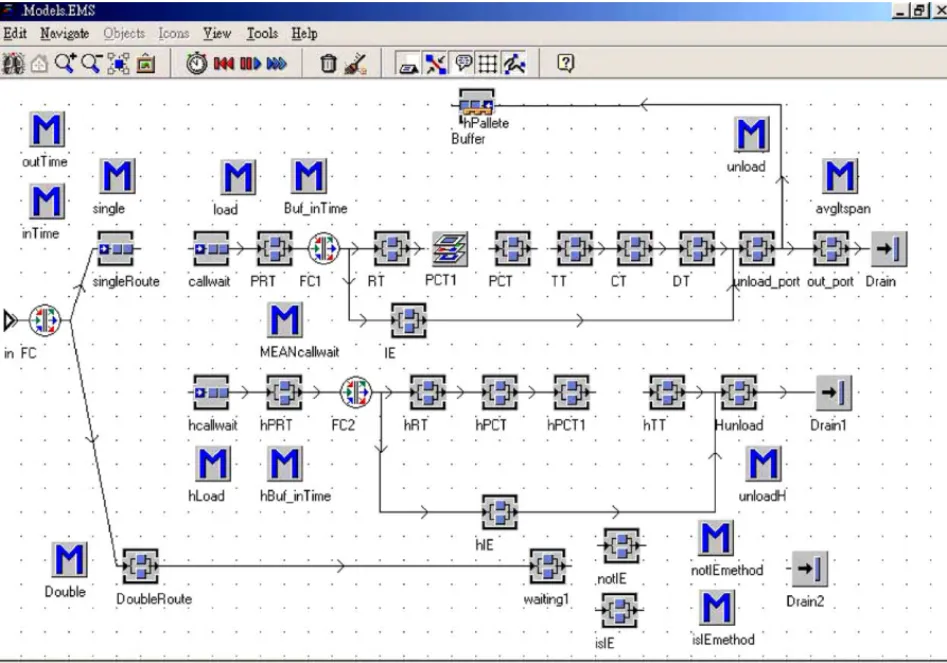
Fig. 3 Simulation model of 1 of 36 subsystems of the Taipei Emergency Medical Service System (two-tier rescue
pattern) Screen display of software program eM-Plant, version 4.6.4. [28] This is an operational display example of one subgroup from the main system shown inFig. 2. The subsystem describes the flowchart of each subgroup (unit). Entities (rescue event calls) enter the subsystem through the in object (interface), then go to the FC object, which contains the probability distributions of the one-tier- and two-tier system. For the ‘one-tier system,’ entities (rescue event calls) enter the singleRoute object, then activate the single object (method), then go to the callwait object that activates the callwait object method, a method to calculate the waiting time while the next process is still in busy. The Buffer1 object also activates the load object, a method to move the entity onto the pallete object (ambulance) and to load the pallete object (ambulance) from the Buffer object to the PRT object. Based on the probability distribution of actual and idle errands carried in the FC1 object, the entities (rescue event calls) go to process of RT-PCT1-PCT-TT-CT-DT or IE, respectively. They then enter the unload port object, which activates the unload object, a method to unload entities to the out port object and to move the pallete objects (ambulances) back to the Buffer object. The out port object also activates the avgltspan object, a method to calculate the average life span for each entity. The entities then terminate in the Drain object, which ends the subgroup’s operation. For the ‘two-tier system,’ entities (rescue event calls) enter the DoubleRoute object, then activate The double object method, a method which create entities (rescue event calls) in the callwait object and the hcallwait object. The flowchart of entities (rescue event calls) which enter the callwait object is just same as the flowchart for the one-tier system;except the entities (rescue event calls) moving to PRT-RT-PCT1-PCT have to wait for those entering the hcallwait object to reach hPCT1 before moving to TT-CT-DT. The other entities (rescue event calls) enter the hcallwait object that activates the hBuf inTime object, a method to calculate the waiting time while the next process is still in busy. The hcallwait object also activates the hload object, a method to move the entity onto the pallete object (ambulance) and to load the pallete object (ambulance) from one of the cooperative/assigned network hospitals (HOSP1—HOSP23) to the hPRT object. Based on the probability distribution of actual and idle errands carried in the FC2 object, the entities (rescue event calls) go to the process of hRT-hPCT-hPCT then wait for the ones entering the callwait object to reach PCT, before move to hTT. They then enter the Hunload object, which activates the unloadH object, a method to unload entities to the Drain1 object and to move the pallete objects (ambulances) back to one of the cooperative/assigned network hospitals (HOSP1-HOSP23). The entities (rescue event calls) which enterered the hcallwait object then terminate in the Drain1 object. If the entities (rescue event calls) are idle errands (false alarm, not resulting in a rescue), they will activate the isIE object. inTime, outTime method: gathers the start time and end time of each entity (rescue event call). PRT object: preparation time—interval between the time the subgroup unit is notified and the time it responds by sending an ambulance rescue team.
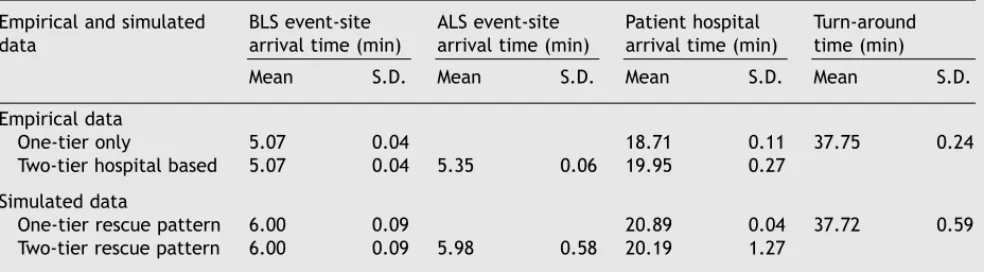
Table 3 Comparison of empirical data with simulation results for one- and two-tier rescues across 36 subgroups associated with 23 hospitals
Empirical and simulated
data BLS event-sitearrival time (min) ALS event-sitearrival time (min) Patient hospitalarrival time (min) Turn-aroundtime (min)
Mean S.D. Mean S.D. Mean S.D. Mean S.D.
Empirical data
One-tier only 5.07 0.04 18.71 0.11 37.75 0.24
Two-tier hospital based 5.07 0.04 5.35 0.06 19.95 0.27
Simulated data
One-tier rescue pattern 6.00 0.09 20.89 0.04 37.72 0.59
Two-tier rescue pattern 6.00 0.09 5.98 0.58 20.19 1.27
Note: BLS, basic life support;ALS, advanced life support. Event-site arrival time: interval between the dispatching call and the BLS/ALS team’s arrival on-site;hospital arrival time: period between dispatching call and patient’s hospital arrival (includes the on-site rescue time);turn-around time: interval between the dispatching call and the BLS team’s return back to its subgroup. S.D.: standard deviation.
system simulation model is shown in Figs. 2 and 3. The simulated results and the empirical data are presented in Table 3 and Student’s t-test was performed with 0.05 ␣-level. There was no sig-nificant difference for ALS team event-site arrival time (5.98 ± 0.58;5.35 ± 0.06 min), patient hos-pital arrival time (20.19 ± 1.27;19.95 ± 0.27 min) and BLS team turn-around time (37.72 ± 0.59; 37.75 ± 0.24 min) between the two data sets (P < 0.05).
3.2. Simulated data
3.2.1. Alternatives 1 and 2
We simulated Alternative 1 (one fixed network hospital responsible as each EMS’ cooperative part-ner in a two-tier pattern) and took the current two-tier dispatch rate of 2% as simulation
parame-hPRT object: preparation time of the cooperative/assigned network hospitals. RT object: response time—
interval between the time the ambulance rescue team responds and the time it arrives at the scene. hRT object: response time of the cooperative/assigned network hospitals. PCT1, PCT object: processing time— interval between the time the ambulance rescue team arrives at the scene and treats the patient and the time it leaves the scene. hPCT1, hPCT object: processing time of the cooperative/assigned network hos-pitals. TT object: transport time—interval between the time the ambulance rescue team leaves the scene and arrives at hospital. hTT object: transport time of the cooperative/assigned network hospitals. CT ob-ject: caring time-interval between the time the ambulance rescue team arrives at the hospital and the time it leaves the hospital. DT object: departure time—interval between the time the ambulance rescue team leaves the hospital and the time it is back in service for the next rescue call. IE object: idle errand time—interval between the time the ambulance departs from the subgroup and returns to the subgroup without fulfilling a rescue. hIE object: idle errand time of the cooperative/correspondent responsible hos-pitals. Idle errands may result from false alarms;fraudulent or prank calls;vague, insufficient descriptions given to the dispatcher preventing success in reaching the patient;too long a response time for patients to wait for the ambulance to arrive, and the possibility of having no ambulance available for rescue (which did not happen in empirical nor simulated data).
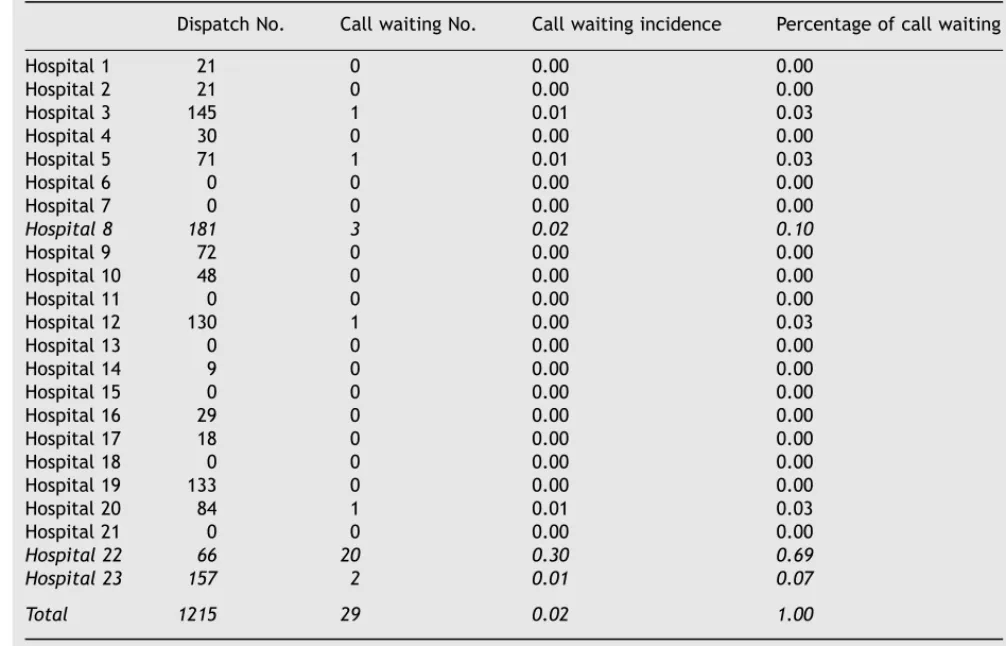
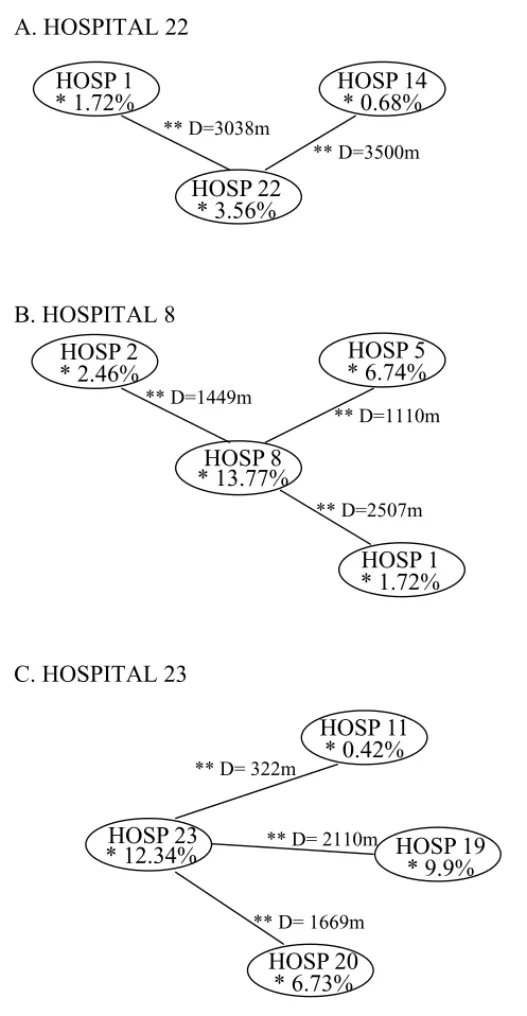
ter (Table 4). Next, for Alternative 2, we identified the hospitals most likely to keep patients waiting (i.e., hospitals that get a dispatch order with no ambulance team available to go to the rescue) and labeled them as 22, 23, and 8 (Table 5). Among them, Hospital 22 was in a different location. In the hospital’s 8 min driving distance, there was no other network hospital that could supplement the rescue task (Fig. 4). Therefore, for this specific hospital—in order to lessen waiting probability—we suggested two teams instead of one for its two-tier rescue. For Hospitals 23 and 8, there were other network hospitals located in the same proximity to provide two-tier advanced life support services (Fig. 4). Thus, we did not recommend an elevation of resources for Hospitals 23 and 8. After increasing Hospital 22’s resources to two teams and simu-lating accordingly, the probability of calls waiting
66 S. Su, C.-L. Shih
Table 4 ALS dispatch rate, probability of calls waiting, and various time performances across alternative rescue patterns for 36 subgroups associated with 23 hospitals
Empirical data and simulated data with various rescue patterns
ALS dispatch rate (%) Probability of calls waiting (%) Mean call waiting time (min) Mean ALS event-site arrival time (min) Mean Patient hospital arrival time (min) Empirical data (for 2-tier
rescue only) 2 —
a — 5.35 19.95
Simulated data
One-tier rescue 21.26
Two-tier rescue With one fixed,
responsible network hospital per subgroup
2 2.4 0.54 5.98 20.19
10 4.4 0.80 6.09 20.20
20 6.9 1.52 6.49 20.87
As above, but with elevated resource level for Hospital 22b
2 1.1 0.36 5.70 21.47
10 2.5 0.63 6.06 20.59
20 4.9 1.06 6.48 21.26
Note: In the simulation, the ALS dispatch rate was manipulated as 2, 10, and 20%. ALS: advanced life support. Call waiting: time interval between patient’s emergency call, the dispatcher assigning a specific EMS subgroup (with corresponding network hospital) to the rescue, plus any potential waiting time if the ambulance rescue team is currently occupied with another job (only simulated call waiting data are available for BLS and ALS). Event-site arrival time: interval between the dispatching call and the BLS/ALS team’s arrival on-site;hospital arrival time: period between dispatching call and the patient’s hospital arrival (includes the on-site rescue time).
aData not available.
bFor Hospital 22, the number of ALS rescue teams was increased from one to two teams.
Table 5 Incidence of call waiting for ALS rescue pattern with one fixed response network hospital among 23 hospitals
Dispatch No. Call waiting No. Call waiting incidence Percentage of call waiting
Hospital 1 21 0 0.00 0.00 Hospital 2 21 0 0.00 0.00 Hospital 3 145 1 0.01 0.03 Hospital 4 30 0 0.00 0.00 Hospital 5 71 1 0.01 0.03 Hospital 6 0 0 0.00 0.00 Hospital 7 0 0 0.00 0.00 Hospital 8 181 3 0.02 0.10 Hospital 9 72 0 0.00 0.00 Hospital 10 48 0 0.00 0.00 Hospital 11 0 0 0.00 0.00 Hospital 12 130 1 0.00 0.03 Hospital 13 0 0 0.00 0.00 Hospital 14 9 0 0.00 0.00 Hospital 15 0 0 0.00 0.00 Hospital 16 29 0 0.00 0.00 Hospital 17 18 0 0.00 0.00 Hospital 18 0 0 0.00 0.00 Hospital 19 133 0 0.00 0.00 Hospital 20 84 1 0.01 0.03 Hospital 21 0 0 0.00 0.00 Hospital 22 66 20 0.30 0.69 Hospital 23 157 2 0.01 0.07 Total 1215 29 0.02 1.00
A. HOSPITAL 22
** D=3500m ** D=3038mHOSP 14
* 0.68%
HOSP 22
* 3.56%
HOSP 1
* 1.72%
B. HOSPITAL 8
** D=2507m ** D=1110m ** D=1449mHOSP 5
* 6.74%
HOSP 8
* 13.77%
HOSP 2
* 2.46%
HOSP 1
* 1.72%
C. HOSPITAL 23
** D= 2110m ** D= 1669m ** D= 322mHOSP 11
* 0.42%
HOSP 23
* 12.34%
HOSP 20
* 6.73%
HOSP 19
* 9.9%
The distance between HOSPITAL 22 with its backup hospitals were 3500m and
3038m greater than that of HOSPITAL 8 with its backup hospitals (2507m, 1449m
and1110m) and greater that that of HOSPITAL 23 with its backup hospitals (2110m,
1669m and 322m)
* dispatch rate
** distance between responsible hospital and its backup hospitals
Fig. 4 Geographical map of Hospital 22, 8, 23 (the first three leading hospitals with highest waiting probability)
68
S.
Su,
C.-L.
Shih
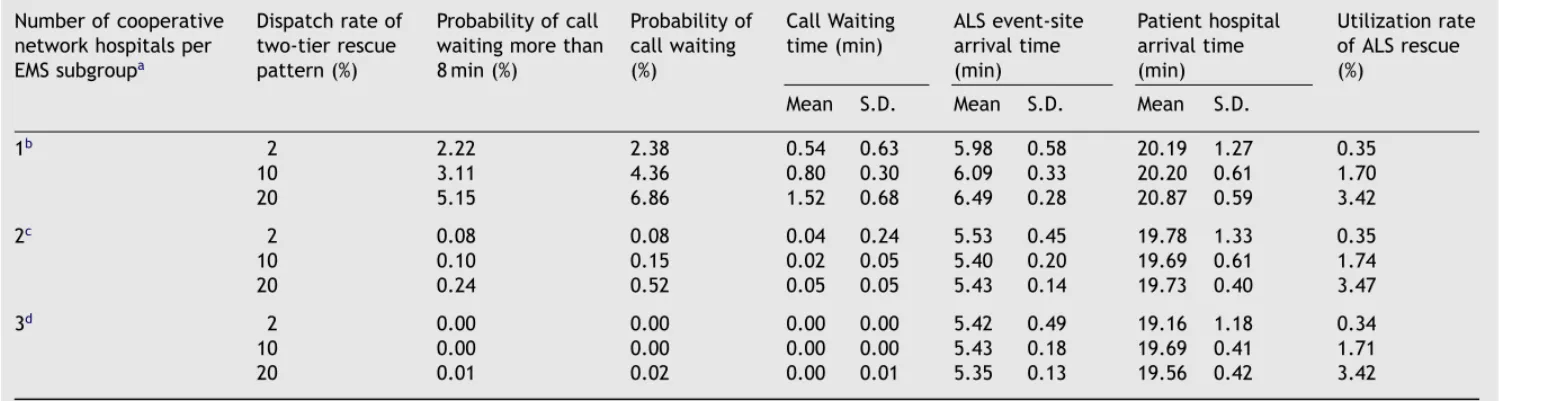
Table 6 Simulated performances for the two-tier rescue pattern across different dispatch models and dispatch rates Number of cooperative
network hospitals per EMS subgroupa
Dispatch rate of two-tier rescue pattern (%)
Probability of call waiting more than 8 min (%)
Probability of call waiting (%)
Call Waiting
time (min) ALS event-sitearrival time (min) Patient hospital arrival time (min) Utilization rate of ALS rescue (%)
Mean S.D. Mean S.D. Mean S.D.
1b 2 2.22 2.38 0.54 0.63 5.98 0.58 20.19 1.27 0.35 10 3.11 4.36 0.80 0.30 6.09 0.33 20.20 0.61 1.70 20 5.15 6.86 1.52 0.68 6.49 0.28 20.87 0.59 3.42 2c 2 0.08 0.08 0.04 0.24 5.53 0.45 19.78 1.33 0.35 10 0.10 0.15 0.02 0.05 5.40 0.20 19.69 0.61 1.74 20 0.24 0.52 0.05 0.05 5.43 0.14 19.73 0.40 3.47 3d 2 0.00 0.00 0.00 0.00 5.42 0.49 19.16 1.18 0.34 10 0.00 0.00 0.00 0.00 5.43 0.18 19.69 0.41 1.71 20 0.01 0.02 0.00 0.01 5.35 0.13 19.56 0.42 3.42
Note: S.D., standard deviation;ALS, advanced life support. Call waiting: time interval between patient’s emergency call, the dispatcher assigning a specific EMS
subgroup (with corresponding network hospital) to the rescue, plus any potential waiting time if the ambulance rescue team is currently occupied with another job (only available for simulated BLS/ALS data);event-site arrival time: interval between the dispatching call and the BLS/ALS team’s arrival on-site;hospital arrival time: period between dispatching call and the patient’s hospital arrival (includes the on-site rescue time).
aIn this simulation, the dispatch rate was manipulated to be 2, 10, and 20% for Dispatch Models 1—3. bDispatch Model 1: one fixed network hospital per subgroup.
cDispatch Model 2: two fixed hospitals per subgroup in prearranged dispatch sequence. dDispatch Model 3: three fixed hospitals per subgroup in prearranged dispatch sequence.
lessened by about 50% (i.e., from 2.4 to 1.1%) (see
Table 4). Even when the simulated dispatch rates of the two-tier rescue were increased to 10 and 20%, the probabilities of calls waiting were 2.5 and 4.9%, respectively. The event-site arrival times, on-site treatment times, and hospital arrival times remained the same (seeTable 4).
3.2.2. Alternatives 3 and 4
The operating rule of Dispatch Model 2 is that when an EMS gets a rescue call—and a two-tier model is assessed as necessary—the ALS team of the responsible hospital of the first sequence is dispatched for the job;if it is already on duty, then the responsible hospital of the second sequence is dispatched. If that is also still on a job, patients have to wait. Alternatively, Dispatch Model 3
in-Table 7 Intervention time performances of various life support techniques across different rescue patterns BLS intervention time Occurrence of specific ALS intervention times (%)
(event-site arrival times)
Model Aa Model Bb Model Cc Model Dd Model Ee
ALS intervention less than 8 min
<4 min 2.2 25.24 22.96 22.97 23.01
4—8 min 0.76 41.23 47.6 46.78 46.86
>8 min 0 17.07 14.66 16.87 17.08
Total 2.96 83.54 85.22 86.62 86.95
ALS intervention 8—16 min
<4 min 12.09 3.25 4.33 3.16 3.4
4—8 min 18.87 8.41 7.33 7.11 6.61
>8 min 2.01 2.4 2.4 2.55 2.35
Total 32.97 14.06 14.06 12.82 12.36
ALS intervention greater than 16 min
<4 min 12.6 0.48 0.24 0.21 0.27
4—8 min 34.13 1.44 0.24 0.26 0.3
>8 min 17.34 0.48 0.24 0.09 0.12
Total 64.07 2.4 0.72 0.56 0.69
Total % occurrence of all intervention
times per model 100 100 100 100 100
Note: All data include an increase in ALS resources for Hospital 22 from one rescue team to two. BLS: basic life support;ALS: advanced life support. Intervention time (event-site arrival time): interval between the dispatching call and the BLS/ALS team’s arrival on-site.
aModel A: one-tier rescue model—the hospital arrival time is taken as the ALS intervention time.
bModel B: two-tier rescue model—assumes that each emergency services subgroup (EMS) cooperates with one fixed network hospital (Dispatch Model 1) with a 2% two-tier dispatch rate.
cModel C: two-tier rescue model—assumes that each EMS cooperates with two fixed network hospitals (Dispatch Model 2) with a 2% dispatch rate.
dModel D: two-tier rescue model—assumes that each EMS cooperates with two fixed network hospitals (Dispatch Model 2) with a 10% dispatch rate.
eModel E: two-tier rescue model—assumes that each EMS cooperates with two fixed network hospitals (Dispatch Model 2) with a 20% dispatch rate.
creases the number of cooperative/responsible hospitals to three and follows the same rules as Dispatch Model 2. We simulated the latter two dis-patch models and compared the results with those derived from Dispatch Model 1 (one fixed hospi-tal). The outcomes are revealed in Table 6. They show that by changing the cooperation pattern from one fixed, responsible hospital to two coop-erative hospitals per subgroup (Dispatch Model 2), the call waiting probability can be lowered from 2.38% (at a dispatch rate of 2%) to less than 1% for any of the three simulated dispatch rates of 2, 10, and 20%. When the cooperation pattern was changed to Dispatch Model 3 (three cooperative hospitals per subgroup), the call waiting proba-bility decreased to less than 0.05%. Moreover, the response time and hospital arrival time of Dispatch
70 S. Su, C.-L. Shih Model 2 (5.53 ± 0.45;19.78 ± 1.33 min) and
Dis-patch Model 3 (5.42 ± 0.49;19.16 ± 1.18 min) were less than that of Dispatch Model 1 (5.98 ± 0.58; 20.19 ± 1.27 min). The outcomes remained the same when the two-tier dispatch rates were changed to 10 and 20% (Table 6).
Based on the literature [20], if patients with cardiac arrest receive BLS treatment within 4 min and initiate ALS treatment (CPR) within 8 min, they have a higher successive resuscitation rate. Thus, we set a 4 min arrival time as the crite-rion for the one-tier rescue pattern, and 8 min as the criterion for the two-tier rescue pattern. We staffed Hospital 22 with two rescue teams instead of one. We then compared the achievement rate of the different rescue patterns. The results are shown in Table 7. For the two-tier system, the achievement rate was 25% for Model B (Dispatch Model 1—one fixed hospital per subgroup—with a 2% dispatch rate. When we took Model C (Dispatch Model 2—two fixed hospitals per subgroup—with a 2% dispatch rate), the achievement rate was 23%. If the dispatch rate of Dispatch Model 2 increased to 10% and 20% (Models D and E), the achievement rate still remained around 23%. Therefore, we sug-gested to increase Hospital 22’s staffing level and to use the Dispatch Model 2 cooperation model (two fixed hospitals per subgroup) as the most cost-effective alternative to perform the two-tier rescue policy.
3.3. Summary
If one put the two-tier rescue model aside and only considered the one-tier rescue model (Model A), the 4 min BLS site arrival/8 min ALS site arrival probability was about 2.2%. However, the optimum solution was obtained if the subject system per-formed a two-tier rescue pattern using Dispatch Model 2 (two fixed, responsible hospitals per sub-group), took proximity into account in selecting specific hospitals for the subgroups, and enhanced the resource level (personnel teams and ambu-lance) of Hospital 22 from one to two. This resulted in a less than 1% calls waiting probability, no de-lays in patients’ hospital arrival, an achievement rate of 23% for the 4 min BLS site arrival/8 min ALS site arrival probability, and the lowest resource commitment situation.
This research also found a low utilization rate of the two-tier rescue. Therefore, it was recom-mended that dispatchers receive more training to increase utilization. The current staffing level can still afford the elevated dispatch rate of a two-tier rescue system without interfering with its service quality.
4. Discussion
4.1. Simulation models: definition and use
Simulation tool is used to describe and analyze the behavior of a system, ask what-if questions about the real system, and aid in the design of a real system [21]. The simulation practice often ‘‘uti-lize(s) symbols to represent different parts of the system, enhance the mutual understanding of the interaction and relationship, simultaneously those symbols can be integrated to set up a model to mimic the real system, and hence predict the sys-tem behavior [22].’’ Among different models, the mimic model is considered to be a performance evaluation tool. It generally uses a computer to simulate system behavior, to reveal a causal rela-tionship existing in the real world, and to evaluate performance, such as the resource utilization rate, turn-around time, waiting time, etc. It also can be used to predict the outcome after changing some parameters and to provide a reference for decision making. To construct a simulation model is more difficult. Hopefully, various recently developed simulation software packages will make simula-tion model construcsimula-tion easier than before. With a strong operating capacity, the simulation can proximate the real world. So far, many areas have used simulation methodology to solve complicated problems, such as military simulation for fighting strategies, arms distribution simulation, logistics, transportation and communication simulation, ser-vices system simulation for process reengineer-ing, on-line simulation, and resource management simulation. Distribution system simulation covers the range of manufacturing process simulation, performance evaluation, circle time simulation, among others. It was not until the mid-1990s, that the health care system simulation gained impor-tant attention for using simulation methodology to execute total quality management or continu-ous quality improvement, resource management, etc. [23—27]. Other fields, such as transportation systems and production systems, have also used simulation successfully. Development of this infor-mation technology made on-line simulation possi-ble. In combination with other interfaces, it makes real-world simulation more effective.
4.2. Implications and applications of the
developed simulation model
Prehospital care is one of the main responsibilities of the emergency services system. Especially for prehospital cardiac arrest patients with ventricular
fibrillation and ventricular tachycardia, appropri-ate and speedy rescue greatly affects patients’ prognosis. If automatic external defibrillation can be performed earlier, the survival rate is increased
[6,7,28]. As to which kind of rescue pattern can attain the best prognosis, much research has found time to be the most important factor affecting the prognosis of out-of-hospital cardiac arrest patients. Therefore, earlier intervention of basic life sup-port and defibrillation are two significant factors
[13].
For this subject system, simulated data showed the following: for the one-tier rescue model, the average arrival time at the scene (i.e., the starting time of basic life support) was about 6 min (5 min empirical). Hospital arrival time (period between the dispatching call and patient’s arrival at the hospital) was simulated as 21 min (19 min in em-pirical) (seeTable 3). That means, if the advanced life support technique can be executed only after patients arrived at the hospital, those prehos-pital cardiac arrest patients have to wait about 21 min to receive ALS care and thus lose the best timing for treatment. The two-tier rescue pat-tern for the subject system is aimed at providing hospital-based, in-time, advanced life support ser-vices (i.e., administered within the most critical first 8 min). Since the ALS event-site arrival time for the two-tier rescue pattern averages close to 6 min, this means that ALS can intervene about 15 min earlier than the one-tier rescue pattern to improve the prognosis of prehospital cardiac ar-rest patients. These systems require more research to fully understand their exact impacts. The sub-ject system took hospitals’ medical care personnel as the two-tier rescuers. Undoubtedly, the cost of this system is quite high. Therefore, the main concern of policy makers is how to perform the two-tier rescue pattern at the lowest possible cost with a brief, simple dispatching pattern while still achieving maximum services and minimal waiting time.
4.3. Conclusions, limitations, and
summary
This research applied the simulation method and tested several potential operating models. It took the current 23 network hospitals and 36 EMS sub-groups as its sample. The simulation model es-tablished the following as optimum: (1) although the differences were not great, Dispatch Model 2 (two hospitals per subgroup) of the two-tier res-cue model is recommended. It can decrease the waiting probability and waiting time as well as en-hance proper medical treatment. In addition, it
streamlines the dispatching process and decreases randomity. Each EMS should cooperative with two selected network hospitals in a prearranged dis-patch sequence (Disdis-patch Model 2) to simplify the dispatcher’s decision procedures while facing the situation that the two-tier rescue pattern requires. (2) Hospital 22’s resource level should be increased from one rescue team to two. The model suggested this special treatment for Hospital 22 because simulation outcomes showed that it was uniquely located. If another hospital were assigned as its backup, a deferred response could occur. With the new, suggested operational pattern, the probabil-ity of waiting was the lowest. The two-tier rescue team could reach the event-site in 6 min to provide treatment. On the other hand, the utilization rate of the two-tier rescue pattern was still low (about 2%) with simulation forecasting. If the two-tier rescue utilization rates were 10 or 20%, based on the above-recommended operational pattern, the service performance could still be maintained.
In accordance with the criteria (that basic life support intervene within 4 min, and advanced life support be executed in 8 min), no matter which pattern of two-tier rescue was used, the achieve-ment rate of two-tier rescue pattern was 10 times the one-tier rescue model (Table 7). If costs were not the subject, the two-tier rescue pattern would obviously surpass the one-tier rescue pattern. How-ever, if we explore more deeply the content of the two-tier rescue pattern and try to understand how intervention with two-tier rescue actually af-fects the prognosis elevation for the casualties, we may also consider whether any operation pattern could achieve a similar, positive effect. An exam-ple would be automatic external defibrillation for ventricular fibrillation or ventricular tachycardia patients. Another factor to improve the prognosis of patients might be to increase the utilization rate of the two-tier rescue pattern.
The limitation of the current study is its restricted database. Therefore, no seasonal variation could be included. This can be remedied in future, expanded studies.
In summary, the simulation method applied in this research showed its merits of being low cost, low risk, and it is easily manipulable and useful for other emergency services systems in rescue model devel-oping.
Acknowledgements
The authors received financial support from the National Science Council (NSC 89-2314-B-002-383), Taiwan.
72 S. Su, C.-L. Shih
References
[1] N. Urban, L. Bergner, M.S. Eisenberg, The costs of a subur-ban paramedic program in reducing deaths due to cardiac arrest, Med. Care 4 (1981) 379—392.
[2] T.D. Valenzuela, E.A. Criss, D. Spaite, et al., Cost-effectiveness analysis of paramedic emergency medical services in the treatment of prehospital cardiopulmonary arrest, Ann. Emerg. Med. 19 (1990) 1407—1411.
[3] G. Riediger, T.F. Sperber, Efficiency and cost-effectiveness of advanced EMS in West Germany, Am. J. Emerg. Med. 8 (1990) 76—80.
[4] A. Hallstrom, M.S. Eisenberg, L. Bergner, Modeling the ef-fectiveness and cost-efef-fectiveness of an emergency service system, Soc. Sci. Med. 15C (1981) 13—17.
[5] G. Nichol, A.S. Detsky, I.G. Stiell, K. O’Rourke, G. Wells, A. Laupacis, Effectiveness of emergency medical services for victims of out-of-hospital cardiac arrest: a meta analysis, Ann. Emerg. Med. 27 (1996) 700—710.
[6] R.D. White, B.R. Asplin, T.F. Bugliosi, D.G. Hankins, High discharge survival rate after out-of-hospital ventricular fib-rillation with rapid defibfib-rillation by police and paramedics, Ann. Emerg. Med. 28 (1996) 480—485.
[7] C.S. Forrer, R.A. Swor, R.E. Jackson, R.G. Pascual, S. Comp-ton, C. McEachin, Estimated cost-effectiveness of a police automated external defibrillator program in a suburban community: 7 years experience, Resuscitation 52 (2000) 23—29.
[8] G. Nichol, A.P. Hallstrom, J.P. Ornato, B. Riegel, I.G. Stiell, T. Valenzuela, G.A. Wells, R.D. White, M.L. Weisfeldt, Po-tential cost-effectiveness of public access defibrillation in the United States, Circulation 97 (1998) 1315—1320. [9] M.S. Eisenberg, B.T. Horwood, R.O. Cummins, R.
Reynolds-Haertle, T.R. Hearne, Cardiac arrest and resuscitation: a tale of 29 cities, Ann. Emerg. Med. 19 (1990) 179—186. [10] M.P. Larsen, M.S. Eisenberg, R.O. Cummins, A.P. Hallstrom,
Predicting survival from out-of-hospital cardiac arrest: a graphic model, Ann. Emerg. Med. 22 (1993) 1652—1658. [11] T.D. Valenzuela, D.J. Roe, S. Cretin, D.W. Spaite, M.P.
Larsen, Estimating effectiveness of cardiac arrest inter-ventions: a logistic regression survival model, Circulation 96 (1997) 3308—3313.
[12] R.O. Cummins, From concept to standard-of-care? Review of clinical experience with automated external defibrilla-tors, Ann. Emerg. Med. 18 (1989) 1269—1275.
[13] R.O. Cummins, M.S. Eisenberg, A.P. Hallstrom, P.E. Litwin, Survival of out-of-hospital cardiac arrest with early initia-tion of cardiopulmonary resuscitainitia-tion, Am. J. Emerg. Med. 3 (1985) 114—119.
[14] N. Graham, A. Laupacis, I.G. Stiell, K. O’Rourke, A. Anis, H. Bolley, A.S. Detsky, Cost-effectiveness analysis of potential improvements to emergency medical services for victims of out-of-hospital cardiac arrest, Ann. Emerg. Med. 27 (1996) 711—720.
[15] L. Moore, Measuring quality and effectiveness of pre-hospital EMS, Prehosp. Emerg. Care 3 (4) (1999) 325— 331.
[16] Guidelines 2000 for cardiopulmonary resuscitation and emergency cardiovascular care. An international consen-sus on science, Suppl. Circ. 102 (2000) 1—363.
[17] eM-Plant Software, Version 4.6.4, Tecnomatix Technolo-gies, Ltd., Neu-Isenburg, Germany.
[18] D. Spaite, R. Benoit, D. Brown, R. Cales, D. Dawson, C. Glass, C. Kaufmann, D. Pollock, S. Ryan, E.M. Yano, Uniform prehospital data elements and definitions: a re-port from the uniform prehospital emergency medical ser-vices data conference, Ann. Emerg. Med. 25 (1995) 525— 534.
[19] BestFit Software, Version 2.0, Palisades Corporation, New-field, NY, USA.
[20] M.S. Eisenberg, L. Bergner, A. Hallstrom, Cardiac resus-citation in the community. Importance of rapid provision and implication for program planning, JAMA 241 (1979) 1905—1907.
[21] J. Banks, Handbook of Simulation: Principles, Methodology, Advances, Applications and Practice, first ed., Wiley, New York, NY, 1998, pp. 3—30.
[22] C. Harrell, K. Tumay, Simulation Made Easy: A Manager’s Guide, fifth ed., Elle Snodgrass, Norcross, GA, 1999, pp. 26—31.
[23] N. Ohboshi, H. Masui, Y. Kambayashi, A study of medi-cal emergency workflow, Comput. Methods Prog. Biomed. 55 (3) (1998) 177—190.
[24] C.E. Saunders, P.K. Makens, L.J. Leblanc, Modeling emer-gency department operations using advanced computer simulation systems, Ann. Emerg. Med. 18 (2) (1989) 134— 140.
[25] F. McGuire, Using simulation to reduce length of stay in emergency department, JSHS 5 (3) (1997) 81—90. [26] F. Hashimoto, S. Bell, Improving outpatient clinic staffing
and scheduling with computer simulation, J. Gen. Intern. Med. 11 (1996) 182.
[27] L. Chin, G. Fleisher, Planning model of resource utiliza-tion in an academic pediatric emergency department, Ped. Emerg. Care 14 (1) (1998) 4—9.
[28] R.E. Kerber, Statement on early defibrillation from the Emergency Cardiac Care Committee, American Heart As-sociation, Circulation 83 (1991) 2233.