Evidence from Molecular Markers and Population Genetic Analyses
Suggests Recent Invasions of the Western North Pacific Region
by Biotypes B and Q of Bemisia tabaci (Gennadius)
CHIA-HUNG HSIEH, CHUNG-HSIUNG WANG,ANDCHIUN-CHENG KO1Department of Entomology, National Taiwan University, Taipei 106, Taiwan
Environ. Entomol. 36(4): 952Ð961 (2007)
ABSTRACT Invasive events by Bemisia tabaci (Gennadius) biotypes in various parts of the world are of continuing interest. The most famous is biotype B that has caused great economic losses globally. In addition, biotype Q has also recently been reported to be a new invasive pest. These two biotypes have been monitored for some time in the Western North PaciÞc region, but the invasive events and population genetic structures of these two biotypes are still not clear in this region. In this study, the mitochondrial cytochrome oxidase I (COI) gene was used to reconstruct a phylogenetic tree for identifying biotypes B and Q and to study the relationships between invasive events and ornamental plants. Population genetic analyses of mtCOI sequences were also used to study the genetic rela-tionships within and between populations. A combination of a phylogenetic tree and haplotype analysis suggested the recent invasion of biotype Q in this region is related to the international ornamental trade from the Mediterranean region. Low levels of haplotype diversity and nucleotide diversity indicate that the presence of biotypes B and Q in the Western North PaciÞc region are caused by multiple invasions. Hierarchical analysis of molecular variance supports the hypothesis of multiple invasions. In addition, high sequence identities and low genetic distances within and between populations of the two biotypes revealed that these invasive events occurred recently. The low levels of genetic differentiation revealed by pairwise FST values between populations also suggests the invasions were recent. Therefore, results of this study suggested that biotypes B and Q entered this region through multiple recent invasions. A quarantine of agricultural crops may be necessary to prevent further invasions.
KEY WORDS whiteßy, molecular marker, phylogeny, population genetics, pest
The whiteßy, Bemisia tabaci (Hemiptera: Aleyrodi-dae), was originally described as Aleyrodes tabaci by Gennadius in 1889 on tobacco in Greece (Perring 2001). This species is an important agricultural pest and causes great economic losses (Brown et al. 1995, De Barro 1995, Perring 2001). B. tabaci is widely dis-tributed throughout tropical and subtropical areas of the world (Brown et al. 1995). The concept of biotypes of B. tabaci, proposed in the 1950s, indicates that mor-phologically indistinguishable populations exhibit dif-ferent biological traits (Brown et al. 1995). Variations in biotypes exist in terms of host range, dispersal be-havior, fecundity, insecticide resistance, and transmis-sion competency for begomoviruses (Berry et al. 2004).
More than 24 biotypes of B. tabaci have been iden-tiÞed by multiple techniques (Perring 2001), the most well-known being the biotype B superbug. It is polyphagous with a broad host range and causes dam-age through feeding, excretion of honeydew, and virus transmission (De Barro 1995). Biotype B was
de-scribed previously as B. argentifolii Bellows and Per-ring, with the proposed common name of silverleaf whiteßy (Perring 2001). Biotype Q was originally though to be restricted to the Iberian Peninsula but recently has been widely reported in the Mediterra-nean Basin (Horowitz et al. 2005, De la Ru´ a et al. 2006). Horowitz et al. (2005) indicated that biotype Q has a high level of resistance to insecticides and also causes economic damage. Furthermore, biotypes B and Q of B. tabaci have different inherent levels of resistance to insecticides, and insecticide applications affect the proportion of both biotypes (Horowitz et al. 2005). Molecular markers have been developed to identify biotypes B and Q and to study their popula-tion dynamics (Khasdan et al. 2005).
Molecular markers are useful tools for distinguish-ing biotypes and include esterase, random ampliÞed polymorphic DNA polymerase chain reaction (RAPD-PCR), ampliÞed fragment length polymorphism (AFLP), and mitochondrial, ribosomal, and microsat-ellite DNA markers (De Barro and Driver 1997, Frohlich et al. 1999, De Barro et al. 2000, De Barro 2005, Zhang et al. 2005). Based on the genetic diversity
1Corresponding author, e-mail: kocc2501@ntu.edu.tw.
revealed by RAPD-PCR analysis, biotype B is likely an invader, and biotype Q may be endemic to the Iberian Peninsula (Moya et al. 2001). In addition, many re-ports have used mitochondrial and ribosomal markers to reconstruct phylogenetic trees and distinguish bio-types based on tree topology (Frohlich et al. 1999, De Barro et al. 2000, Abdullahi et al. 2003, De la Ru´ a et al. 2006, Hsieh et al. 2006, Ueda and Brown 2006). Ac-cordingly, biotype B presumably originated in the Middle East, and evidence supports its having spread worldwide because of human trade activities (Frohlich et al. 1999, De Barro et al. 2000).
The phylogenetic tree of the mitochondrial cyto-chrome oxidase I (mtCOI) gene indicated four bio-types of B. tabaci in East Asia: B, Q, Nauru, and An (Hsieh et al. 2006). The Nauru and An biotypes are indigenous to East Asia (Hsieh et al. 2006). Biotype B as an invader is the most widely distributed biotype in the Western North PaciÞc region, and it has already caused huge economic losses in the region (Zhang et al. 2005, Hsieh et al. 2006, Ueda and Brown 2006). Biotype Q was previously found only in China, but now has also been reported from Japan (Zhang et al. 2005, Ueda and Brown 2006). Otherwise, biotype Q has been reported only in a local region of China and Japan (Zhang et al. 2005, Ueda and Brown 2006). Some reports have hypothesized that ornamental plants such as the poinsettia may have been a possible vector of entry for biotypes B and Q into China and Japan (Zhang et al. 2005, Ueda and Brown 2006). However, the relationships between invasive events and orna-mental plants are indeÞnite, and genetic relationships within and between populations also are not clear in the Western North PaciÞc region.
Mitochondrial DNA is haploid and particularly use-ful for population studies because it undergoes no recombination, is maternally inherited, and has a sim-ple sequence organization (Harrison 1989). In addi-tion, the mtCOI gene has been a popular marker for studying relationships among B. tabaci biotypes (Frohlich et al. 1999, De la Ru´ a et al. 2006, Hsieh et al. 2006, Ueda and Brown 2006). In this study, we applied the mtCOI gene to reconstruct a phylogenetic tree for identifying biotypes B and Q in the Western North PaciÞc region, and we discuss the relationships between invasive events and ornamental plants. Fur-thermore, we used genetic analyses of the mtCOI gene to determine the population genetic structure of bio-types B and Q in this region. We attempted to study the genetic diversity within and between populations and determine whether or not biotypes B and Q are in-vasive agents in this region. We also tried to determine the genetic relationships within and between popu-lations separated by natural barriers. This study pro-vides information for understanding genetic variation of the invasive biotypes of B. tabaci in the Western North PaciÞc region.
Materials and Methods
Whitefly Samples. Whiteßy samples of B. tabaci of the Western North PaciÞc region were from China,
Japan, Korea, and Taiwan (Table 1; Fig. 1). Specimens of B. tabaci were collected from weeds, vegetables, and ornamental plants (from the wild, farms, and greenhouses, respectively). We selected fourth instars and used classical taxonomic criteria to identify the whiteßy species. Adult whiteßies were preserved in 95% ethanol and stored at ⫺20⬚C. Samples from Cyprus, Israel, the Netherlands, and Spain of the Med-iterranean Basin also were analyzed.
COI Gene Sequencing. Genomic DNA was ex-tracted from individual adult whiteßies according to the method suggested by De Barro and Driver (1997). The mitochondrial partial COI gene se-quence (816 bp) was ampliÞed by PCR with the primers C1-J-2195 (5⬘-TTGATTTTTTGGTCATC CAGAAGT-3⬘) and L2-N-3014 (5⬘-TCCAATGCAC TAATCTGCCATATTA-3⬘) (Frohlich et al. 1999). The PCR reaction program was initialized at 94⬚C for 2 min, followed by 35 cycles of 94⬚C for 1 min, 52⬚C for 1 min, and 72⬚C for 1 min, with a Þnal extension of 5 min at 72⬚C. The PCR products were subsequently gel-puriÞed using the Micro-Elute DNA Clean/Extraction Kit (GeneMark, Taipei, Tai-wan) and sequenced in one direction on an ABI 3730 DNA Analyzer (Applied Biosystems, Foster, CA) using an ABI PRISM BigDye Terminator Cycle Sequencing Ready Reaction Kit, V3.1 (Applied Bio-systems). Sequences obtained in this study were submitted to GenBank, and some samples from the Western North PaciÞc region in GenBank also were analyzed (Table 1).
Phylogenetic Analysis. Phylogenetic analysis in-cluded the B, Q, and other biotypes of B. tabaci (Ta-bles 1 and 2), with Lipaleyrodes emiliae Chen and Ko (DQ989555) as an outgroup. All sequences were aligned using the Clustal⫻ 1.18 program (Thompson et al. 1997). The resulting alignment was manually edited using the GeneDoc program (Nicholas et al. 1997), and the phylogenetic analysis was performed using Bayesian inference (Yang and Rannala 1997). The best-Þtting model of DNA substitution was se-lected by the Akaike information criterion (AIC) us-ing MrMODELTEST version 2.2 (Nylander 2004). The phylogenetic tree was constructed by using the GTR⫹ G model. The Bayesian analysis was performed using MrBayes version 3.1.2 (Huelsenbeck and Ron-quist 2001). Metropolis-coupled Markov chain Monte Carlo analyses were run with four chains (one cold chain and three heated chains). Analyses were initi-ated with random starting trees and run for 1⫻ 106
generations and were sampled every 100 generations. For the burn-in period, we discarded 100,000 gener-ations. Posterior clade probabilities were used to as-sess the levels of nodal support. Branch lengths were saved and are presented on the 50% majority-rule consensus trees.
Analysis of Genetic Variations and Population Ge-netics. After our test, we found that samples from the same site revealed the same mtCOI sequences. There-fore, we only selected one individual to represent all specimens from the same site (Table 1; Fig. 1). The mtCOI sequence identities within and among
popu-lations were estimated using GeneDoc (Nicholas et al. 1997). In addition, the genetic distances within and among populations were estimated using KimuraÕs two-parameter model in MEGA version 3.1 (Kumar et al. 2004). Values of haplotype diversity (h) and nu-cleotide diversity () were evaluated with DnaSP
version 4.10.8 (Rozas et al. 2003). Analysis of molec-ular variance (AMOVA) was used to characterize pat-terns of genetic variation and estimate variance com-ponents at different hierarchical levels (among biotypes [Va], among populations within biotypes [Vb], and within populations [Vc]) using Arlequin
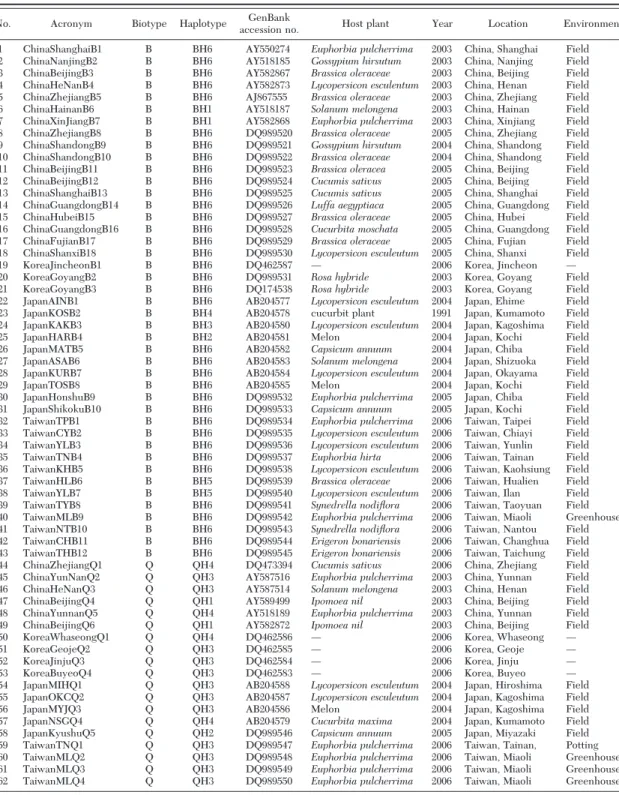
Table 1. Samples of biotypes B and Q of B. tabaci from the Western North Pacific region
No. Acronym Biotype Haplotype GenBank
accession no. Host plant Year Location Environment 1 ChinaShanghaiB1 B BH6 AY550274 Euphorbia pulcherrima 2003 China, Shanghai Field 2 ChinaNanjingB2 B BH6 AY518185 Gossypium hirsutum 2003 China, Nanjing Field 3 ChinaBeijingB3 B BH6 AY582867 Brassica oleraceae 2003 China, Beijing Field 4 ChinaHeNanB4 B BH6 AY582873 Lycopersicon esculentum 2003 China, Henan Field 5 ChinaZhejiangB5 B BH6 AJ867555 Brassica oleraceae 2003 China, Zhejiang Field 6 ChinaHainanB6 B BH1 AY518187 Solanum melongena 2003 China, Hainan Field 7 ChinaXinJiangB7 B BH1 AY582868 Euphorbia pulcherrima 2003 China, Xinjiang Field 8 ChinaZhejiangB8 B BH6 DQ989520 Brassica oleraceae 2005 China, Zhejiang Field 9 ChinaShandongB9 B BH6 DQ989521 Gossypium hirsutum 2004 China, Shandong Field 10 ChinaShandongB10 B BH6 DQ989522 Brassica oleraceae 2004 China, Shandong Field 11 ChinaBeijingB11 B BH6 DQ989523 Brassica oleracea 2005 China, Beijing Field 12 ChinaBeijingB12 B BH6 DQ989524 Cucumis sativus 2005 China, Beijing Field 13 ChinaShanghaiB13 B BH6 DQ989525 Cucumis sativus 2005 China, Shanghai Field 14 ChinaGuangdongB14 B BH6 DQ989526 Luffa aegyptiaca 2005 China, Guangdong Field 15 ChinaHubeiB15 B BH6 DQ989527 Brassica oleraceae 2005 China, Hubei Field 16 ChinaGuangdongB16 B BH6 DQ989528 Cucurbita moschata 2005 China, Guangdong Field 17 ChinaFujianB17 B BH6 DQ989529 Brassica oleraceae 2005 China, Fujian Field 18 ChinaShanxiB18 B BH6 DQ989530 Lycopersicon esculeutum 2005 China, Shanxi Field 19 KoreaJincheonB1 B BH6 DQ462587 Ñ 2006 Korea, Jincheon Ñ 20 KoreaGoyangB2 B BH6 DQ989531 Rosa hybride 2003 Korea, Goyang Field 21 KoreaGoyangB3 B BH6 DQ174538 Rosa hybride 2003 Korea, Goyang Field 22 JapanAINB1 B BH6 AB204577 Lycopersicon esculeutum 2004 Japan, Ehime Field 23 JapanKOSB2 B BH4 AB204578 cucurbit plant 1991 Japan, Kumamoto Field 24 JapanKAKB3 B BH3 AB204580 Lycopersicon esculeutum 2004 Japan, Kagoshima Field 25 JapanHARB4 B BH2 AB204581 Melon 2004 Japan, Kochi Field 26 JapanMATB5 B BH6 AB204582 Capsicum annuum 2004 Japan, Chiba Field 27 JapanASAB6 B BH6 AB204583 Solanum melongena 2004 Japan, Shizuoka Field 28 JapanKURB7 B BH6 AB204584 Lycopersicon esculeutum 2004 Japan, Okayama Field 29 JapanTOSB8 B BH6 AB204585 Melon 2004 Japan, Kochi Field 30 JapanHonshuB9 B BH6 DQ989532 Euphorbia pulcherrima 2005 Japan, Chiba Field 31 JapanShikokuB10 B BH6 DQ989533 Capsicum annuum 2005 Japan, Kochi Field 32 TaiwanTPB1 B BH6 DQ989534 Euphorbia pulcherrima 2006 Taiwan, Taipei Field 33 TaiwanCYB2 B BH6 DQ989535 Lycopersicon esculeutum 2006 Taiwan, Chiayi Field 34 TaiwanYLB3 B BH6 DQ989536 Lycopersicon esculeutum 2006 Taiwan, Yunlin Field 35 TaiwanTNB4 B BH6 DQ989537 Euphorbia hirta 2006 Taiwan, Tainan Field 36 TaiwanKHB5 B BH6 DQ989538 Lycopersicon esculeutum 2006 Taiwan, Kaohsiung Field 37 TaiwanHLB6 B BH5 DQ989539 Brassica oleraceae 2006 Taiwan, Hualien Field 38 TaiwanYLB7 B BH5 DQ989540 Lycopersicon esculeutum 2006 Taiwan, Ilan Field 39 TaiwanTYB8 B BH6 DQ989541 Synedrella nodiflora 2006 Taiwan, Taoyuan Field 40 TaiwanMLB9 B BH6 DQ989542 Euphorbia pulcherrima 2006 Taiwan, Miaoli Greenhouse 41 TaiwanNTB10 B BH6 DQ989543 Synedrella nodiflora 2006 Taiwan, Nantou Field 42 TaiwanCHB11 B BH6 DQ989544 Erigeron bonariensis 2006 Taiwan, Changhua Field 43 TaiwanTHB12 B BH6 DQ989545 Erigeron bonariensis 2006 Taiwan, Taichung Field 44 ChinaZhejiangQ1 Q QH4 DQ473394 Cucumis sativus 2006 China, Zhejiang Field 45 ChinaYunNanQ2 Q QH3 AY587516 Euphorbia pulcherrima 2003 China, Yunnan Field 46 ChinaHeNanQ3 Q QH3 AY587514 Solanum melongena 2003 China, Henan Field 47 ChinaBeijingQ4 Q QH1 AY589499 Ipomoea nil 2003 China, Beijing Field 48 ChinaYunnanQ5 Q QH4 AY518189 Euphorbia pulcherrima 2003 China, Yunnan Field 49 ChinaBeijingQ6 Q QH1 AY582872 Ipomoea nil 2003 China, Beijing Field 50 KoreaWhaseongQ1 Q QH4 DQ462586 Ñ 2006 Korea, Whaseong Ñ 51 KoreaGeojeQ2 Q QH3 DQ462585 Ñ 2006 Korea, Geoje Ñ 52 KoreaJinjuQ3 Q QH3 DQ462584 Ñ 2006 Korea, Jinju Ñ 53 KoreaBuyeoQ4 Q QH3 DQ462583 Ñ 2006 Korea, Buyeo Ñ 54 JapanMIHQ1 Q QH3 AB204588 Lycopersicon esculeutum 2004 Japan, Hiroshima Field 55 JapanOKCQ2 Q QH3 AB204587 Lycopersicon esculeutum 2004 Japan, Kagoshima Field 56 JapanMYJQ3 Q QH3 AB204586 Melon 2004 Japan, Kagoshima Field 57 JapanNSGQ4 Q QH4 AB204579 Cucurbita maxima 2004 Japan, Kumamoto Field 58 JapanKyushuQ5 Q QH2 DQ989546 Capsicum annuum 2005 Japan, Miyazaki Field 59 TaiwanTNQ1 Q QH3 DQ989547 Euphorbia pulcherrima 2006 Taiwan, Tainan, Potting 60 TaiwanMLQ2 Q QH3 DQ989548 Euphorbia pulcherrima 2006 Taiwan, Miaoli Greenhouse 61 TaiwanMLQ3 Q QH3 DQ989549 Euphorbia pulcherrima 2006 Taiwan, Miaoli Greenhouse 62 TaiwanMLQ4 Q QH3 DQ989550 Euphorbia pulcherrima 2006 Taiwan, Miaoli Greenhouse
version 3.01 (ExcofÞer et al. 2005). The Þxation index of the⌽ statistics was estimated from the pairwise genetic distances among populations (Wright 1951). These distances were also used for the hierarchical analysis of population differentiation (among biotypes [⌽CT], among populations within biotypes [⌽SC], and within populations [⌽ST]) (ExcofÞer et al. 1992). In addition, the statistical signiÞcance of the⌽ statistics at different hierarchical levels was tested by 1,000 permutations. The value of FSTwas used to estimate the degree of genetic differentiation among popula-tions (Hudson et al. 1992) using DnaSP 4.10.8.
Results
Phylogenetic Analysis of B. tabaci Biotypes. Approx-imately 816 bp of the mtCOI gene was ampliÞed from individual whiteßies using PCR. In addition, we also downloaded sequences from GenBank, and 78 sam-ples were used to reconstruct a phylogenetic tree that included an outgroup (Table 2). After alignment, 441 bp of the mtCOI sequence was used to reconstruct the phylogenetic tree. There were 256 invariable sites, 40 singleton variable sites, and 145 parsimoniously infor-mative sites. The phylogenetic tree based on the Bayesian inference divided B. tabaci into eight bio-types (Fig. 2). Biobio-types Q, B, and Ms were clustered into a monophyletic clade with high posterior prob-ability (99%) support. The results revealed that these three biotypes are sister groups and also indicated that
they could are clearly clustered by the three biotypes. Within this group, there was high posterior probability (100%) support for biotype Ms as a monophyletic group. However, biotypes B and Q clearly belong to different monophyletic subgroups with high posterior probability (99 and 83%, respectively). Therefore, bio-types B and Q are sister groups.
We compared the distributions and host-plant records of biotypes B and Q in the Western North PaciÞc region (Table 1; Fig. 1)(China, Korea, Japan, and Taiwan) relative to the phylogenetic tree (Fig. 2). Biotype Q collected from different host plants of the Western North PaciÞc region were clustered in the same clade which also included samples from the Mediterra-nean Basin. Samples of biotype B from the Western North PaciÞc region clustered in the same clade as a polytomy, along with samples from the Mediterranean Basin and around the world. The branch lengths of samples of biotype B were similar, revealing that their relationships were close. Biotype Q branch lengths also were similar, indicating close relation-ships of samples from the Western North PaciÞc region.
Genetic Variation and Population Genetics of Bio-types B and Q in the Western North Pacific Region. After sequence alignment, 473 bp of the mtCOI se-quence was used to analyze genetic variation and population genetics of biotypes B and Q in the West-ern North PaciÞc region. Comparison of 43 samples of biotype B from this region revealed 468
sequence-Fig. 1. Locations of samples of B. tabaci biotypes B and Q in the Western North PaciÞc region. Numbers refer to specimens in Table 1.
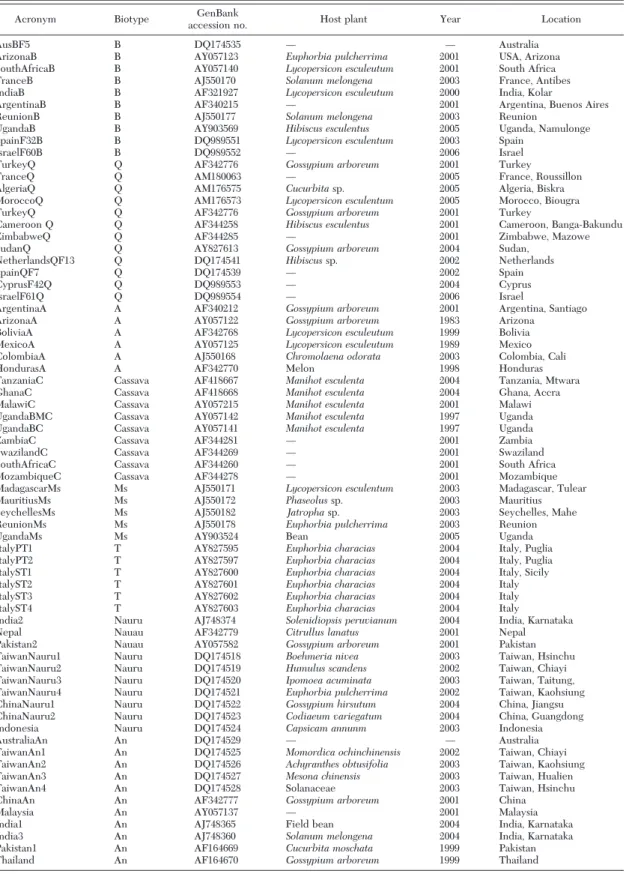
Table 2. Samples of B. tabaci whose mtCOI sequences were used to construct the phylogenetic tree in Fig. 2
Acronym Biotype GenBank
accession no. Host plant Year Location
AusBF5 B DQ174535 Ñ Ñ Australia
ArizonaB B AY057123 Euphorbia pulcherrima 2001 USA, Arizona SouthAfricaB B AY057140 Lycopersicon esculeutum 2001 South Africa FranceB B AJ550170 Solanum melongena 2003 France, Antibes IndiaB B AF321927 Lycopersicon esculeutum 2000 India, Kolar
ArgentinaB B AF340215 Ñ 2001 Argentina, Buenos Aires ReunionB B AJ550177 Solanum melongena 2003 Reunion
UgandaB B AY903569 Hibiscus esculentus 2005 Uganda, Namulonge SpainF32B B DQ989551 Lycopersicon esculentum 2003 Spain
IsraelF60B B DQ989552 Ñ 2006 Israel
TurkeyQ Q AF342776 Gossypium arboreum 2001 Turkey FranceQ Q AM180063 Ñ 2005 France, Roussillon AlgeriaQ Q AM176575 Cucurbita sp. 2005 Algeria, Biskra MoroccoQ Q AM176573 Lycopersicon esculentum 2005 Morocco, Biougra TurkeyQ Q AF342776 Gossypium arboreum 2001 Turkey
Cameroon Q Q AF344258 Hibiscus esculentus 2001 Cameroon, Banga-Bakundu ZimbabweQ Q AF344285 Ñ 2001 Zimbabwe, Mazowe SudanQ Q AY827613 Gossypium arboreum 2004 Sudan,
NetherlandsQF13 Q DQ174541 Hibiscus sp. 2002 Netherlands
SpainQF7 Q DQ174539 Ñ 2002 Spain
CyprusF42Q Q DQ989553 Ñ 2004 Cyprus
IsraelF61Q Q DQ989554 Ñ 2006 Israel
ArgentinaA A AF340212 Gossypium arboreum 2001 Argentina, Santiago ArizonaA A AY057122 Gossypium arboreum 1983 Arizona
BoliviaA A AF342768 Lycopersicon esculeutum 1999 Bolivia MexicoA A AY057125 Lycopersicon esculeutum 1989 Mexico ColombiaA A AJ550168 Chromolaena odorata 2003 Colombia, Cali HondurasA A AF342770 Melon 1998 Honduras TanzaniaC Cassava AF418667 Manihot esculenta 2004 Tanzania, Mtwara GhanaC Cassava AF418668 Manihot esculenta 2004 Ghana, Accra MalawiC Cassava AY057215 Manihot esculenta 2001 Malawi UgandaBMC Cassava AY057142 Manihot esculenta 1997 Uganda UgandaBC Cassava AY057141 Manihot esculenta 1997 Uganda ZambiaC Cassava AF344281 Ñ 2001 Zambia SwazilandC Cassava AF344269 Ñ 2001 Swaziland SouthAfricaC Cassava AF344260 Ñ 2001 South Africa MozambiqueC Cassava AF344278 Ñ 2001 Mozambique MadagascarMs Ms AJ550171 Lycopersicon esculentum 2003 Madagascar, Tulear MauritiusMs Ms AJ550172 Phaseolus sp. 2003 Mauritius SeychellesMs Ms AJ550182 Jatropha sp. 2003 Seychelles, Mahe ReunionMs Ms AJ550178 Euphorbia pulcherrima 2003 Reunion
UgandaMs Ms AY903524 Bean 2005 Uganda
ItalyPT1 T AY827595 Euphorbia characias 2004 Italy, Puglia ItalyPT2 T AY827597 Euphorbia characias 2004 Italy, Puglia ItalyST1 T AY827600 Euphorbia characias 2004 Italy, Sicily ItalyST2 T AY827601 Euphorbia characias 2004 Italy ItalyST3 T AY827602 Euphorbia characias 2004 Italy ItalyST4 T AY827603 Euphorbia characias 2004 Italy
India2 Nauru AJ748374 Solenidiopsis peruvianum 2004 India, Karnataka Nepal Nauau AF342779 Citrullus lanatus 2001 Nepal Pakistan2 Nauau AY057582 Gossypium arboreum 2001 Pakistan TaiwanNauru1 Nauru DQ174518 Boehmeria nivea 2003 Taiwan, Hsinchu TaiwanNauru2 Nauru DQ174519 Humulus scandens 2002 Taiwan, Chiayi TaiwanNauru3 Nauru DQ174520 Ipomoea acuminata 2003 Taiwan, Taitung, TaiwanNauru4 Nauru DQ174521 Euphorbia pulcherrima 2002 Taiwan, Kaohsiung ChinaNauru1 Nauru DQ174522 Gossypium hirsutum 2004 China, Jiangsu ChinaNauru2 Nauru DQ174523 Codiaeum variegatum 2004 China, Guangdong Indonesia Nauru DQ174524 Capsicam annunm 2003 Indonesia
AustraliaAn An DQ174529 Ñ Ñ Australia
TaiwanAn1 An DQ174525 Momordica ochinchinensis 2002 Taiwan, Chiayi TaiwanAn2 An DQ174526 Achyranthes obtusifolia 2003 Taiwan, Kaohsiung TaiwanAn3 An DQ174527 Mesona chinensis 2003 Taiwan, Hualien TaiwanAn4 An DQ174528 Solanaceae 2003 Taiwan, Hsinchu ChinaAn An AF342777 Gossypium arboreum 2001 China
Malaysia An AY057137 Ñ 2001 Malaysia
India1 An AJ748365 Field bean 2004 India, Karnataka India3 An AJ748360 Solanum melongena 2004 India, Karnataka Pakistan1 An AF164669 Cucurbita moschata 1999 Pakistan Thailand An AF164670 Gossypium arboreum 1999 Thailand
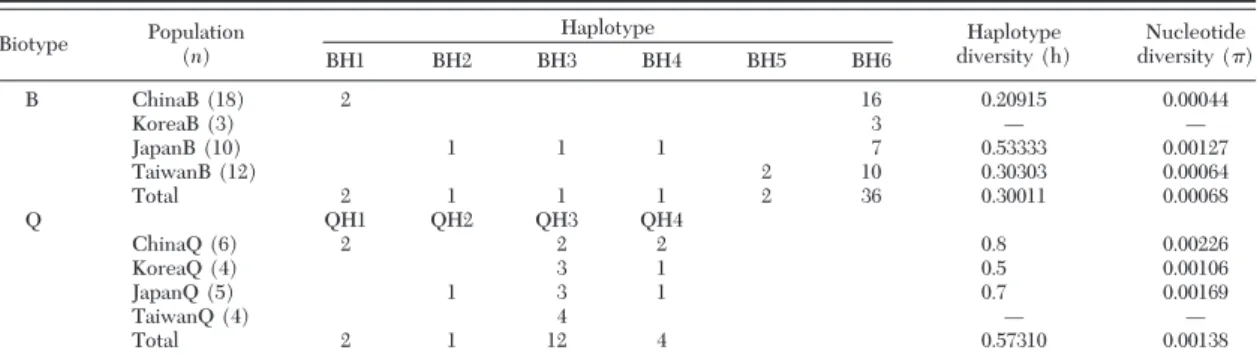
invariable sites, 3 singleton-variable sites, and 2 par-simoniously informative sites. Therefore, overall se-quences of these samples revealed six haplotypes in this region (Table 3), and BH6 was the most common
haplotype in all four populations. Furthermore, BH1 was found only in China, BH5 was found only in Taiwan, and BH2 and BH3 were found only in Japan. The highest haplotype (h⫽ 0.53333) and nucleotide
Fig. 2. Phylogenetic tree of mtCOI sequences for B. tabaci based on Bayesian inferences. Numbers at the nodes are the posterior probabilities as support values. The outgroup was L. emiliae.
diversities ( ⫽ 0.00127) were found among individ-uals of the Japanese population. In addition, the lowest haplotype (h⫽ 0.20915) and nucleotide diversities ( ⫽ 0.00044) were found among individuals of the Chinese population. Across all samples of this region, haplotype diversity (h) was 0.30011 and nucleotide diversity () was 0.00068. However, we could not calculate the haplotype or nucleotide diversity for the Korean population because there was only one hap-lotype.
A comparison of 19 samples of biotype Q from the Western North PaciÞc region revealed 470 sequence-invariable sites, 1 singleton-variable site, and 2 parsi-moniously informative sites. There were four haplo-types in this region (Table 3), with QH3 being the most common. The highest haplotype (h⫽ 0.8) and nucleotide diversities ( ⫽ 0.00226) were found among individuals of the Chinese population. The lowest haplotype (h⫽ 0.5) and nucleotide diversities ( ⫽ 0.00106) were found among individuals of the Korean population. Across all samples of this region, haplotype diversity (h) was 0.57310 and nucleotide diversity () was 0.00138. We could not calculate the haplotype or nucleotide diversity for the Taiwan-ese population because there was only one haplotype. Hierarchical analysis by AMOVA detected that the great majority of variation was among biotypes B and Q (98%; Table 4). The variation among populations within biotypes was only 0.05%. In addition, the vari-ation within populvari-ations (1.94%) was higher than that among populations within biotypes. Population dif-ferentiation of the ⌽ statistics accounted for three sources of variation (Table 4). A signiÞcant⌽STvalue was detected within populations (⌽ST⫽ 0.98056, P ⬍ 0.001). A signiÞcant⌽CTvalue was detected among
biotypes (⌽CT⫽ 0.98004, P ⬍ 0.05). The results indi-cated that genetic differences among biotypes were responsible for the differences within populations. No signiÞcant⌽SCvalue was observed among populations within biotypes (⌽SC⫽ 0.02565).
Sequence identity and genetic distance (of Kimu-raÕs two-parameter model) were used to compare pop-ulations. Sequence identities between populations of biotype B in the Western North PaciÞc region were all 99 Ð100%, and those within populations were also 99 Ð 100%. The average genetic distance between popula-tions was 0.00024 Ð 0.00099. The maximum distance was 0.00099 between the Japanese and Taiwanese populations. The minimum distance was 0.00024 be-tween the Chinese and Korean populations. The mean distance within populations was 0 Ð 0.00127. Se-quences from different individuals within the Korean population of biotype B were identical. Sequence identities among populations of biotype Q in the West-ern North PaciÞc region were 99 Ð100%, whereas those within populations were 99 Ð100%. Mean genetic dis-tances between populations were 0.00053Ð 0.00198. Average distances within populations were 0 Ð 0.00226. Sequences from different individuals within the Tai-wanese population of biotype Q were identical.
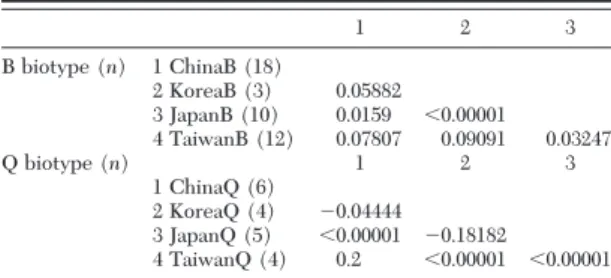
Genetic differentiation between populations was estimated by pairwise FST (Table 5). Comparisons among populations of biotype B in the Western North PaciÞc region resulted in low FSTvalues, suggesting no genetic differentiation among populations of biotype B in this region. Likewise, pairwise comparisons among populations of biotype Q in the Western North PaciÞc region also resulted in low FSTvalues, indicat-ing no genetic differentiation among populations of biotype Q in this region.
Table 3. Distribution of haplotypes, haplotype diversity (h), and nucleotide diversity () based on mtCOI sequences within populations of B. tabaci B and Q biotypes from Western North Pacific region
Biotype Population (n) Haplotype Haplotype diversity (h) Nucleotide diversity () BH1 BH2 BH3 BH4 BH5 BH6 B ChinaB (18) 2 16 0.20915 0.00044 KoreaB (3) 3 Ñ Ñ JapanB (10) 1 1 1 7 0.53333 0.00127 TaiwanB (12) 2 10 0.30303 0.00064 Total 2 1 1 1 2 36 0.30011 0.00068 Q QH1 QH2 QH3 QH4 ChinaQ (6) 2 2 2 0.8 0.00226 KoreaQ (4) 3 1 0.5 0.00106 JapanQ (5) 1 3 1 0.7 0.00169 TaiwanQ (4) 4 Ñ Ñ Total 2 1 12 4 0.57310 0.00138
Table 4. Hierarchical analysis of molecular variance and⌽ statistics of genetic differences for B. tabaci biotypes B and Q from the Western North Pacific region
Source of variation df Sum of squares Variance components Percent of variation ⌽ statistics Among biotypes 1 274.797 10.41741Va 98 ⌽CT:0.98004a
Among populations within biotypes 6 1.478 0.00544Vb 0.05 ⌽SC:0.02565
Within populations 54 11.161 0.20669Vc 1.94 ⌽ST:0.98056b
Total 61 287.435 10.62953
SigniÞcant population structure is tested among biotypes, among populations within biotypes, and within populations.
a
p⬍ 0.05;b p⬍ 0.001.
Discussion
The phylogenetic tree based on Bayesian inferences revealed that biotypes B and Q of B. tabaci are both present in China, Korea, Japan, and Taiwan of the Western North PaciÞc region. Biotype B has already been reported from these four countries, but biotype Q was known only from China until a recent report from Japan (Zhang et al. 2005, Hsieh et al. 2006, Ueda and Brown 2006). Biotype Q was detected for the Þrst time in Taiwan in this study. Biotype B is an invader worldwide and biotype Q is a recent invader of China, Japan, and the United States (Perring 2001, Zhang et al. 2005, Ueda and Brown 2006). Therefore, we hypothesize that biotype Q is a new invader of Taiwan.
Results of the phylogenetic tree provide some in-formation on the invasive events of biotypes B and Q in the Western North PaciÞc region. Biotype B of this region clustered with the worldwide samples, forming a clade that was a polytomy. This result supports pre-vious studies that found that biotype B has been spread rapidly across the globe by human trade activities (Frohlich et al. 1999, De Barro et al. 2000, Perring 2001). Therefore, biotype B in this region undoubt-edly represents an invasive event, as suggested in pre-vious reports (Zhang et al. 2005, Hsieh et al. 2006, Ueda and Brown 2006). The biotype Q clade was divided into three branches and appeared more genetically polymorphic. The tree topology revealed that biotype Q samples from this region clustered with Mediterra-nean countries. Although biotype Q was thought to be restricted originally to the Iberian Peninsula, it has recently been found in various countries around the Mediterranean basin (Brown et al. 2000, Horowitz et al. 2005). Consequently, we hypothesize that the in-vasion by biotype Q in the Western North PaciÞc region originated recently from one of several possible Mediterranean countries.
The routes of invasive biotypes of B. tabaci are believed to be related to the international trade in ornamentals (Brown et al. 1995, De Barro 1995). Im-ported poinsettias were probably the source of bio-type B, which dispersed from ornamental greenhouses into the Þeld in the United States (Brown et al. 1995). Invasions of biotype Q were hypothesized to be as-sociated with ornamental crops in China and Japan (Zhang et al. 2005, Ueda and Brown 2006). Fortu-itously, we found direct evidence to support this
hy-pothesis. There was no evidence of biotype Q in Tai-wan before 2005 (Hsieh et al. 2006); in 2006 we recorded biotype Q only in one greenhouse contain-ing poinsettias. The poinsettia plantlets had been ob-tained from Italy in 2006. Furthermore, we did not Þnd any biotype Q whiteßies outside the greenhouse or in the Þeld in Taiwan in 2006. Thus, we consider this to be powerful evidence supporting the hypothesis that routes of invasion by biotypes of B. tabaci are related to the international ornamentals trade.
Population genetic analyses were used to study ge-netic variation of invasive biotypes and to reconstruct the invasive events. According to haplotype analyses, BH6 was the only haplotype shared among countries, whereas the other Þve haplotypes were unique to a given country. In addition, haplotype and nucleotide diversities within each country were very low. Six haplotypes with low levels of genetic variability were observed, which suggests that multiple invasive events or rapid divergence have occurred. However, the mo-lecular clock hypothesis based on BrowerÕs estimates for mitochondrial DNA indicated 2.3% pairwise se-quence divergence per million years (Brower 1994). Therefore, we hypothesize that the invasive biotype B in this region exists because of multiple invasive events. However, QH3 was found to be the most com-mon haplotype within each country. Haplotype QH4 also was shared among countries besides Taiwan, while the other two haplotypes were unique to indi-vidual countries. Haplotype and nucleotide diversities also revealed low genetic variability within each coun-try. Based on our results, we hypothesize that the invasive event of biotype Q in Taiwan was a single event, because only the QH4 haplotype was found in one poinsettia greenhouse. Although the ocean pro-vides a natural barrier between China and Japan and between Korea and Japan, they all share two haplo-types. This suggests that the invasion of biotype Q in this region may have occurred through multiple in-vasive events. A recently introduced population that has expanded in size from a low number of founders is expected to have a common haplotype which is shared by a majority of individuals and many rarer haplotypes with a few independent mutations (Avise 2000). Based on the genetic variability of the population genetics analyses, we hypothesize that the invasions of biotypes B and Q in the Western North PaciÞc region occurred through multiple in-vasive events.
Hierarchical analysis with AMOVA was used to characterize patterns of genetic variations and to es-timate variance components. The results revealed that the great majority of variation was among biotypes B and Q, whereas there were also signiÞcant genetic differences among B and Q biotypes. This supports biotypes B and Q being genetically different, as pre-viously reported (Moya et al. 2001). The Þxation index of the⌽ statistics was used for the hierarchical analysis of population differentiation. We noted that there was relatively large differentiation among biotypes, which was responsible for differences within populations. The results revealed higher levels of genetic
differ-Table 5. Pairwise estimates of FSTamong populations of B.
tabaci biotypes B and Q from the Western North Pacific region
1 2 3 B biotype (n) 1 ChinaB (18) 2 KoreaB (3) 0.05882 3 JapanB (10) 0.0159 ⬍0.00001 4 TaiwanB (12) 0.07807 0.09091 0.03247 Q biotype (n) 1 2 3 1 ChinaQ (6) 2 KoreaQ (4) ⫺0.04444 3 JapanQ (5) ⬍0.00001 ⫺0.18182 4 TaiwanQ (4) 0.2 ⬍0.00001 ⬍0.00001
ences within populations than among populations as a whole, a result that is unreasonable given the ocean as a natural barrier. Thus, the combined results of AMOVA analyses supported the hypothesis of multi-ple invasive events of biotypes B and Q in the Western North PaciÞc region.
The population genetic structure was studied to determine the genetic relationships within popula-tions and between populapopula-tions of invasive biotypes of B. tabaci in this region. Similar results of low genetic distances and high sequence identities between and within populations of biotype B revealed no differ-ences between populations. Low FSTvalues between populations of biotype B also revealed low levels of genetic differentiation. These results indicate that few differences exist among populations. However, it seems impossible that no differences would exist be-tween long-resident natural populations with the ocean serving as a natural barrier. Instead, one would expect to observe isolation by distance, where genetic similarity among populations decreases as the geo-graphic distance between them increases (Jensen et al. 2005). We found that biotypes B and Q in this region do not exhibit. Consequently, the population structure analyses support hypothesis of recent mul-tiple invasions of biotypes B and Q in this region.
Actually, biotypes B and Q are known invaders of the Western North PaciÞc region. Biotype B has al-ready become an important pest and has transmitted begomoviruses that have caused economic losses in this region (Zhang et al. 2005, Hsieh et al. 2006, Ueda and Brown 2006). Therefore, biotype B has already passed through the three stages of invasionÑi.e., im-portation, introduction, and establishment (William-son and Fitter 1996)Ñto become a pest species. Fur-thermore, biotype Q in China, Korea, and Japan has also passed through the three stages to become a pest. However, we found biotype Q in Taiwan only in a poinsettia greenhouse, revealing that it is only in the importation stage, and has not yet been introduced (or released) to the environment.
Whether biotype B of B. tabaci is an invader has long been controversial. Molecular markers and viral dis-ease are used to show incursions of biotype B and have indicated that it was transported on ornamental plants (Brown et al. 1995, Frohlich et al. 1999, De Barro et al. 2000). Furthermore, this study supports the invasion of biotype Q being a recent event related to orna-mental plants, and it can be expected that it will soon spread worldwide as did biotype B through human trade activities. However, inherent levels of resistance to insecticides differ in biotypes B and Q (Khasdan et al. 2005). Insecticide applications have affected the dynamics and distribution of biotypes B and Q else-where (Khasdan et al. 2005). Therefore, ornamental crops should be quarantined to prevent the future invasion of these biotypes, and better ways to elimi-nate and control these two pests should be sought. Molecular markers will play an important role in mon-itoring and preventing their further invasion.
Acknowledgments
We thank A. R. Horowitz (Department of Entomology, Agricultural Research Organization, Gilat Research Center, Israel) for supplying the Israel samples, I. Bedford (John Innes Centre, Norwich, UK) for supplying the Spain samples, M. Jansen (Plant Protection Service, Wageningen, the Neth-erlands) for supplying the Netherlands samples, S. J. Suh (National Plant Quarantine Service, Goyang, South Korea) for supplying the Korea samples, K. I. Honda and S. Ueda (National Institute of Vegetable and Tea Science, Japan) for supplying the Japan samples, and C. Luo and X. J. Guo (Institute of Plant and Environment Protection, Beijing Academy of Agriculture and Forestry Science, China), B. L. Qiu (Entomology Department, South China Agricultural University, Guangzhou, China), and S. S. Liu (Institute of Applied Entomology, Zhejiang University, China) for sup-plying the China samples. We thank Y. C. Hung, C. H. Chen, Y. F. Chen, F. S. Wu, Y. T. Shih, and H. T. Yeh (National Taiwan University (NTU), Taipei, Taiwan) for help with sample collection, and S. K. Green (The Asian Vegetable Research and Development Center, Tainan, Taiwan) for providing samples. We thank C. F. Hsieh and S. C. Wu (Department of Life Science, NTU) for identifying host plants of B. tabaci; X. Y. Tsai (NTU), H. F. Hung (NTU), Y. H. Chen, and Y. C. Lo for assistance; and D. Chamberlin for editing the English of the draft. This paper was supported, in part, by grants from the National Science Council (NSC95-2621-B-002-0120) and Bureau of Animal and Plant Health Inspection and Quarantine (94 AS-13.3.1-BQ-B2), Taiwan.
References Cited
Abdullahi, I., S. Winter, G. I. Atiri, and G. Thottappilly. 2003. Molecular characterization of whiteßy, Bemisia
tabaci (Hemiptera: Aleyrodidae) populations infesting cassava. Bull. Entomol. Res. 93: 97Ð106.
Avise, J. C. 2000. Phylogeography: the history and formation
of species. Harvard University Press, Cambridge, MA.
Berry, S. D., V. N. Fondong, C. Rey, D. Rogan, C. M. Fauquet, and J. K. Brown. 2004. Molecular evidence for Þve
dis-tinct Bemisia tabaci (Homoptera: Aleyrodidae) geo-graphic haplotypes associated with cassava plants in sub-Saharan Africa. Ann. Entomol. Soc. Am. 97: 852Ð 859.
Brower, A.V.Z. 1994. Rapid morphological radiation and
convergence among races of the butterßy Heliconius erato inferred from patterns of mitochondrial DNA evolution. Proc. Natl. Acad. Sci. U.S.A. 91: 6491Ð 6495.
Brown, J. K., D. R. Frohlich, and R. C. Rosell. 1995. The
sweetpotato or silverleaf whiteßies: biotypes of Bemisia
tabaci or a species complex? Annu. Rev. Entomol. 40:
511Ð534.
Brown, J. K., T. M. Perring, A. D. Cooper, I. D. Bedford, and P. G. Markham. 2000. Genetic analysis of Bemisia
(Hemiptera: Aleyrodidae) populations by isoelectric fo-cusing electrophoresis. Biochem. Genet. 38: 13Ð25.
De Barro, P. J. 1995. Bemisia tabaci biotype B: a review of
its biology, distribution and control. CSIRO, Canberra, Australia.
De Barro, P. J. 2005. Genetic structure of whiteßy Bemisia tabaci in the Asia-PaciÞc region revealed using
microsat-ellite markers. Mol. Ecol. 14: 3695Ð3718.
De Barro, P. J., and F. Driver. 1997. Use of RAPD to
dis-tinguish the B biotype from other biotypes of Bemisia
tabaci (Hemiptera: Aleyrodidae). Aust. J. Entomol. 36:
149 Ð152.
De Barro, P. J., F. Driver, J.W.H. Trueman, and J. Curran. 2000. Phylogenetic relationships of world populations of
Bemisia tabaci (Gennadius) using ribosomal ITS1. Mol.
Phylogenet. Evol. 16: 29 Ð36.
De la Ru´ a, P., B. Simo´n, D. Cifuentes, C. Martinez-Mora, and J. L. Cenis. 2006. New insights into the mitochondrial
phylogeny of the whiteßy Bemisia tabaci (Hemiptera: Aleyrodidae) in the Mediterranean Basin. J. Zool. Syst. Evol. Res. 44: 25Ð33.
Excoffier, L., G. Laval, and S. Schneider. 2005. Arlequin ver.
3.0: an integrated software package for population genet-ics data analysis. Evol. Bioinform. Online 1: 47Ð50.
Excoffier, L., P. E. Smouse, and J. M. Quattro. 1992. Analysis
of molecular variance inferred from metric distances among DNA haplotypes: application to human mitochon-drial DNA restriction data. Genetics 131: 479 Ð 491.
Frohlich, D. R., I. Torres-Jerez, I. D. Bedford, P. G. Markham, and J. K. Brown. 1999. A phylogeographical
analysis of the Bemisia tabaci species complex based on mitochondrial DNA markers. Mol. Ecol. 8: 1683Ð1691.
Harrison, R. G. 1989. Animal mitochondrial DNA as a
ge-netic marker in population and evolutionary biology. Trends Ecol. Evol 4: 6 Ð11.
Horowitz, A. R., S. Kontsedalov, V. Khasdan, and I. Ishaaya. 2005. Biotypes B and Q of Bemisia tabaci and their
rel-evance to neonicotinoid and pyriproxyfen resistance. Arch. Insect Biochem. Physiol. 58: 216 Ð225.
Hsieh, C. H., C. H. Wang, and C. C. Ko. 2006. Analysis of Bemisia tabaci (Hemiptera: Aleyrodidae) species
com-plex and distribution in eastern Asia based on mitochon-drial DNA markers. Ann. Entomol. Soc. Am. 99: 768 Ð775.
Hudson, R. R., M. Slatkin, and W. P. Maddison. 1992.
Esti-mation of levels of gene ßow from DNA sequence data. Genetics 132: 583Ð589.
Huelsenbeck, J. P., and F. Ronquist. 2001. MrBayes:
Bayes-ian inference of phylogenetic trees. Bioinformatics 17: 754 Ð755.
Jensen, J. L., A. J. Bohonak, and S. T. Kelley. 2005. Isolation
by distance, web service. BMC Genet. 6: 13Ð18.
Khasdan, V., I. Levin, A. Rosner, S. Morin, S. Kontsedalov, L. Maslenin, and A. R. Horowitz. 2005. DNA markers
for identifying biotypes B and Q of Bemisia tabaci (Hemiptera: Aleyrodidae) and studying population dy-namics. Bull. Entomol. Res. 95: 605Ð 613.
Kumar, S., S. Tamura, and M. Nei. 2004. MEGA3: integrated
software for molecular evolutionary genetics analysis and sequence alignment. Brief Bioinform. 5: 150 Ð163.
Moya, A., P. Guirao, D. Cifuentes, F. Beitia, and J. L. Cenis. 2001. Genetic diversity of Iberian populations of Bemisia tabaci (Hemiptera: Aleyrodidae) based on random
am-pliÞed polymorphic DNA-polymerase chain reaction. Mol. Ecol. 10: 891Ð 897.
Nicholas, K. B., H. B. Nicholas, Jr., and D. W. Deerfield, II. 1997. GeneDoc: analysis and visualization of genetic
variation. Embnew News. 4: 14.
Nylander, J.A.A. 2004. MrModeltest v2. Program distributed
by the author. Evolution Biology Centre, Uppsala Uni-versity, Uppsala, Sweden.
Perring, T. M. 2001. The Bemisia tabaci species complex.
Crop Protect. 20: 725Ð737.
Rozas, J., J. C. Sa´nchez-DelBarrio, X. Messeguer, and R. Rozas. 2003. DnaSP, DNA polymorphism analyses by
the coalescent and other methods. Bioinformatics 19: 2496 Ð2497.
Thompson, J. D., T. J. Gibson, F. Plewniak, F. Jeanmougin, and D. G. Higgins. 1997. The ClustalX windows
inter-face: ßexible strategies for multiple sequence alignment aided by quality analysis tools. Nucleic Acids Res. 24: 4876 Ð 4882.
Ueda, S., and J. K. Brown. 2006. First report of Q biotype of Bemisia tabaci in Japan by mitochondrial cytochrome
oxidase I sequence analysis. Phytoparasitica 34: 405Ð 411.
Williamson, M. H., and A. Fitter. 1996. The characters of
successful invaders. Biol. Conserv. 78: 163Ð170.
Wright, S. 1951. The genetical structure of populations.
Ann. Eugenics 15: 323Ð354.
Yang, Z., and B. Rannala. 1997. Bayesian phylogenetic
in-ference using DNA sequences: a Markov chain Monte Carlo method. Mol. Biol. Evol. 14: 717Ð724.
Zhang, L. P., Y. J. Zhang, W. J. Zhang, Q. J. Wu, B. Y. Xu, and D. Chu. 2005. Analysis of genetic diversity among
dif-ferent geographical populations and determination of biotypes of Bemisia tabaci in China. J. Appl. Entomol. 129: 121Ð128.
Received for publication 16 November 2006; accepted 26 March 2007.