Full Terms & Conditions of access and use can be found at
http://www.tandfonline.com/action/journalInformation?journalCode=wjsa21
Download by: [Institute of Software] Date: 10 October 2017, At: 17:17
ISSN: 2168-3565 (Print) 2168-3573 (Online) Journal homepage: http://www.tandfonline.com/loi/wjsa21
The socioeconomic geography of organic
agriculture in the United States
Hui-Ju Kuo & David J PetersTo cite this article: Hui-Ju Kuo & David J Peters (2017) The socioeconomic geography of organic agriculture in the United States, Agroecology and Sustainable Food Systems, 41:9-10, 1162-1184, DOI: 10.1080/21683565.2017.1359808
To link to this article: http://dx.doi.org/10.1080/21683565.2017.1359808
Accepted author version posted online: 08 Aug 2017.
Published online: 08 Aug 2017. Submit your article to this journal
Article views: 47
View related articles
The socioeconomic geography of organic agriculture in
the United States
Hui-Ju Kuoaand David J Petersb
aInstitute of Sociology, Academia Sinica, Taipei, Taiwan;bDepartment of Sociology, Iowa State University, Ames, IA, USA
ABSTRACT
To better understand the spatial pattern of organic agriculture in the United States, this research investigates multiple measures of organic farming and examines its environmental and socioeco-nomic correlates at the meso-level between 2007 and 2012. Drawing data from the Census of Agriculture, the organic index indicates that organic farming is primarily located in New England, along the Pacific Coast, the Northern Great Lakes, and the Western Mountains. Although neighborhood effects did play an important role in organic conversion, a small number of organic intensive counties are expanding in areas that are dominated by conven-tional agriculture. The regional differences of organic agriculture are associated with ecological factors such as climate and topo-graphy. Organic intensive areas tend to have more diverse farm operations, with more women operators and direct sales to people and the community. However, the results show mixed support linking organic production with better socioeconomic settings. Generally, the agroecology approach, which views agriculture and the food systems as being embedded in landscapes and a broader socio-institutional system, helps interpret the regional variation of organic agriculture. To capture organic heterogeneity, this study suggests that more analytical attention be paid to local socioeconomic contexts and the corresponding community-embedded relations.
KEYWORDS
County; environmental and socioeconomic correlates; organic agriculture; spatial analysis; United States
Introduction
The development of organic agriculture was based on a range of ideals about farming beginning in the early 20th century. Generally, organic agriculture throughout the world had a provisional start as an alternative production system that promotes the environmentally, economically, and socially sound production of food (Heckman2006; Lotter2003; Sligh and Christman2003). In other words, advocates perceive organic farming to be a form of sustainable agriculture that reduces reliance on external inputs while increasing farm-derived renewable resources to enhance natural ecological processes, environmental protection, food quality, and economic viability (Lockie et al.2006; Rigby and Caceres2001).
CONTACTHui-Ju Kuo hjkuo@sinica.edu.tw Institute of Sociology, Academia Sinica, 128 Sec. 2 Academia Rd., Nankang, Taipei 115, Taiwan.
Color versions of one or more of the figures in the article can be found online atwww.tandfonline.com/wjsa. https://doi.org/10.1080/21683565.2017.1359808
© 2017 Taylor & Francis
From the realm of agrarian-based rural development, a body of literature has identified the growing links between the environment, on-farm sustain-ability, and social justice, which reflects an emerging systemic understanding of agriculture as an ecological and social activity (Fernandez et al. 2013; Marsden, Banks, and Bristow 2000, 2002; Padel, Lampkin, and Foster 1999; Pugliese2001; Smith and Marsden2004; Tovey1997,2002). Building on the uniqueness of place, the agroecosystem concept in particular is useful in understanding the complexity of modern agriculture, which has emerged from a broad social and cultural context (Rosset and Altieri1997). In recent decades, tendencies in the rise of alternative agrifood movements have encour-aged researchers to outline the forces that are shaping the emerging global food situation. Among them, the growth and institutionalization of organic agri-culture offers an excellent opportunity to assess how well the agroecosystems are structured and function along with this development.
The dynamics in organic agriculture appear to result from a range of ecological, social, economic, and political factors (Milestad and Darnhofer
2003; Youngberg and Demuth2013). However, few studies have investigated multiple measures of organic agriculture on the national level and examined socioeconomic settings to explain the regional diversity of organic farming across meso-scale (Lobao1996) geographies. The existing studies are limited by using smaller geographic regions that are not national in scope (Constance, Choi, and Lyke-Ho-Gland2008; Guptill2009; Guthman2004a; Sheahan et al.
2012). They are further limited by using single year measures that do not show changes in organic farming (Taus, Ogneva-Himmelberger, and Rogan 2013) and the personal characteristics of individual producers or consumers rather than an agroecosystem approach to explain organic conversion (Stofferahn
2009; Zepeda and Li2007).
To address these gaps, the current research examines the spatial distribution of organic agriculture and its environmental and socioeconomic correlates at the meso-level in the United States. Drawing data from the Census of Agriculture, we first identify the intensity of organic agriculture in terms of multiple organic measurements at the county level to specify distinct patterns of organic farming. We then investigate the environmental, demographic, and socioeconomic factors that affect organic agriculture intensity.
Understanding the spatial pattern of organic agriculture and its correlates is crucial to further our understanding of the ecology of how US farming is organized. Because the nature of organic agriculture embodies an evolving set of traditional ecological knowledge, land management practices, and an environ-mental social movement, the geographic distribution of organic farming implies the variation of orientation to human-nature relations. Therefore, this research contributes to the literature in terms of its conceptual approach, which links agricultural restructuring to the understanding of whether the mode of food production is correlated with the positive socio-economic settings in a
community. Moreover, this study is somewhat unique in terms of data in that it examines the spatial distribution of organic agriculture by using county-level data for the entire United States over time. Organic practices are often closely related to landscape heterogeneity and a range of social and cultural diversity partly due to the agroecological differences that occur from the farm-scale to the community and to the region (Vos2000). However, the previous studies have not examined how increases or decreases in organic farming on the national-scale are system-atically distributed on a meso-scale. Lastly, using multivariate analysis to identify the intensity of organic farming across counties with multiple measures will facilitate a better understanding of the latent relationship among organic measure-ments. It avoids the problem of using single criteria to identify high or low intensity organic areas by basing the thresholds on the unique distribution of the data. To summarize, the aim of the current study is to advance conceptual and methodological contributions to the existing literature amid the recent surge of more empirical data in the investigation of organic farming in the United States.
The distribution of certified organic agriculture in the United States
Although the organic sector is still less than 1% of US farmland, certified organic cropland increased from 1.22 million acres in 2000 to 3.09 million acres in 2011. For the total certified organic cropland in 2011, almost half of organic cropland is in the western United States (28% in Pacific states and 21% in Mountain states). The Corn Belt (including Indiana, Illinois, Iowa, Missouri, and Ohio), which represents 22% of all US cropland, had only 10% of certified organic cropland in 2011. In other words, the geographic distribu-tion of cropland by region is considerably different for certified organic agriculture than it is for the rest of US agriculture.
However, the differences between commodities that are grown in the organic sector and that are grown in the whole agricultural sector might facilitate an understanding of the crop diversification of organic agriculture. For example, cropland in produce (vegetable, fruit and tree nuts) accounts for 10% of organic certified acreage in 2011, but it only accounts for 7% of all US cropland. These organic fruits and vegetables are highly concentrated on farms in the Pacific region. The top producer of organic fruits and vegetables is California, followed by Washington, Florida, Arizona, and Oregon. Grains (including corn, wheat, oats, barley, sorghum, rice, millet, and rye) and soybeans account for 65% of the total US cropland but only 31% of certified organic acreage. Although organic grains and soybeans, which were produced on 543,000 acres in 2000, have increased to over 944,000 acres in 2011, they are grown mostly in the Midwest, which is the same region where conventional grains and soybeans are grown. The regional development of organic production is similar to conventional commod-ities, which suggests that the regional comparative advantages for organic crops are in effect (Klonsky and Tourte1998).
In general, the adoption of organic farming is highest for specialty crops. For example, while only one quarter of 1% of US corn and soybeans are grown organically in 2011, approximately 2.5% of the dry peas and tomato crops, and 4.5% of all of the major fruit crops are certified organic. Among vegetable crops, approximately 12% of lettuce and 14% of carrots are grown organically, and one third of the organic vegetable acreage is devoted to “mixed vegetables,” which is a mixture of numerous vegetables that are grown on a small farm. The markets for organic fruits and vegetables have been developing for decades in the United States, and these crops are grown organically in more states than any other type of commodity (Dimitri and Greene 2002).
More recently, it is widely believed that the debate over genetically mod-ified organisms (GMOs) and the recombinant bovine growth hormone (rBGH) controversy has spurred the consumer demand for organic dairy products (Buttel2000; Dupuis2000). With the growth of demand for organic dairy, organic milk production has expanded rapidly in large operations that are located in non-traditional areas of the South and West (Mcbride and Greene2009,2010). In 1997, organic dairy operations were led by New York, Wisconsin, Minnesota, Pennsylvania, California, and Maine, and followed a path similar to conventional production (Greene2000; Lotter2003; Mcbride and Greene2010). In 2005, more than 80% of organic dairies were located in the Northeast and Upper Midwest regions; however, these operations were small and less productive than those in the West, which had only 7% of organic dairy farms but contained 31% of organic milk cows (Mcbride and Greene 2009). California, Wisconsin, New York, and Texas are now the leading organic milk producing states, and they accounted for shares of 23%, 13%, 11%, and 9% of organic milk cows in 2011, respectively.
The previous research has demonstrated that the growth of organic agricul-ture has not been evenly distributed across the country instead being concen-trated in certain regions. Employing measures of spatial concentration and association based on data from the 2002 USDA Census of Agriculture, Eades and Brown (2006) found that counties with the largest location quotients for organic production were often located in the western United States, especially California, Washington, and Oregon, the Great Plains states, New England, and the Mid-Atlantic States. When these values were adjusted to represent organic agriculture’s percentage of a county’s total agriculture, central cluster counties were most likely to be found in New England. Similar results were also found in Taus, Ogneva-Himmelberger and Rogan’s (2013) study in which measures of spatial concentration that were based on data from the 2007 USDA Census of Agriculture on organic farms showed that the highest rates of conversion were clustered in the western United States, especially California, Washington, Oregon, and on the East Coast in New England. Other studies have also found statistically significant spatial autocorrelation in certified organic operations
(Marasteanu and Jaenicke 2013), certified organic processors and handlers (Jaenicke et al. 2009), and organic supply chains (Hooker and Shanahan
2012). Overall, these studies have indicated that there are some factors that make organic agriculture more apt to grow in certain regions rather than others.
Agroecology and organic agriculture
The essential ingredients in the development of organic agriculture are values that express a general criticism of mainstream agriculture, which aims to maximize agricultural production through the use of artificial inputs (Best2008; Goodman
2000; Kaltoft1999). The fact that organic agriculture challenges the ideologies of contemporary industrialized agriculture is crucial for the distinctiveness of organic farming both as a concept and as a social movement. The organic movement includes joint efforts by different social actors such as farmers, consumers, scientists, states, and ordinary citizens, with the aim of constructing a new type of interrelationship between agriculture and society. Therefore, the development of organic agriculture is strongly influenced by the development of society at large. The rise of organic agriculture may be seen as part of general social and political change, embedded in landscapes and a broader socioinstitutional complex.
To understand the diverse components of the organic production system, the agroecosystem concept, which involves the interplay between social, economic, and environmental process of the agricultural system, might help to explain the regional variations of organic production. Building on principles of ecology and uniqueness of place, agroecology is the study of ecological processes in agricul-ture, with a view towards making agriculture sustainable in ecological terms (Francis et al. 2003). Relatedly, a primary foundation of agroecology is the concept of an ecosystem, which is defined as a functional system of comple-mentary relationships between living organisms and their environment, which in space and time appear to maintain a steady yet dynamic equilibrium (Gliessman2004,2007). In an agricultural setting, an agroecosystem is created when human manipulation and alternation of ecosystems occur for the purpose of establishing agricultural production (Gliessman2007). In other words, when we consider farm systems as agroecosystems, we are looking at a set of ecologi-cal, economic, and social interactions that determine the process that sustains agricultural production.
First, in terms of the ecological factors that are associated with agricultural production, studies have shown that a farm’s geographic location, which reflects its soil quality, topography, and natural amenities, can affect the economic viability of farm activities. Empirical studies by Pietola and Lansink (2001) in Finland and Schnidtner et al. (2012) in Germany reveal that organic farms are more likely to be located in low-yield regions than in more fertile areas. Through factor analysis that describes the topography, climate, soils, farm type, and population characteristics of the spatial aggregation of organic farming in
England, Gabriel et al. (2009) also found that organic farming tends to exist in marginal areas with lower agricultural potential. In the United States, Buck, Getz, and Guthman (1997), Duram (2000), Guthman (2000), Vos (2000), and Youngberg and Demuth (2013) suggested that natural resources, landscape heterogeneity, and regional climates appear to be related to the success of alternative and organic agriculture as well as their regional cropping strategies or adoption of input practices. The current study adds to the literature by examining the environmental factors that are associated with the geography of organic farming in the United States.
Studies have also found that regional differences in organic production could result from the agricultural geography of the nation such as farm structure and land value. For example, farm size may affect the adoption of new technology and agricultural activity for various reasons (Bagi and Reeder2012). McCann et al. (1997), Saltiel, Bauder, and Palakovich (1994), and Tavernier and Tolomeo (2004) found that alternative and organic farms tend to be smaller than conventional farms. However, using data from the 2007 Agricultural Resource Management Survey, Bagi and Reeder (2012) did not find any link between farm size and farmer involvement in organic production. Through a geographically weighted regres-sion, Taus, Ogneva-Himmelberger, and Rogan (2013) suggested that there is significant variation in the relationship between average farm size and organic adoption rates, which indicates that farm size is an important conversion factor but only in some parts of the country. In addition, location affects farm access to transportation systems, cooperative extension services, and regional development strategies. Urban versus rural location can make a difference, particularly for farm activities that rely heavily on urban consumers. By analyzing the spatial concen-tration of organic production, Eades and Brown (2006) and Hooker and Shanahan (2012) indicated that market access and the locations of organic market sectors including retail outlets, processors, and handlers strongly influence the distribution of organic adopters. As the consumption of organic food is skewed geographically with the heaviest demand in urban areas, studies have found that organic agriculture is associated with urban and metropolitan areas (Klonsky
2000), while Bagi and Reeder (2012) have suggested that proximity to urban customers is only an advantage for direct marketing farms.
In addition, organic farming should be understood as a dynamic system with many interacting socioeconomic parts. Sustainable agriculture is an approach that maximizes economic benefits while maintaining environmental quality. It is argued that organic farming is human capital intensive and encourages new scientific developments (Zilberman, Khanna, and Lipper 1997). Because the organic movement is often associated with a reorientation of economic action through social embeddedness that is characterized by knowledge, innovation, and social learning (Kroma 2006; Morgan and Murdoch 2000; Padel 2001), studies tend to link organic production systems with better individual attributes that utilize the skills and abilities of local people. In the organic economy, the
main motivations for organic farming are sometimes connected with financial support and farm management. As perceived technical difficulties, the uncer-tainty of organic food markets and economic hardship are usually the primary factors that deter producers from adoption, studies have suggested that financial support through subsidized research, the supply of organic market services, and the establishment of commercial infrastructures will promote organic conver-sion (Greene and Kremen2003; Kaufmann et al.2011; Walz2004). Moreover, conversion to organic farming is expected to lead to the modification or adop-tion of new farming symbols. Because the organic movement has included a spiritual dimension of concepts that surround environmental beliefs, values, attitudes, and norms, conventional and alternative agriculture represent distinct paradigms that correspond to different worldviews (Abaidoo and Dickinson
2002). In general, local values, innovation, social learning, economic well-being, and social relations influence the development of organic farming.
Finally, the agricultural policy domain, which concerns public intervention, such as government policies, state regulations, and standard setting authorities, into the organic farming sector also explained particular patterns of organic farming. On the one hand, the development of organic standards and certification, which aims to create consumer confidence and to facilitate market access to farmers, has been an important instrument for the growth of organic agriculture (Daugbjerg 2012; Howard and Allen 2006; Klonsky 2000; Padel, Lampkin, and Foster1999). However, as the codified definition of organic farming has focused on the input-oriented instead of process-oriented management of sustainable produc-tion, a number of analysts have noted the potential industrialization of organic agriculture and the expansion of agribusiness in the domination of organic products (Buck, Getz, and Guthman 1997; Delind 2000; Goodman 2000; Guthman1998,2002,2004b). Critiques have expressed concerns about the para-dox of regulatory mechanisms of organic agriculture. This body of literature constitutes the“conventionalization thesis,” which stresses how organic agricul-ture appears to be reshaping itself in the image of capital and is therefore under-going many of the same structural changes as conventional agriculture decades earlier. While studies in different national and regional contexts have expressed concerns about the conventional tendencies, there is little consensus as to how serious these changes are to the long-term development of organic agriculture (Hall and Mogyorody2001). To capture organic heterogeneity, a general conclu-sion thus points to a need for more empirical research that compares different farm types, commodities, marketing channels, regions, and historical contexts (Bellon and Lamine2009; Best2008; Darnhofer et al.2010; Langer2002).
Data and methods
To better understand the spatial distribution of organic agriculture and its environmental and socioeconomic correlates, this analysis uses data that are
taken from the 2007 and 2012 Census of Agriculture (NASS, USDA), the 2008–2012 American Community Survey (ACS, Census Bureau), the Natural Amenities Scale (ERS, USDA), the Social Capital Index (NE-RCD, Penn State U.), and the Organic Pages (Organic Trade Association). The Census of Agriculture is recognized as the leading and official source of statistical informa-tion regarding United States agricultural producinforma-tion. In this research, organic agriculture was defined based on US Department of Agriculture criteria. The data of certified organic agriculture were taken from the 2007 and 2012 Census of Agriculture. The ACS provides county-level population and socioeconomic information. ACS data represents the average values for each year between 2008 and 2012 rather than point-in-time estimates. The Natural Amenities Scale measures the environmental characteristics of the county and includes climate, topography, and water area. The Social Capital Index measures the dimensions of social capital through various proxy indicators, including the density of associations, voter participation, census form response rates, and the density of nonprofit organizations (Rupasingha, Goetz, and Freshwater 2006). The Organic Pages provides the names and addresses of organic support enterprises in OTA-defined categories including associations, manufacturers, brokers, dis-tributors, and retailers.
The units of analysis are counties in the 48 contiguous states, with Alaska and Hawaii being excluded due to their unique economies and geographies. Broomfield County in Colorado is dropped because of the unavailability of natural amenities data. This results in N = 3,069 counties for analysis. Organic agriculture is measured using organic farms and transitioning farms as a share of total farms in each county for 2012 and change in organic farms between 2007 and 2012. We converted these individual values into their corresponding stan-dard scores to remove scale differences.
To achieve the first objective of the study, exploratory factor analysis is used to construct an index of organic agriculture through multiple organic measure-ments. Exploratory factor analysis, which is also called principal components analysis, aims to summarize observed variables in terms of a smaller number of factors that can facilitate a better understanding of the data. In this study, our purpose is to estimate a county’s factor score index through exploratory factor analysis. The organic index is calculated as the product of standardized factor coefficients that are multiplied by the standardized values of the observed variables. This approach is useful in data reduction, which enables the discovery of the correlations of many different measures by reducing them into a latent factor. Therefore, it helps to create substantive indices that are based on multiple measures to avoid the problem of using single criteria by basing the thresholds on the unique distribution of the data.
To achieve the second objective of the study, a spatial linear regression is used to predict organic intensity based on environmental and socioeconomic factors. Through a maximum likelihood method that controls for spatial dependence in
the organic index variable, this technique is appropriate for analyzing how socioeconomic predictors are related to organic farming, while accounting for the spatial heterogeneity that is present in the relationship. To correct for spatial dependence in the regression model, spatial lags are calculated using k = 4 nearest neighbor weights. Spatial lags correct the dependent variable from being affected by neighboring values, which may cause the residual to be spatially correlated. Although a number of different weights can be employed, this analysis follows the advice of Chi and Zhu (2008) who find that using k-nearest neighbor weights avoids creating too few (rural) or too many (urban) neighbors and is unaffected by geographic “islands” due to missing data. We choose the 4-nearest neighbor weights method because it provides the highest spatial autocorrelation and a high level of statistical significance. The assump-tions of the multiple regression analysis are met except for a few outlying cases that may decrease the accuracy of the estimates.
The dependent variable is the organic score index constructed from exploratory factor analysis. The natural amenity predictors include winter amenities (warmer January temperature and more January sunlight), summer amenities (cooler July temperature and lower July humidity), and landscape amenities (greater water area and greater topographic variation). The selected farm type predictors include size of farm, market value of land and buildings per acre, farms with women operators, farms that sell directly to individuals for human consumption, farms that sell to Community Supported Agriculture (CSA) organizations, and farms by legal status. The organic service enterprises include organic associations, manu-facturers, distributors, retailers, and brokers.
The sociodemographic predictors include population density per 100 people square mile, whether the county is in a metropolitan area or adjacent to one, minority population that is nonwhite or Hispanic, populations age 17 and younger and 65 and older, migration into the county from elsewhere over the past five years, high school degree non-completers, and college graduates for the population aged 25 years or more. The socioeconomic predictors include popu-lation below the poverty line, Gini coefficient of income inequality, labor force participation, and employment in various occupational groups for the popula-tion 16 years and older by place of residence. The social capital is measured by an aggregated index whose components include density of associations, voter turn-out, response rate to government survey, and density of nonprofit organizations (Rupasingha, Goetz, and Freshwater2006).
Results
The first objective seeks to measure and identify the intensity of organic agriculture across socioeconomic and geographic space. We evaluated the stan-dard scores of the percent organic farms and transitioning farms in 2012 and the percent change in organic farms between 2007 and 2012 using a factor analysis
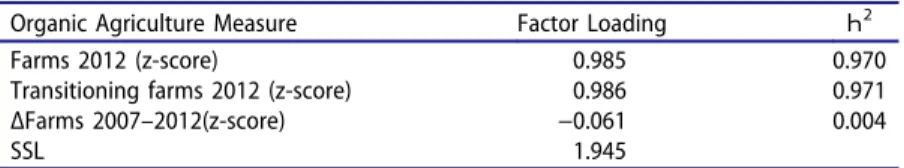
method to determine the commonality of the items and build an index. The results of the exploratory factor analysis (Table 1) show that the percent organic farms and transitioning farms in 2012 generate high loadings, and both are larger than 0.98. For each of these items, 97.22% and 97.14% of variance, respectively, were explained by the latent factor. However, the factor loading of percent change in organic farms between 2007 and 2012 is approximately −0.1, which indicates that this item is negatively associated with the latent factor. In other words, organic intensive counties tend to have fewer conversions in the period between 2007 and 2012; conversely, low intensity areas are more likely to improve the organic diffusion. Taken together, the results show that a common latent variable underlies these organic measures. However, the factor solution is not so unique because one of the communalities is low, which suggests high measurement errors.
To better examine the intensity of organic agriculture and its spatial distribu-tion,Figure 1maps the location of the organic agriculture index that is derived from the exploratory factor analysis. The total 3,069 counties are divided into four groups according to their factor scores. The High Intensity of organic farming group consists of 369 counties (12.02% of total) that are more than 0.5 standard deviations above average. The 280 counties (9.02% of total) in the Above Average group are between 0.1 and 0.5 standard deviations above average. In terms of
Figure 1.Intensity of organic agriculture for N = 3,069 counties in the United States.
Table 1.Factor loadings, communalities, and percent of variance for factor extraction on organic agriculture measurements.
Organic Agriculture Measure Factor Loading Һ2
Farms 2012 (z-score) 0.985 0.970
Transitioning farms 2012 (z-score) 0.986 0.971
ΔFarms 2007–2012(z-score) −0.061 0.004
SSL 1.945
geography, the counties that have High Intensity and Above Average organic agriculture are located primarily along both coasts of the United States. First, organic agriculture is concentrated in the major metropolitan areas of New England, and in the smaller metropolitan areas that run from Maine south to Pennsylvania. Second, organic production is also concentrated in the metropolitan areas along the Pacific Coast of California, Washington, and Oregon. Moving into the interior of the nation, organic agriculture is also found in rural areas with desirable natural amenities such as the Northern Great Lakes (Minnesota, Wisconsin, and Michigan), along the California-Nevada border, around the Rocky Mountains (Montana, Idaho, Utah, and Colorado), and in New Mexico. Notable is the relative absence of organic agriculture in the southern states.
By contrast, the majority of counties in the United States fall in the Low Intensity category, where organic agriculture is more than 0.4 standard devia-tions below average and accounts for 1209 or 39.39% of all counties. They tend to be located in rural or smaller metropolitan areas of the Midwest (Nebraska, and Kansas), the Northern Great Plains (the Dakotas), and the South (Texas, Oklahoma, Arkansas, Louisiana, Mississippi, Alabama, and Tennessee). The Average Intensity of organic agriculture consists of 1211 counties (39.46% of total), and they are widely dispersed in the South Atlantic, the Midwest, and the Mountain West. From the preceding discussion, it is clear that high organic agriculture is clustered in a small number of counties, while most of the other areas of the United States have relatively low and average rates. In addition, a Moran’s I indicates a high degree of positive spatial correlation between the organic agriculture clusters (I = 0.541), which means that high (low) organic areas tend to be located near other high (low) organic areas.
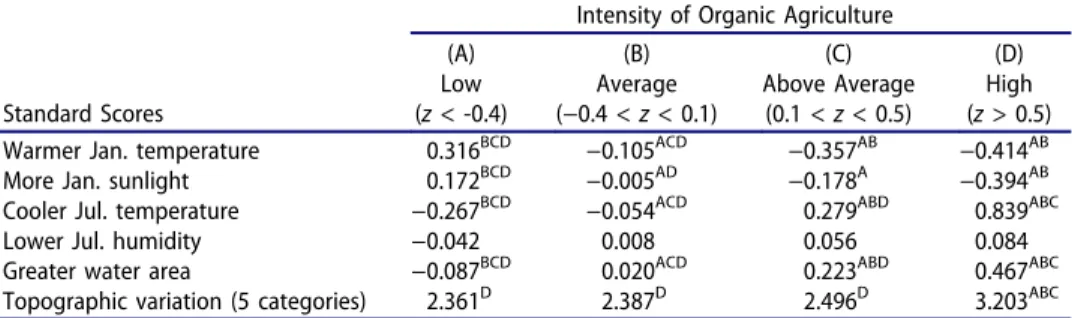
In addition to their spatial distribution, counties of high organic agriculture also have different environmental and socioeconomic characteristics that set them apart from lower intensity counties. The mean differences across the intensity categories are presented in Table 2–5. In terms of natural amenities, High Intensity areas tend to have colder and darker winters, cooler summers, and they are more likely to have sizable bodies of water. The topography is also
Table 2.Natural amenity characteristics by intensity of organic agriculture for N = 3,069 counties
in the US.
Intensity of Organic Agriculture
Standard Scores (A) Low (z < -0.4) (B) Average (−0.4 < z < 0.1) (C) Above Average (0.1 < z < 0.5) (D) High (z > 0.5) Warmer Jan. temperature 0.316BCD −0.105ACD −0.357AB −0.414AB
More Jan. sunlight 0.172BCD −0.005AD −0.178A −0.394AB
Cooler Jul. temperature −0.267BCD −0.054ACD 0.279ABD 0.839ABC
Lower Jul. humidity −0.042 0.008 0.056 0.084
Greater water area −0.087BCD 0.020ACD 0.223ABD 0.467ABC
Topographic variation (5 categories) 2.361D 2.387D 2.496D 3.203ABC Note. Scheffe’s test indicates significant differences at p<.05 between groups. Topography 1= Plains; 2 =
Tablelands; 3 = Plains with Hills or Mountains; 4 = Open Hills and Mountains; 5 = Hills and Mountains.
more varied, with hills and mountains that are interspersed with plains, com-pared to mostly tablelands, which are found in lower organic areas. This con-firms the research that the regional differences of organic agriculture are associated with landscape heterogeneity and natural amenities (Gabriel et al.
2009; Guthman2000).
In terms of farm type and operator characteristics, counties in the High Intensity areas tend to have more farms with women operators, farms that sell directly to individuals, and farms that sell directly to community supported agriculture (CSA) organizations. However, most farms in organic intensive
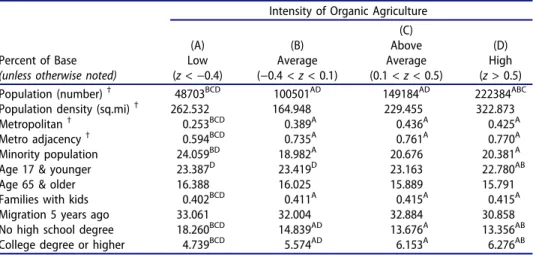
Table 4.Demographic characteristics by intensity of organic agriculture for N = 3,069 counties in
the US.
Intensity of Organic Agriculture
Percent of Base (unless otherwise noted)
(A) Low (z < −0.4) (B) Average (−0.4 < z < 0.1) (C) Above Average (0.1 < z < 0.5) (D) High (z > 0.5) Population (number)† 48703BCD 100501AD 149184AD 222384ABC
Population density (sq.mi)† 262.532 164.948 229.455 322.873 Metropolitan† 0.253BCD 0.389A 0.436A 0.425A Metro adjacency† 0.594BCD 0.735A 0.761A 0.770A Minority population 24.059BD 18.982A 20.676 20.381A Age 17 & younger 23.387D 23.419D 23.163 22.780AB
Age 65 & older 16.388 16.025 15.889 15.791
Families with kids 0.402BCD 0.411A 0.415A 0.415A Migration 5 years ago 33.061 32.004 32.884 30.858 No high school degree 18.260BCD 14.839AD 13.676A 13.356AB College degree or higher 4.739BCD 5.574AD 6.153A 6.276AB Note. Scheffe’s test indicates significant differences at p < .05 between groups. Least squares means
reported holding constant population, except when denoted by†.
Table 3.Farm type and operator characteristics by intensity of organic agriculture for N = 3,069
counties in the US.
Intensity of Organic Agriculture Percent of Base
(unless otherwise noted)
(A) Low (z < −0.4) (B) Average (−0.4 < z < 0.1) (C) Above Average (0.1 < z < 0.5) (D) High (z > 0.5) Farm size (acres) 791.805BD 529.627A 623.007 421.518A
Value of land & buildings per acre ($1000) 3.850 3.964 4.392 6.336 Value of agricultural products per farm ($1000) 198.581 181.385D 224.854 233.900B
Net income per farm ($1000) 45.717 45.747 53.953 47.394 Women operators 28.884BCD 29.786ACD 31.046ABD 34.099ABC
Farms selling to individuals 4.490BCD 6.568ACD 9.842ABD 15.345ABC Farms selling to CSAs 0.360BCD 0.552ACD 0.888ABD 2.038ABC Farms legal status: Family/individual 85.864CD 86.297CD 83.414ABD 81.126ABC Partnership 7.194BD 6.428ACD 7.413B 8.073AB Corporation 5.137CD 5.527CD 7.159AB 8.318AB
Other 1.804D 1.748D 2.014 2.483AB
Note. Scheffe’s test indicates significant differences at p < .05 between groups. Other farms include legal status for cooperative, estate or trust, institutional, etc.
areas are less likely to be family operations, and instead they are more likely to have corporative or partnership operations. Perhaps as a result, organic inten-sive areas have much higher farm valuations compared to low organic areas, and they tend to market a higher value of agricultural products. Further, the results show that more intensive organic production is linked to smaller farm sizes, as the average number of acres that are farmed in low intensity counties is nearly double that which is found in high counties. This somewhat supports the agrarianist vision of the organic movement for which organic farming is often portrayed as small-scale farms.
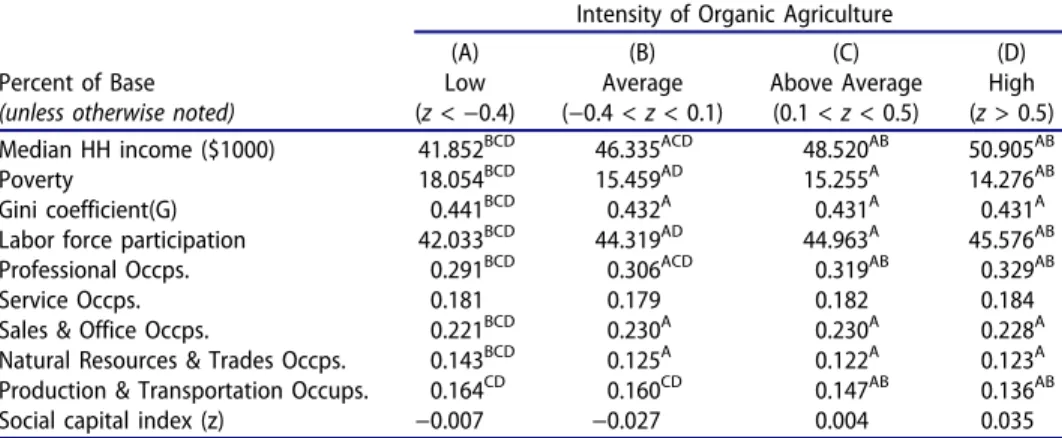
In terms of community demographics, high organic areas tend to have larger populations that are located in or are adjacent to metropolitan areas, compared to those of lower organic areas. Organic intensive counties tend to have fewer younger people and are better educated, with fewer high school noncompleters and more college graduates. In terms of socioeconomic differences, High Intensity and Above Average organic areas generally have higher median incomes, lower poverty, and more participation in the labor force. For example, comparing the High and Low intensity counties we find large differences in median incomes ($50,905 versus $41,852), poverty rates (14.28% versus 18.05%), and labor force participation (45.58% versus 42.03%), but there are fewer differences in income inequality. More intensive organic agriculture areas tend to have fewer people who are employed in natural resource and production occupations, while lower inten-sive areas have more of these jobs. Rather, most people in organic areas are employed in higher skilled professional occupations. This suggests that organic intensive communities are less dependent on agriculture and production for employment, but they are more dependent on the higher skilled services economy. The second objective seeks to statistically identify the environmental and socio-economic factors that are associated with organic agriculture. A spatial regression
Table 5.Socioeconomic characteristics by intensity of organic agriculture for N = 3,069 counties
in the US.
Intensity of Organic Agriculture Percent of Base
(unless otherwise noted)
(A) Low (z < −0.4) (B) Average (−0.4 < z < 0.1) (C) Above Average (0.1 < z < 0.5) (D) High (z > 0.5) Median HH income ($1000) 41.852BCD 46.335ACD 48.520AB 50.905AB
Poverty 18.054BCD 15.459AD 15.255A 14.276AB
Gini coefficient(G) 0.441BCD 0.432A 0.431A 0.431A
Labor force participation 42.033BCD 44.319AD 44.963A 45.576AB Professional Occps. 0.291BCD 0.306ACD 0.319AB 0.329AB
Service Occps. 0.181 0.179 0.182 0.184
Sales & Office Occps. 0.221BCD 0.230A 0.230A 0.228A Natural Resources & Trades Occps. 0.143BCD 0.125A 0.122A 0.123A Production & Transportation Occups. 0.164CD 0.160CD 0.147AB 0.136AB Social capital index (z) −0.007 −0.027 0.004 0.035 Note. Scheffe’s test indicates significant differences at p < .05 between groups. Least squares means
reported holding constant population.
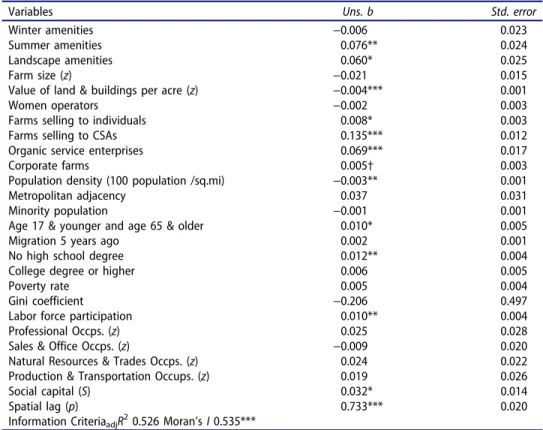
was used to predict these factors and is presented inTable 6. This model exhibits a moderate to strong fit to the data (adjR2= 0.526). The statistically significant spatial
lags indicate that being in the organic intensive counties are increased if it is adjacent to other organic intensive counties, which provides evidence that organic agriculture is spatially dependent. However, it further confirmed the importance of the spatial autoregressive term (Fotheringham, Brunsdon, and Charlton2002). There are several environmental and socioeconomic factors that exert an impact on organic farming. First, more desirable summer amenities (cooler and less humid in July) have a positive effect on organic farming. More desirable landscape amenities (more varied topography and water) are also positively associated with intensive organic farming. In short, organic agriculture tends to be located in areas with milder summers that are dominated by rolling hills and water. Natural amenities did have a strong impact on organic agriculture produc-tion. Because flat land is more conducive to intensive agriculture while steep slopes and hilly mountains are a disadvantage to mechanization, it is assumed that farmers with a lower potential for intensification are more likely to adopt organic farming (Schmidtner et al.2012; Wollni and Andersson2014).
Table 6.Multiple regression of organic agriculture on natural amenity and socioeconomic factors.
Variables Uns. b Std. error
Winter amenities −0.006 0.023
Summer amenities 0.076** 0.024
Landscape amenities 0.060* 0.025
Farm size (z) −0.021 0.015
Value of land & buildings per acre (z) −0.004*** 0.001
Women operators −0.002 0.003
Farms selling to individuals 0.008* 0.003
Farms selling to CSAs 0.135*** 0.012
Organic service enterprises 0.069*** 0.017
Corporate farms 0.005† 0.003
Population density (100 population /sq.mi) −0.003** 0.001
Metropolitan adjacency 0.037 0.031
Minority population −0.001 0.001
Age 17 & younger and age 65 & older 0.010* 0.005
Migration 5 years ago 0.002 0.001
No high school degree 0.012** 0.004
College degree or higher 0.006 0.005
Poverty rate 0.005 0.004
Gini coefficient −0.206 0.497
Labor force participation 0.010** 0.004
Professional Occps. (z) 0.025 0.028
Sales & Office Occps. (z) −0.009 0.020
Natural Resources & Trades Occps. (z) 0.024 0.022 Production & Transportation Occups. (z) 0.019 0.026
Social capital (S) 0.032* 0.014
Spatial lag (p) 0.733*** 0.020
Information CriteriaadjR20.526 Moran’s I 0.535***
Note. Unstandardized regression coefficient with standard errors in parentheses. Significant at †p < .1, *p < .05, **p < .01, ***p < .001. Spatial lag uses k = 4 nearest neighbor weights.
In terms of farm type factors, a larger farm size has a negative effect on organic production although it is not significant. Despite the literature that suggests that high land values will affect what can be grown profitably and push organic conversion to match the commercial agricultural development (Eades and Brown2006; Guthman2004a), our results showed the opposite effect after con-trolling for spatial dependency on organic production. This perhaps implies that the effect of high-value farmland on the necessity of growing high-value crops such as organic products to gain a price premium is spatial nonstationary. Moreover, while corporate farms have a minor effect on organic farming, we found that direct sales to individuals for human consumption from roadside stands, farmers’ markets, and pick-your-own sites, and sales to community supported agriculture arrangements are strong predictors. Organic intensive areas also tend to have more organic service enterprises that include organic associations, manufacturers, distributors, retailers, and brokers.
Demographically, population densities and metropolitan adjacency have marginal effects on organic agriculture, which indicates that both low and high organic areas include urbanized areas. It is notable that the relatively more at-risk populations are associated with organic intensive counties, such as youth, elders, and high school noncompleters. The explanation is that because urbanization has marginal effects on organic farming, organic intensive counties in rural areas might have larger shares of youth and elders. The other possible explanation is that as the US population is aging and becoming wealthier and more ethnically diverse, and these demographic and income changes are expected to lead to an increased demand for higher food quality and variety (Blisard et al.2002).
Socioeconomically, the link between economic well-being and organic agricul-ture is mixed. While studies often link organic development to positive institu-tional settings, our results show that high intensity areas have better labor force participation rates than low intensity ones, yet no association was found for income equality. In terms of employment, high organic areas seem to have more jobs in natural resources, trades occupations (agriculture, construction, maintenance, and repair), and professional settings (management, business, science, arts), but they are not statistically significant. Finally, the results show that social support and community engagement through social capital are posi-tively associated with organic production. This generally supports a growing belief that social capital promotes socially collective action and community well-being, which in turn influences economic growth and community development (Rupasingha, Goetz, and Freshwater2006).
Discussion and conclusion
Despite the fact that an agrarianist vision has been potent within the organic movement, which embraces the idea that small-scale and family-operated farms
provide a basis for economic security and farmer independence (Guthman2004a; Meares1997; Strange1984), recent trends have shown that organic agriculture has evolved into a highly pluralistic system. The heterogeneity in organic farming seems to result from major factors that include the establishment of government rules, the logics of agricultural capitalism, and the power of market dynamics (Buck, Getz, and Guthman1997; Goodman2000; Milestad and Darnhofer2003). In short, the development of organic agriculture could be seen as part of the general socioeconomic and political change that is embedded in the agricultural geography of the nation and a broader socioinstitutional complex.
To better understand, the spatial pattern of organic farming, this research investigates multiple measures of organic agriculture and examines its eco-logical and socioeconomic correlates across meso-scale geographies over time. Conceptually, the agroecosystem framework is useful in understanding the interactions and relationships among the diverse components of the organic production system. On the one hand, agroecology has its foundation in the agrarian social thought that emerged as a response to the negative externalities of the processes of agricultural industrialization. On the other hand, with its ecosystem basis, agroecology has evolved toward an approach that focuses on the social, economic, and political drivers that seek to provide insight at the systems level and contribute to sustainable societies.
Using data that are taken from the Census of Agriculture, organic agriculture is measured using organic farms and transitioning farms, as a share of total farms, in each county for 2012, and changes in organic farms between 2007 and 2012. A factor score index is constructed to represent the intensity of organic farming. In terms of geography, organic agriculture is concentrated primarily in metropolitan areas in the Northeast and the Pacific Coast, and in rural areas with desirable natural amenities such as the Northern Great Lakes and the Mountain West. In general, the results of current organic distribution are consistent with the findings of studies that were conducted by Eades and Brown (2006) and Taus, Ogneva-Himmelberger, and Rogan (2013) that analyzed data from 2002 and 2007, respectively. High values of organic farming are often clustered in states in New England, on the West Coast, and in Colorado and New Mexico. However, despite the relative absence of organic agriculture in the southern states, the presence of current organic intensive counties in the Midwest and the South provides evidence that organic agriculture has rapidly diffused in places that are dominated by conventional agriculture.
The results also indicate that organic agriculture is spatially dependent, which means that high (low) organic areas tend to be located near other high (low) organic areas. In general,“neighborhood effects” did play an important role in organic conversion. In terms of ecological factors, organic intensive areas tend to have milder summers, some harsh winters, and more desirable landscapes. The explanation is that in areas where there are constraints to intensive farming, such as topography or climate, producers are less likely to gain efficiency and
profitability from industrial practices, and they are therefore more likely to adopt organic farming, which can attract market premiums. The results from this study find a strong link between organic agriculture and natural amenities, which supports the assumption that lower agricultural potential predisposes conversion to organic production, and it may further create regions with a high prevalence of organic agriculture (Gabriel et al.2009; Pietola and Lansink2001; Schmidtner et al.2012).
In addition, our findings show that organic intensive areas have more diverse farm operations, with more direct agriculture sales to people and the community. The concurrence of organic producers and agriculture direct marketers suggests that they are likely to display similar or cooperating production types. This is because organic farmers market their products directly to consumers more frequently than conventional farmers do (Dimitri and Greene2002), which some-what supports the idea that a farming community with the institutional support of social networks, infrastructure, and marketing outlets would improve organic practices in the regional food industry (Kroma 2006; Milestad et al. 2010). In other words, neighborhood effects not only play an important role on organic conversion in terms of physical distance between farms but may also affect marketing strategies among producers.
The development of organic agriculture has been shaped by complex interac-tions among social, political, and economic drivers. Because the organic movement is often associated with an economic action through social embeddedness that is characterized by knowledge, innovation, trust, and social learning (Morgan and Murdoch2000; Padel2001), the extant literature tends to link organic farming with better individual attributes and socioeconomic settings. However, our findings show mixed support. Areas with intensive organic activity tend to have a high dependency ratio and more high school noncompleters. Although they seem to show higher household income and higher participation in the labor force, com-munities with high organic activity are not associated with income equality.
Moreover, the agriculture sector does not work in isolation from the broader economy, but in part depends upon and is influenced by the non-farm sector. The findings show that organic intensive areas have more service enterprises such as organic manufacturers, distributors, retailers, and brokers. In addition, high intensity areas seem to have more high-skilled service occupations. This suggests that organic production is not only driven by the food market, but it is also related to other industrial promotion such as the production and service economy. The results also find that communities with high organic production generally have higher community engagement through social capital, which suggests that social capital enables a community’s prospects for achieving sustainable livelihood security because of its inherent features of trust, cohesion, and reciprocity, which can increase social confidence and reduce economic uncertainty (Getz2008; Kroma2006). In this respect, the ways in which com-munities are organized seem to affect how organic efforts are maintained.
Overall, there are several key findings in this research that suggest opportunities and directions for future research on organic agriculture in the United States. First, organic agriculture needs to be understood as a dynamic system. The agroecology approach is helpful in interpreting the regional variations of organic agriculture, in which it views agriculture and food systems more generally as being embedded in landscapes and part of a broader socioinstitutional system. Conversion to organic production goes beyond farming techniques and agronomic principles, and it may involve a new set of social relationships that involve values and economic well-being, as well as the knowledge and communication that are inscribed in social networks. The findings of this research support a general hypothesis that suggests “organic friendly” areas that are based on their similarities in demographic and socioeconomic characteristics would be most likely to support organic production (Constance, Choi, and Lyke-Ho-Gland2008; Lohr, Gonzalez-Alvarez, and Graf
2001). That is, for studies to reveal the spatial patterns of organic agriculture and the factors that drive its development, it is commonly agreed that the analyses must be related to their specific context of socioeconomic geography.
Organic agriculture usually represents a transformative approach that com-bines production goals with broader social objectives (Bellon and Lamine
2009; Youngberg and Demuth2013). Despite the fact that the extant studies tend to link agricultural restructuration and organic conversion to positive individual attributes or socioeconomic settings in the community, our findings show mixed results. On the one hand, spatial nonstationarity might be an explanation for the conflicting conclusions that have been derived from the extant studies regarding organic conversion and its socioeconomic predictors. On the other hand, it may indicate that organic agriculture has changed dramatically, and the role of organic movement is somewhat different today than it was when it began. As a result, the community determinants that affect organic conversion may play a different role for early and late adopters, particularly with regard to economic well-being, communication behavior, and social relations.
While this research provides a foundation for linking county-level envir-onmental and socioeconomic predictors with organic production, the limita-tions of the study are addressed below. First, because organic agriculture and organic production is defined based on USDA criteria, noncertified organic agriculture practices, for example, those that are defined by the farmers themselves, are excluded in the analysis. Second, there is a lack of specific organic demographic and socioeconomic data at the farm-level. Therefore, potential ecological fallacy may have occurred in the interpretation of the statistical data where inferences about the individual organic farms are based on the analyses of aggregated county-level data. Third, as Sutherland (2013) stated, the exclusion of non-converting conventional farmers in the broader literature on organic agriculture is also a problem. Because empirical research on what conventional farmers are like and their corresponding changes are
rarely included in the research, future studies should contain the context of changes to both organic and conventional farming practices. Finally, because the survey data that are used in this study did not capture the “mixed” growers who own both conventional and organic farms, this may lead to a misreading of the analysis of the organic sector. Take Guthman’s (2004a) study of California’s organic sector for example. Mixed growers are likely to be operators of very large acreage. However, their organic practices might be treated as smaller-scale production in the survey. In that case, a sizeable proportion of organic farming that is done by large-scale conventional growers could be buried within the statistics.
References
Abaidoo, S., and H. Dickinson. 2002. Alternative and conventional agricultural paradigms:
Evidence from farming in southwest Saskatchewan. Rural Sociology 67:114–31.
doi:10.1111/j.1549-0831.2002.tb00096.x.
Bagi, F., and R. Reeder. 2012. Farm activities associated with rural development initiatives.
(ERR 134) Accessed May 5, 2017. USDA, Economic Research Service. https://www.ers.
usda.gov/publications/pub-details/?pubid=44977.
Bellon, S., and C. Lamine. 2009. Conversion to organic farming: A multidimensional research object at the crossroads of agricultural and social sciences. A review. Agronomy for
Sustainable Development. 29:97–112. doi:10.1051/agro:2008007.
Best, H. 2008. Organic agriculture and the conventionalization hypothesis: A case study from
West Germany. Agriculture and Human Values 25:95–95. doi:10.1007/s10460-007-9073-1.
Blisard, N., B. H. Lin, J. Cromartie, and N. Ballenger. 2002. America’s changing appetite:
Food consumption and spending to 2020. Food Review 25:2–9.
Buck, D., C. Getz, and J. Guthman. 1997. From farm to table: The organic vegetable
commodity chain of northern California. Sociologia Ruralis 37:3–20. doi:10.1111/
soru.1997.37.issue-1.
Buttel, F. 2000. The recombinant BGH controversy in the United States: Toward a new
consumption politics of food? Agriculture and Human Values 17:5–20. doi:10.1023/
A:1007636911210.
Chi, G., and J. Zhu. 2008. Spatial regression models for demographic analysis. Population
Research and Policy Review 27:17–42. doi:10.1007/s11113-007-9051-8.
Constance, D. H., J. Y. Choi, and H. Lyke-Ho-Gland. 2008. Conventionalization, bifurcation,
and quality of life: Certified and non-certified organic farmers in Texas. Southern Rural
Sociology 23:208–34.
Darnhofer, I., T. Lindenthal, R. Bartel-Kratochvil, and W. Zollitsch. 2010.
Conventionalisation of organic farming practices: From structural criteria towards an assessment based on organic principles. A review. Agronomy for Sustainable Development 30:67–81. doi:10.1051/agro/2009011.
Daugbjerg, C. 2012. The world trade organization and organic food trade: Potential for
restricting protectionism? Organic Agriculture 2:55–66. doi:10.1007/s13165-012-0024-9.
Delind, L. B. 2000. Transforming organic agriculture into industrial organic products:
Reconsidering national organic standards. Human Organization 59:198–208.
doi:10.17730/humo.59.2.hm8263678687n536.
Dimitri, C., and C. Greene. 2002. Recent growth patterns in the U.S. organic foods market. (AIB 777) Accessed May 5, 2017. USDA, Economic Research Service, Market and Trade
Economics Division and Resource Economics Division. https://www.ers.usda.gov/publica
tions/pub-details/?pubid=42456.
Dupuis, E. M. 2000. Not in my body: Bgh and the rise of organic milk. Agriculture and
Human Values 17:285–95. doi:10.1023/A:1007604704026.
Duram, L. A. 2000. Agents’ perceptions of structure: How Illinois organic farmers view political, economic, social, and ecological factors. Agriculture and Human Values 17:35–
48. doi:10.1023/A:1007632810301.
Eades, D., and C. Brown. 2006. Identifying spatial clusters within U.S. Organic agriculture. Morgantown, WV: Regional Research Institute.
Fernandez, M., K. Goodall, M. Olson, and V. E. Mendez. 2013. Agroecology and alternative agri-food movements in the United States: Toward a sustainable agri-food system. Agroecology and Sustainable Food Systems 37:115–26.
Fotheringham, A. S., C. Brunsdon, and M. Charlton. 2002. Geographically weighted regression: The analysis of spatially varying relationships. Hoboken, NJ: Wiley.
Francis, C., G. Lieblein, S. Gliessman, T. A. Breland, N. Creamer, R. Harwood, L. Salomonsson. et al. 2003. Agroecology: The ecology of food systems. Journal of
Sustainable Agriculture 22:99–118. doi:10.1300/J064v22n03_10.
Gabriel, D., S. J. Carver, H. Durham, W. E. Kunin, R. C. Palmer, S. M. Sait, S. Stagl, and T. G. Benton. 2009. The spatial aggregation of organic farming in England and its underlying
environmental correlates. Journal of Applied Ecology 46:323–33. doi:10.1111/jpe.2009.46.
issue-2.
Getz, C. 2008. Social capital, organic agriculture, and sustainable livelihood security:
Rethinking agrarian change in Mexico. Rural Sociology 73:555–79. doi:10.1526/
003601108786471521.
Gliessman, S. R. 2004. Agroecology and Agroecosystems. In Agroecosystems Analysis, Eds. D. Rickerl, and C. Francis, 19–29. Madison, WI: American Society of Agronomy.
Gliessman, S. R. 2007. Agroecology: The ecology of sustainable food systems. 2nd ed. Boca Raton, FL: CRC Press.
Goodman, D. 2000. Organic and conventional agriculture: Materializing discourse and
agro-ecological managerialism. Agriculture and Human Values 17:215–19. doi:10.1023/
A:1007650924982.
Greene, C. 2000. U.S. Organic agriculture gaining ground. Agricultural outlook 270:9–14. Greene, C., and A. Kremen. 2003. U.S. organic farming in 2000-2001: Adoption of certified
systems. (AIB 780) Accessed May 5, 2017. USDA, Economic Research Service, Resource
Economics Division.https://www.ers.usda.gov/publications/pub-details/?pubid=42492.
Guptill, A. 2009. Exploring the conventionalization of organic dairy: Trends and
counter-trends in upstate New York. Agriculture and Human Values 26:29–42. doi:
10.1007/s10460-008-9179-0.
Guthman, J. 1998. Regulating meaning, appropriating nature: The codification of California organic agriculture. Antipode 30:135–54. doi:10.1111/anti.1998.30.issue-2.
Guthman, J. 2000. Raising organic: An agro-ecological assessment of grower practices in
California. Agriculture and Human Values 17:257–66. doi:10.1023/A:1007688216321.
Guthman, J. 2002. Commodified meanings, meaningful commodities: Re–thinking produc-tion–consumption links through the organic system of provision. Sociologia Ruralis 42:295–311. doi:10.1111/soru.2002.42.issue-4.
Guthman, J. 2004a. Agrarian dreams: The paradox of organic farming in California. Berkeley: University of California Press.
Guthman, J. 2004b. Back to the land: The paradox of organic food standards. Environment
and Planning A 36:511–28. doi:10.1068/a36104.
Hall, A., and V. Mogyorody. 2001. Organic farmers in Ontario: An examination of the
conventionalization argument. Sociologia Ruralis 41:399–322. doi:10.1111/soru.2001.41.
issue-4.
Heckman, J. 2006. A history of organic farming: Transitions from sir Albert Howard’s war in the soil to USDA national organic program. Renewable Agriculture and Food Systems
21:143–50. doi:10.1079/RAF2005126.
Hooker, N., and C. J. Shanahan. 2012. Emerging spatial dependencies within U.S. Organic
supply chains. Journal of Food Products Marketing 18:426–50. doi:10.1080/
10454446.2012.701989.
Howard, P. H., and P. Allen. 2006. Beyond organic: Consumer interest in new labelling schemes in the central coast of California. International Journal of Consumer Studies 30:439–51. doi:10.1111/ijc.2006.30.issue-5.
Jaenicke, E. C., S. J. Goetz, P.-C. Wu, and C. Dimitri. 2009. Identifying and measuring the effect of firm clusters among certified organic processors and handlers. Presented at the Agricultural and Applied Economics Association 2009 Annual Meeting. Milwaukee, Wisconsin.
Kaltoft, P. 1999. Values about nature in organic farming practice and knowledge. Sociologia Ruralis 39:39–53. doi:10.1111/soru.1999.39.issue-1.
Kaufmann, P., R. Zemeckis, V. Skulskis, E. Kairyte, and S. Stagl. 2011. The diffusion of
organic farming in Lithuania. Journal of Sustainable Agriculture 35:522–49. doi:10.1080/
10440046.2011.579838.
Klonsky, K. 2000. Forces impacting the production of organic foods. Agriculture and Human
Values 17:233–43. doi:10.1023/A:1007655312687.
Klonsky, K., and L. Tourte. 1998. Organic agricultural production in the United States: Debates and directions. American Journal of Agricultural Economics 80:1119–24. doi:10.2307/1244215.
Kroma, M. M. 2006. Organic farmer networks: Facilitating learning and innovation for
sustainable agriculture. Journal of Sustainable Agriculture 28:5–28. doi:10.1300/
J064v28n04_03.
Langer, V. 2002. Changes in farm structure following conversion to organic farming in Denmark.
American Journal of Alternative Agriculture 17:75–82. doi:10.1079/AJAA200212/AJA200212.
Lobao, L. 1996. A sociology of the periphery versus a peripheral sociology: Rural sociology
and the dimension of space. Rural Sociology 61 (1):77–102. doi:10.1111/j.1549-0831.1996.
tb00611.x.
Lockie, S., K. Lyons, G. Lawrence, and D. Halpin. 2006. Going organic: Mobilizing networks for environmentally responsible food production. Wallingford: CABI.
Lohr, L., Y. Gonzalez-Alvarez, and A. Graf. 2001. Predicting organic market development with spatial analysis of existing industry information. Presented at the American Agricultural Economics Association annual meeting. Chicago, Illinois.
Lotter, D. W. 2003. Organic agriculture. Journal of Sustainable Agriculture 21:59–128. doi:10.1300/J064v21n04_06.
Marasteanu, J., and E. C. Jaenicke. 2013. Agglomeration and spatial dependence in certified organic operations in the United States. Presented at the Agricultural & Applied Economics Association’s 2013 AAEA & CAES Joint Annual Meeting. Washington, DC. Marsden, T., J. Banks, and G. Bristow. 2000. Food supply chain approaches: Exploring their role
in rural development. Sociologia Ruralis 40:424–38. doi:10.1111/soru.2000.40.issue-4. Marsden, T., J. Banks, and G. Bristow. 2002. The social management of rural nature:
Understanding agrarian-based rural development. Environment and Planning A 34:809– 25. doi:10.1068/a3427.
Mcbride, W., and C. Greene. 2009. Characteristics, costs, and issues for organic dairy farming.
(ERR 82) Accessed May 5, 2017. USDA, Economic Research Service.https://www.ers.usda.
gov/publications/pub-details/?pubid=46268.
Mcbride, W., and C. Greene. 2010. Organic dairy sector evolves to meet changing demand.
Amber waves. Accessed May 5, 2017.https://www.ers.usda.gov/amber-waves/2010/march/
organic-dairy-sector-evolves-to-meet-changing-demand/.
McCann, E., S. Sullivan, D. Erickson, and R. De Young. 1997. Environmental awareness, economic orientation, and farming practices: A comparison of organic and conventional
farmers. Environmental Management 21:747–58. doi:10.1007/s002679900064.
Meares, A. C. 1997. Making the transition from conventional to sustainable agriculture: Gender, social movement participation, and quality of life on the family farm. Rural Sociology 62:21–47. doi:10.1111/j.1549-0831.1997.tb00643.x.
Milestad, R., R. Bartel-Kratochvil, H. Leitner, and P. Axmann. 2010. Being close: The quality of social relationships in a local organic cereal and bread network in lower Austria. Journal of Rural Studies 26:228–40. doi:10.1016/j.jrurstud.2010.01.004.
Milestad, R., and I. Darnhofer. 2003. Building farm resilience: The prospects and challenges of organic farming. Journal of Sustainable Agriculture 22:81–97. doi:10.1300/J064v22n03_09. Morgan, K., and J. Murdoch. 2000. Organic vs. Conventional agriculture: Knowledge, power and
innovation in the food chain. Geoforum 31:159–73. doi:10.1016/S0016-7185(99)00029-9.
Padel, S. 2001. Conversion to organic farming: A typical example of the diffusion of an innovation? Sociologia Ruralis 41:40–61. doi:10.1111/soru.2001.41.issue-1.
Padel, S., N. Lampkin, and C. Foster. 1999. Influence of policy support on the development of organic farming in the European Union. International Planning Studies 4:303–15. doi:10.1080/13563479908721744.
Pietola, K., and A. Lansink. 2001. Farmer response to policies promoting organic farming
technologies in Finland. European Review of Agricultural Economics 28:1–15. doi:10.1093/
erae/28.1.1.
Pugliese, P. 2001. Organic farming and sustainable rural development: A multifaceted and
promising convergence. Sociologia Ruralis 41:112–30. doi:10.1111/soru.2001.41.issue-1.
Rigby, D., and D. Caceres. 2001. Organic farming and the sustainability of agricultural
systems. Agricultural Systems 68:21–40. doi:10.1016/S0308-521X(00)00060-3.
Rosset, P. M., and M. A. Altieri. 1997. Agroecology versus input substitution: A fundamental contradiction of sustainable agriculture. Society & Natural Resources 10:283–95. doi:10.1080/08941929709381027.
Rupasingha, A., S. J. Goetz, and D. Freshwater. 2006. The production of social capital in us counties. The Journal of Socio-Economics 35:83–101. doi:10.1016/j.socec.2005.11.001. Saltiel, J., J. W. Bauder, and S. Palakovich. 1994. Adoption of sustainable agricultural
practices: Diffusion, farm structure, and profitability. Rural Sociology 59:333–49. doi:10.1111/j.1549-0831.1994.tb00536.x.
Schmidtner, E., C. Lippert, B. Engler, A. M. Haring, J. Aurbacher, and S. Dabbert. 2012. Spatial distribution of organic farming in Germany: Does neighbourhood matter?
European Review of Agricultural Economics 39:661–83. doi:10.1093/erae/jbr047.
Sheahan, C. M., D. B. Bray, M. G. Bhat, and K. Jayachandran. 2012. Ecological, economic, and organizational dimensions of organic farming in Miami-Dade county. Journal of
Sustainable Agriculture 36:83–105. doi:10.1080/10440046.2011.627990.
Sligh, M., and C. Christman. 2003. Who owns organic? The global status, prospects and challenges of a changing organic market. Pittsboro, NC: Rural Advancement Foundation International.
Smith, E., and T. Marsden. 2004. Exploring the‘limits to growth’ in uk organics: Beyond the
statistical image. Journal of Rural Studies 20:345–57. doi:10.1016/S0743-0167(03)00044-5.
Stofferahn, C. W. 2009. Personal, farm and value orientations in conversion to organic
farming. Journal of Sustainable Agriculture 33:862–84. doi:10.1080/10440040903303595.
Strange, M. 1984. The economic structure of a sustainable agriculture. In Meeting the expectations of the land: Essays in sustainable agriculture and stewardship, Eds. W. Jackson, W. Berry, and B. Colman, 115–25. San Francisco, CA: North Point Press.
Sutherland, L. A. 2013. Can organic farmers be‘good farmers’? Adding the taste of necessity’
to the conventionalization debate. Agriculture and Human Values 30:429–41. doi:10.1007/
s10460-013-9424-z.
Taus, A., Y. Ogneva-Himmelberger, and J. Rogan. 2013. Conversion to organic farming in the continental united states: A geographically weighted regression analysis. The Professional
Geographer 65:87–102. doi:10.1080/00330124.2011.639634.
Tavernier, E. M., and V. Tolomeo. 2004. Farm typology and sustainable agriculture: Does size
matter? Journal of Sustainable Agriculture 24:33–46. doi:10.1300/J064v24n02_05.
Tovey, H. 1997. Food, environmentalism and rural sociology: On the organic farming move-ment in Ireland. Sociologia Ruralis 37:21–37. doi:10.1111/soru.1997.37.issue-1.
Tovey, H. 2002. Alternative agriculture movements and rural development cosmologies. International Journal of Sociology of Agriculture and Food 10:1–11.
Vos, T. 2000. Visions of the middle landscape: Organic farming and the politics of nature.
Agriculture and Human Values 17:245–56. doi:10.1023/A:1007623832251.
Walz, E. 2004. Final results of the fourth biennial National Organic Farmers’ Survey. Santa Cruz, CA: Organic Farming Research Foundation.
Wollni, M., and C. Andersson. 2014. Spatial patterns of organic agriculture adoption:
Evidence from Honduras. Ecological Economics 97:120–28. doi:10.1016/j.
ecolecon.2013.11.010.
Youngberg, G., and S. P. Demuth. 2013. Organic agriculture in the united states: A 30-year
retrospective. Renewable Agriculture and Food Systems 28:1–35. doi:10.1017/
S1742170513000173.
Zepeda, L., and J. Li. 2007. Characteristics of organic food shoppers. Journal of Agricultural
and Applied Economics 39:17–28. doi:10.1017/S1074070800022720.
Zilberman, D., M. Khanna, and L. Lipper. 1997. Economics of new technologies for sustain-able agriculture. Australian Journal of Agricultural and Resource Economics 41:63–80. doi:10.1111/1467-8489.00004.