On the Demand for Lotteries in Greece
5
0
0
全文
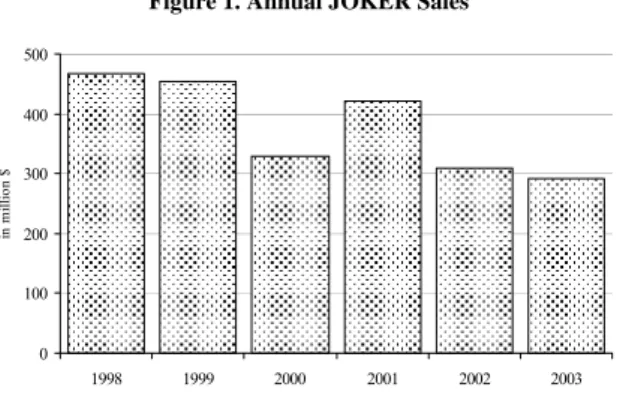
(2) 256. International Journal of Business and Economics. revenue is maximized. Recently, however, Forrest et al. (2002) analyzed the issue of optimality directly by focusing on the jackpot elasticity of demand. Their approach has still a straightforward implication for optimal parameter setting in the sense that if the jackpot elasticity of demand is equal to the payout ratio, then net revenue is maximized. Optimality can therefore be attained by adjusting the payout ratio to the elasticity of demand. This paper analyzes payout-allocating rules in the Greek lottery and assesses their optimality. Demand equations both in effective price and jackpot are estimated, and corresponding point elasticities are calculated on the basis of the time series of JOKER, a lotto game recently introduced in Greece. Elasticities are then used to assess the payout-allocating rules set by the local operator. The evidence presented in this paper suggests that the local operator has set a payout ratio lower than what would have been optimal given the lottery demand parameters in Greece. The rest of the paper is structured as follows. The lottery is described in Section 2, methodology and results are presented and discussed in Section 3, and conclusions are drawn in the final section. 2. The Game JOKER was launched in November 1997. The game consisted in selecting 5 numbers out of 45 plus one bonus number out of 20, and the odds of winning the jackpot were 24,435,180 to one. There were eight prize categories, the jackpot for those having predicted the correct 5+1 numbers drawn, and seven lesser categories for 5, 4+1, 4, 3+1, 3, 2+1, and 1+1 correct numbers. The overall payout ratio was set to 50% of sales with 20% to the jackpot, 9% to the second prize, and 21% to the other prizes. A minimum jackpot was guaranteed. There were two draws per week from the start, undistributed prizes were rolled over to the next draw, and a bet’s price was set equal to $0.42 (€0.29). (for a US/€ rate of 1.4609 on Jan. 18, 2008). The JOKER was an exceptional success. Sales in 1998, its first full year of existence, exceeded $438,270 million (€300 million), and success continued in subsequent years; see Figure 1. 3. Demand Estimation Empirical analysis is based on the estimation of the demand parameters and the point elasticity of demand. The corresponding demand equations with respect to effective price and jackpot are: P = α 0 + α 1 ln Q−1 + α 2 R + α 3 R 2 + α 4T + α 5T 2 + α 6 D + ν ln Q = β + β ln Q + β Pˆ + β T + β T 2 + β D + u 0. 1. −1. 2. 3. 4. 5. (1).
(3) George Geronikolaou and George A. Papachristou. 257. Figure 1. Annual JOKER Sales 500 400. in million $. 300 200 100 0 1998. 1999. 2000. 2001. 2002. 2003. for the effective price model specification and: J = γ 0 + γ 1 ln S −1 + γ 2 R + γ 3 R 2 + γ 4T + γ 5T 2 + γ 6 D + ν ln S = δ + δ ln S + δ Jˆ + δ T + δ T 2 + δ D + u 0. 1. −1. 2. 3. 4. 5. (2). for the jackpot model specification where: Q (≠ S ) Q−1 ( S −1 ) P J T D u and ν R. is bets (not equal to sales because of a non-unitary price) is lagged bets (sales) is the effective price is the jackpot is the trend is a superdraw dummy are error terms is the jackpot rolled over from the previous draw. and hats denote fitted values. Sales were substituted for bets because lotto in Greece did not have a unit price, and estimation was performed with two-stage least squares (2SLS) because bets (sales) and effective prices or jackpots are simultaneously determined. Squares of rollover and trend were included to capture potential nonlinear effects. The effective price, P , of a bet was calculated using the standard formula: P = C − (expected prize) × (expected share) ,. (3). where C is the face value of a bet. Assuming that lottery tickets are submitted randomly and independently, the number of winning bets is well approximated by the Poisson distribution, and expected share is given by (1 − e − pQ ) pQ (Cook and Clotfelter, 1993, p. 636). On the other hand, expected prize is equal to the current draw’s jackpot, J , plus any rollover, R , from previous draws times the probability, p , of a bet winning the first prize, so that:.
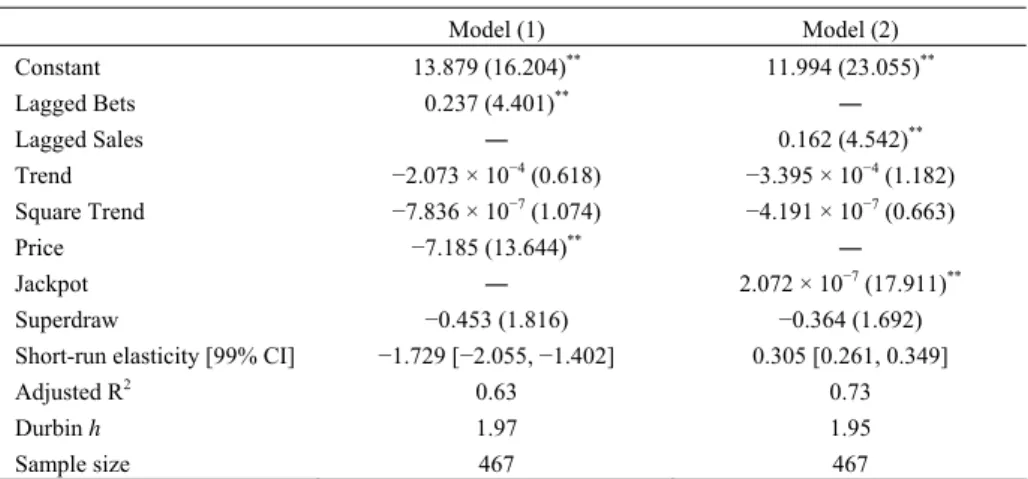
(4) 258. International Journal of Business and Economics P = C − p( R + J ). 1 − e − pQ ( R + J )(1 − e − pQ ) =C− . pQ Q. (4). Point elasticity estimates corresponding to specifications (1) and (2) are given by βˆ2 P and δˆ2 J , where bars denote sample averages, and optimality of the payout parameter decision is inferred by testing the null hypotheses H 0 : βˆ2 P = −1 and H 0 : δˆ2 J = j , where j is the payout ratio for the first category prize. Data on JOKER sales, prizes, and number of winning tickets per draw were collected from the operator’s website (www.opap.gr) and cover the period from July 1999 to December 2003. Results are reported in Table 1. Table 1. JOKER Demand Equation. Constant. Model (1). Model (2). 13.879 (16.204)**. 11.994 (23.055)**. Lagged Bets. 0.237 (4.401)**. ―. Lagged Sales. ―. 0.162 (4.542)**. Trend Square Trend Price Jackpot Superdraw. −2.073 × 10⁻⁴ (0.618) −7. −7.836 × 10 (1.074) **. −7.185 (13.644) ―. −3.395 × 10⁻⁴ (1.182) −4.191 × 10⁻⁷ (0.663) ― 2.072 × 10⁻⁷ (17.911)**. −0.453 (1.816). −0.364 (1.692). −1.729 [−2.055, −1.402]. 0.305 [0.261, 0.349]. Adjusted R2. 0.63. 0.73. Durbin h. 1.97. 1.95. Short-run elasticity [99% CI]. Sample size 467 467 Notes: Absolute values of t-statistics in parentheses. ** and * denote significance at 1% and 5% levels.. Inspection of Table 1 indicates that JOKER was designed in a rather parsimonious way, and payouts were set lower than what would have been justified by net revenue maximization. The effective price elasticity estimate from model (1) is −1.73, which is significantly greater than unity in absolute value at the actual payout of the game, and the jackpot elasticity estimate from model (2) is approximately 30%. Superdraws seem not to have elicited significant response as compared to rollovers, lagged bets and sales; the superdraw dummy coefficient is not significant in either model at standard significance levels. Finally, the trend and square trend coefficients appear to be insignificant. We find that price elasticity was extremely high in Greece as compared to other lotteries. For instance, Gulley and Scott (1993) reported price elasticities of −1.15, −1.92, and −1.20 for the Massachusetts, Kentucky, and Ohio lotteries, Farrell et al. (1999) found a short-run price elasticity of −1.05 for the UK National Lottery, whereas Forrest et al. (2002) estimated a short run elasticity of −0.82 and −0.84 on a more recent set of data for midweek and weekend draws of the British lottery..
(5) George Geronikolaou and George A. Papachristou. 259. Although price sensitivity is measured in response to transitory effective price changes (caused by rollovers as well as superdraws), one would be inclined to expect that a more generous design in terms of payouts would be advisable. 4. Conclusions. Lottery demand elasticity in Greece appears to be much higher than its revenue maximizing value. Our findings suggest that the game is “overpriced” as compared to lotteries in other countries in the sense that the payout is set too low by the Greek provider. In our opinion and in view of our estimates, the Greek provider should consider a more generous payout in order to stimulate greater lottery revenues. References. Cook, P. J. and C. T. Clotfelter, (1993), “The Peculiar Scale Economies of Lotto,” American Economic Review, 83, 634-643. Farrell, L., E. Morgenroth, and I. Walker, (1999), “A Time-Series Analysis of UK Lottery Sales: Long and Short Run Price Elasticities,” Oxford Bulletin of Economics and Statistics, 61, 513-526. Forrest, D., R. Simmons, and N. Chesters, (2002), “Buying a Dream: Alternative Models of Demand for Lotto,” Economic Inquiry, 40, 485-496. Gulley, O. D. and F. A. Scott, Jr., (1993), “The Demand for Wagering on StateOperated Lotto Games,” National Tax Journal, 46, 13-22. Mason, P. M., J. W. Steagall, and M. M. Fabritius, (1997), “The Elasticity of Demand for Lotto Tickets and the Corresponding Welfare Effects,” Public Finance Review, 25, 474-490..
(6)
數據
相關文件
< Notes for Schools: schools are advised to fill in the estimated minimum quantity and maximum quantity (i.e. the range of the quantity) of the items under Estimated Quantity
Students are asked to collect information (including materials from books, pamphlet from Environmental Protection Department...etc.) of the possible effects of pollution on our
which can be used (i) to test specific assumptions about the distribution of speed and accuracy in a population of test takers and (ii) to iteratively build a structural
In addition, based on the information available, to meet the demand for school places in Central Allocation of POA 2022, the provisional number of students allocated to each class
Monopolies in synchronous distributed systems (Peleg 1998; Peleg
Corollary 13.3. For, if C is simple and lies in D, the function f is analytic at each point interior to and on C; so we apply the Cauchy-Goursat theorem directly. On the other hand,
Corollary 13.3. For, if C is simple and lies in D, the function f is analytic at each point interior to and on C; so we apply the Cauchy-Goursat theorem directly. On the other hand,
With the aid of a supply - demand diagram, explain how the introduction of an effective minimum wage law would affect the wage and the quantity of workers employed in that
