Complex refractive-index measurement based on
Fresnel’s equations and the uses of
heterodyne interferometry
Ming-Horng Chiu, Ju-Yi Lee, and Der-Chin Su
The phase difference between s and p polarization of the light reflected from a material is used for measuring the material’s complex refractive index. First, two phase differences that correspond to two different incidence angles are measured by heterodyne interferometry. Then these two phase differ-ences are substituted into Fresnel’s equations, and a set of simultaneous equations is obtained. Finally, the equations are solved by use of a personal computer by a numerical analysis technique, and the complex refractive index of the material can be estimated. © 1999 Optical Society of America
OCIS codes: 120.3180, 120.4530, 120.5050.
1. Introduction
A complex refractive index N共n, k兲 is an important characteristic constant of thin-film materials, where n is the refractive index and k is the extinc-tion coefficient. There are several methods for measuring the complex refractive index of a mate-rial, e.g., R-versus- 共reflectance versus incidence angle兲 methods1– 6 and ellipsometry.7,8 In those
methods, the reflectances of s and p polarization at several different incidence angles or polarization conditions must be measured. Consequently, most of them are related to the measurement of light-intensity variations. However, the stability of the light source, the scattering light, the internal re-flection, and other factors influence the accuracy of the measurement results. Recently, Feke et al.9
proposed a novel method to measure the complex refractive index. The phases that correspond to two orthogonal polarizations at different incidence angles are measured with a phase-shifting inter-ferometric technique. These data are substituted into the special equations derived from Fresnel’s
equations, and the complex refractive index is ob-tained.
In this paper a simple method for measuring a complex refractive index is proposed. A light beam of either s or p polarization reflected from a mate-rial with a complex refractive index has a phase shift. The phase difference between these two kinds of polarization is a function of n, k, and inci-dence angle . The phase differences that corre-spond to two different incidence angles are measured with the heterodyne interferometry pro-posed by Chiu et al.10 These data are substituted
into Fresnel’s equations,11 and a set of
simulta-neous equations is obtained. Then these equations are solved by use of a personal computer by a nu-merical analysis technique, and the complex refrac-tive index of the material can be estimated. The technique has several merits, including a simple optical setup, easy operation, high stability, high measurement accuracy, and rapid measurement. We demonstrate its feasibility.
2. Principles
A. Phase Difference Resulting from Reflection from an Absorbing Material
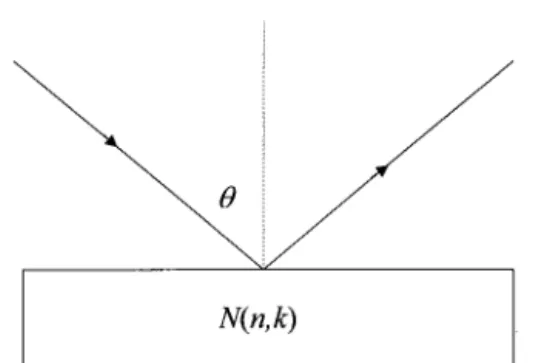
A ray of light in air is incident at onto an absorb-ing material with a complex refractive index N共n, k兲, as shown in Fig. 1. According to Fresnel’s
equa-M.-H. Chiu is with the Department of Electric Engineering, Chien Hsin College of Technology & Commerce, 229, Chien Hsin Road, Chung-Li, 320, Taiwan, China. J.-Y. Lee and D.-C. Su 共[email protected]兲 are with the Institute of Electro-Optical Engineering, National Chiao Tung University, 1001, Ta-Hsueh Road, Hsin-Chu, 300, Taiwan, China.
Received 12 March 1999. 0003-6935兾99兾04047-06$15.00兾0 © 1999 Optical Society of America
tions,11the amplitude reflection coefficients of s and
p polarization can be expressed as rs⫽
cos ⫺ 共u ⫹ iv兲
cos ⫹ 共u ⫹ iv兲⫽ 兩rs兩exp共i␦s兲, (1) rp⫽
N2cos ⫺ 共u ⫹ iv兲
N2cos ⫹ 共u ⫹ iv兲⫽ 兩rp兩exp共i␦p兲, (2)
respectively, where
u2⫽1⁄2兵共n2⫺ k2⫺ sin2兲
⫹ 关共n2⫺ k2⫺ sin2兲2⫹ 4n2k2兴1兾2其, (3)
v2⫽1⁄2兵⫺共n2⫺ k2⫺ sin2兲
⫹ 关共n2⫺ k2⫺ sin2兲2⫹ 4n2k2兴1兾2其, (4)
and ␦s and␦p are the phase shifts of s and p
polar-izations and can be expressed as ␦s⫽ tan⫺1
冉
2v cos u2⫹ v2⫺ cos2冊
, (5) ␦p⫽ tan⫺1冋
2v cos共n2⫺ k2⫺ 2u2兲 u2⫹ v2⫺ 共n2⫹ k2兲2cos2册
, (6)respectively. Hence the phase difference of s polar-ization relative to p polarpolar-ization is
⫽ ␦s⫺ ␦p⫽ tan⫺1
冉
ad⫺ bc ac⫹ bd冊
, (7) where a⫽ 2v cos , b⫽ u2⫹ v2⫺ cos2, c⫽ 2v cos 共n2⫺ k2⫺ 2u2兲, d⫽ u2⫹ v2⫺ 共n2⫹ k2兲2cos2. (8)From Eqs.共7兲 and 共8兲 it is obvious that phase dif-ference is a function of n, k, and , and can be experimentally measured for each given. To eval-uate the values of n and k we require two phase differences 1 and 2 that correspond to two
inci-dence angles,1and2. Hence a set of simultaneous
equations
1⫽ 1共n, k, 1兲, (9)
2⫽ 2共n, k, 2兲 (10)
is obtained. If these simultaneous equations are solved, the complex refractive index of the material can be estimated.
B. Phase-Difference Measurements with Heterodyne Interferometry
Chiu et al.10 proposed a method for measuring the
refractive index of a transparent material by using total-internal-reflection heterodyne interferometry. A schematic diagram of the optical arrangement of our method, which is based on similar considerations, was designed and is shown in Fig. 2共a兲. Linearly polarized light passing through an electro-optic mod-ulator共EO兲 is incident upon a beam splitter 共BS兲 and divided into two parts, a reference beam and a test beam. The reference beam passes through analyzer ANr, and enters photodetector Dr. If the amplitude of light detected by Dr is Er, then the intensity
mea-Fig. 1. Reflection at the surface of an absorbing material.
Fig. 2. Schematic diagram of measurement of the phase differ-ences owing to reflection at共a兲 an absorbing material and 共b兲 a beam splitter. Other abbreviations are defined in text.
sured by Dr is the Ir⫽ 兩Er兩
2
. Here Iris the reference
signal. The test beam is incident at upon a test material. Finally, the reflected light passes through analyzer ANt and is detected by another photodetec-tor, Dt. If the amplitude of the test beam detected by Dt is Et, then Dt measures the intensity It⫽ 兩Et兩2,
and Itis the test signal.
For convenience the⫹z axis is in the propagation direction and the y axis is in the vertical direction. Let the incident light be linearly polarized at 45° with respect to the x axis, the fast axis of EO under an applied electric field be in the horizontal direction, and the transmission axes of both ANr and ANt be at 45° with respect to the x axis. If a sawtoothed signal of frequency f and amplitude V兾2, the half-wave volt-age of the EO, is applied to the EO, then by using Jones calculus we get12,13
Ir⫽1⁄2关1 ⫹ cos共2ft ⫺ BS兲兴, (11) It⫽1⁄2
冋
兩rs兩 2 2 ⫹ 兩rp兩2 2 ⫹冏
rs冏冏
rp冏
cos共2f ⫺ 兲册
, (12) whereBS is the phase difference between s and p polarization that is due to the reflection at the beam splitter. These two sinusoidal signals are sent to the phasemeter, and their phase difference⬘ ⫽ ⫺ BS (13)
can be obtained. Next, let the test beam enter pho-todetector Dtdirectly without the reflection from the
test material, as shown in Fig. 2共b兲. The test signal still has the form of Eq.共12兲 but this time with ⫽ 0. Therefore the phasemeter in Fig. 2共b兲 represents ⫺BS. Substituting ⫺BS into Eq. 共13兲, we obtain
the phase difference.
3. Experiments and Results
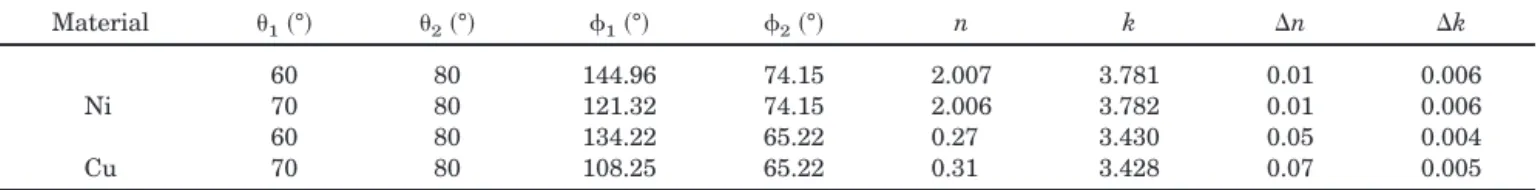
To show the feasibility of this technique, we mea-sured the complex refractive indices of nickel共Ni兲 and cupper共Cu兲. A He–Ne laser with 632.8-nm wave-length and an EO共Model PC200兾2, England Electro-Optics Developments, Ltd.兲 with a half-wave voltage of 170 V were used in this test. The frequency of the sawtoothed signal that was applied to the EO was 800 Hz. We used a high-precision rotation stage 共PS––90兲 with an angular resolution of 0.005° 共Ja-pan Chuo Precision Industrial Com共Ja-pany, Ltd.兲 to mount and rotate the test material and a high-resolution phasemeter with an angular high-resolution of 0.01° to measure the phase difference. In addition,
we used a personal computer to record and analyze the data. The experimental conditions and results are summarized in Table 1. The average experi-mental values of the complex refractive indices of nickel and copper are N共Ni兲 ⫽ 2.01 ⫹ i3.78 and N共Cu兲 ⫽ 0.29 ⫹ i3.43, respectively.
4. Discussion
From Eqs.共9兲 and 共10兲 we get
⌬n ⬵
冏
2 k冏
兩⌬1兩 ⫹冏
1 k冏
兩⌬2兩冏
1 n 2 k ⫺ 2 n 1 k冏
, (14) ⌬k ⬵冏
1 n冏
兩⌬2兩 ⫹冏
2 n冏
兩⌬1兩冏
1 n 2 k ⫺ 2 n 1 k冏
, (15) where⌬n and ⌬k are the errors in n and k and ⌬1 and⌬2are the errors in the phase differences at twodifferent incidence angles 1 and 2, respectively. The errors in the phase differences in this technique may be influenced by the following factors:
共1兲 Angular resolution of the phasemeter
The angular resolution⌬pof the phasemeter can
be expressed as15
⌬p⫽
f fc
⫻ 360°, (16)
where f and fcare the frequencies of the input waves and the reference clock in the phasemeter, respec-tively. In our experiments we used f⫽ 800 Hz and fc ⫽ 32 MHz, so the angular resolution of the phase
meter is better than 0.01°. 共2兲 Second-harmonic error
The second-harmonic error comes from the devia-tion anglerbetween the polarization directions of p polarization of the incident beam and the incidence plane. It introduces an error in the phase differ-ence16:
⌬r⫽
tan共sec 2r⫺ 1兲
1⫹ sec 2rtan2
(17)
Table 1. Experimental Conditions and Measurement Resultsa
Material 1共°兲 2共°兲 1共°兲 2共°兲 n k ⌬n ⌬k
60 80 144.96 74.15 2.007 3.781 0.01 0.006
Ni 70 80 121.32 74.15 2.006 3.782 0.01 0.006
60 80 134.22 65.22 0.27 3.430 0.05 0.004
Cu 70 80 108.25 65.22 0.31 3.428 0.07 0.005
into. The relation curves of ⌬rversus for r⫽ 0.5°, 1.0°, 1.5°, 2.0° are depicted in Fig. 3, and their maximum errors are 0.004°, 0.02°, 0.04°, and 0.07°, respectively. It is obvious that ⌬r equals zero as
⫽ ⫺180°, ⫺90°, 90°, 180°. This error can be made nearly zero by accurate modification of the azimuthal angle of every polarization component, as was done by Chiu et al.13
共3兲 Polarization-mixing error
Owing to the extinction ratio effect of a polarizer, mixing of light polarization occurs. After a ray light passes through a polarizer, its Jones vector should have the following form:
where␣ and  are the complex amplitudes of com-ponents with vibration directions along the x and y axes, and they are mixed into Eyand Ex, respectively;
f is the frequency difference produced by the EO. For clarity the coefficients related to the reference signal and the test signal are expressed by the sub-scripts r and t, respectively. Based on the deriva-tions of Jones calculus, the intensity of the reference signal can be written as17,18
Ir⫽ 兩Ar兩2⫹ 兩Br兩2⫹ 兩␣r兩2⫹ 兩r兩2⫹ 2兩Ar兩兩␣r兩cos共Ar⫺ ␣r兲
⫹ 2兩Br兩兩r兩cos共Br⫺ r兲 ⫹ 2兩Ar兩兩Br兩cos共2ft
⫹ Ar⫺ Br兲 ⫹ 2兩Ar兩兩r兩cos共2ft ⫹ Ar⫺ r兲
⫹ 2兩␣r兩兩Br兩cos共2ft ⫹ ␣r⫺ Br兲
⫹ 2兩␣r兩兩r兩cos共2ft ⫹ ␣r⫺ r兲. (19)
Because both interfering beams共s and p polarization兲 propagate along the same optical path and they are influenced by the reflection from the beam splitter, we have兩Ar兩 ⫽ 兩Br兩, Ar ⫺ Br ⫽ ␣r ⫺ r ⫽ BS,
Ar⫽ ␣r,Br⫽ r, and兩Ar兩兾兩Br兩 ⫽ 兩␣r兩兾兩r兩.
Con-sequently Eq.共19兲 can be rewritten as
Ir⫽ 共兩Ar兩 ⫹ 兩␣r兩兲2⫹ 共兩Br兩 ⫹ 兩r兩兲2⫹ 2共兩Ar兩兩Br兩 ⫹ 兩Ar兩兩r兩
⫹ 兩␣r兩兩Br兩 ⫹ 兩␣r円円r兩兲cos共2ft ⫹ BS兲. (20)
Similarly, the intensity of the test signal is given as It⫽ 兩At兩2⫹ 兩Bt兩2⫹ 兩␣t兩2⫹ 兩t兩2
⫹ 2共兩At兩兩␣t兩 ⫹ 兩Bt兩兩t兩兲cos
⫹ 2兵关共兩At兩兩Bt兩 ⫹ 兩␣t兩兩t兩兲cos ⫹ 兩At兩兩t兩 ⫹ 兩Bt兩兩␣t兩兴2
⫹ 共兩At兩兩Bt兩 ⫺ 兩␣t兩兩t兩兲2sin2其1兾2cos共2ft ⫺ ⬘兲,
(21)
where
⬘ ⫽ tan⫺1
冋
共兩At兩兩Bt兩 ⫺ 兩␣t兩兩t兩兲sin 兩At兩兩t兩 ⫹ 兩Bt兩兩␣t兩 ⫹ 共兩At兩兩Bt兩 ⫹ 兩␣t兩兩t兩兲cos
册
, (22) and we obtain it by comparing the test signal 关Eq. 共21兲兴 with the reference signal 关Eq. 共22兲兴. Hence the polarization mixing error is
⌬m⫽ ⬘ ⫺ . (23)
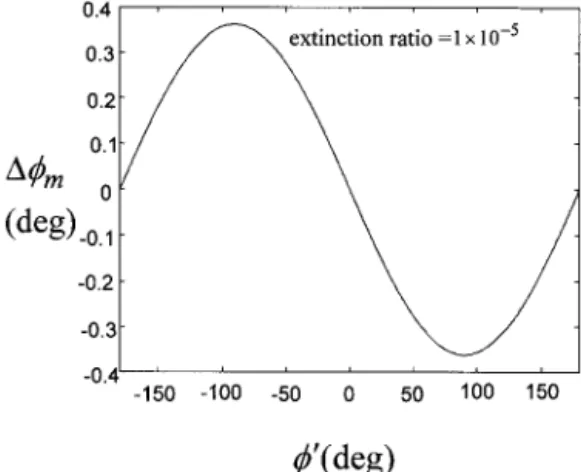
In our experiments, the extinction ratio of the polar-izer共Japan Sigma Koki, Ltd.兲 is 1 ⫻ 10⫺5, that is, 兩␣兩兾兩A兩 ⫽ 兩兩兾兩B兩 ⫽ 0.0032. Introducing these data into Eqs.共22兲 and 共23兲 results in the relation curve of ⌬m versus ⬘ depicted in Fig. 4. We obtain the
values of 1 and2in Table 1 by modifying the cor-responding values of ⬘ with the relation curves shown in Fig. 4. With this modification, the total error of the phase difference can be decreased to 0.03°.
Consequently we can obtain the curves of
measure-冋
ExEy
册
⫽冋
A exp共i2ft兾2兲 ⫹  exp共⫺i2ft兾2兲 B exp共⫺i2ft兾2兲 ⫹ ␣ exp共i2ft兾2兲
册
⫽冋
兩A兩exp共i2ft兾2 ⫹ iA兲 ⫹ 兩兩exp共⫺i2ft兾2 ⫹ i兲
兩B兩exp共⫺i2ft兾2 ⫹ iB兲 ⫹ 兩␣兩exp共i2ft兾2 ⫹ i␣兲
册
, (18)Fig. 3. ⌬rversus for several values of r. Fig. 4. ⌬mversus⬘ for a polarizer with the extinction ratio
ment resolution versus1for⌬n and ⌬k of nickel and copper at 2 ⫽ 80° by substituting 兩⌬1兩 ⫽ 兩⌬2兩 ⫽
0.03° into relations 共14兲 and 共15兲. The results are shown in Figs. 5共a兲 and 5共b兲, respectively. Obvi-ously, the best resolution can be obtained when1is
close to 60°. ⌬n and ⌬k corresponding to our exper-imental conditions were calculated and are included in Table 1.
To investigate the effects of experimental condi-tions on the measurements we depict in Fig. 6 the curves of constant n and k as functions of phase dif-ference for 1⫽ 60° and 2⫽ 80°. In the figure the
values of n and k are shown from 0.2 to 4.0 in steps of 0.2. According to Humphreys-Owen,4the
sensitiv-ity to the experimental conditions is indicated by the spacing between contours: If the spacing is large, the sensitivity is good and vice versa. It is obvious that our experimental conditions are useful if n and k are small. For good sensitivity, it is better to choose optimum incidence angles with the method proposed by Logofatu et al.19 Moreover, curves of constant n
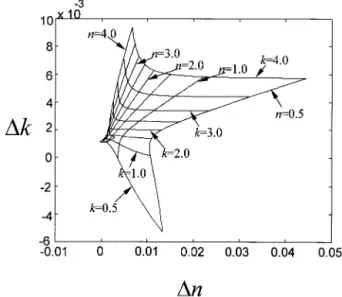
and k as functions of⌬n and ⌬k are shown in Fig. 7. We obtained them by substituting the experimental conditions 1 ⫽ 60°, 2 ⫽ 80°, and 兩⌬1兩 ⫽ 兩⌬2兩 ⫽
0.03° into relations 共14兲 and 共15兲. In Fig. 7 the val-ues of n and k are from 0.5 to 4 in steps of 0.5. It can be seen that both ⌬n and ⌬k are smaller than 1 ⫻ 10⫺2 for the test materials with n ⬎ 1 and k ⬍ 2. Furthermore, this method is highly stable against air turbulence because of its common path configuration.
5. Conclusion
Based on Fresnel’s equations and the use of hetero-dyne interferometry, we have developed a new method for measuring a complex refractive index. The phase difference between s and p polarization of the reflected light from an absorbing material is mea-sured with a heterodyne interferometer. Two phase differences, corresponding to two different incidence angles, are measured. These two phase differences are substituted into Fresnel’s equations to yield a set of simultaneous equations. Then the equations are solved by use of a personal computer by a numerical analysis technique, and the complex refractive index
Fig. 6. Constant n and k as functions of at 1⫽ 60° and 2⫽ 80°,
where the values of n and k are 0.2 to 4 in steps of 0.2.
Fig. 7. Constant n and k as functions of⌬n and ⌬k at 1⫽ 60° and
2⫽ 80°, where the values of n and k are 0.5 to 4 in steps of 0.5.
Fig. 5. Measurement resolution versus 1for⌬n and ⌬k of 共a兲
of the material can be estimated. The method has several merits, including a simple optical setup, easy operation, high stability, high measurement accu-racy, and rapid measurement. Its feasibility has been demonstrated.
This study was supposed in part by National Sci-ence Council Taiwan under contract NSC-87-2215-E-231-002.
References
1. E. D. Palik, Handbook of Optical Constants of Solids 共Academ-ic, New York, 1985兲, pp. 69–87.
2. I. Simon, “Spectroscopy in infrared by reflection and its use for highly absorbing substances,” J. Opt. Soc. Am. 41, 336 –345 共1951兲.
3. D. G. Avery, “An improved method for measurements of optical constants by reflection,” Proc. Phys. Soc. Landon Sect. B 65, 425– 428共1952兲.
4. S. P. F. Humphreys-Owen, “Comparison of reflection methods for measuring optical constants without polarimetric analysis, and proposal for new methods based the Brewster angle,” Proc. Phys. Soc. 5, 949 –957共1961兲.
5. W. R. Hunter, “Error in using the reflectance vs angle of inci-dence method for measuring optical constants,” J. Opt. Soc. Am. 55, 1197–1204共1965兲.
6. W. R. Hunter, “Optical constants of metals in the extreme ultraviolet. I. A modified critical-angle technique for mea-suring the index of refraction of metals in the extreme ultra-violet,” J. Appl. Phys. 34, 15–19共1964兲.
7. R. M. A. Azzam, “Simple and direct determination of complex refractive index and thickness of unsupported or embedded thin films by combined reflection and transmission ellipsom-etry at 45° angle of incidence,” J. Opt. Soc. Am. 73, 1080 –1082 共1983兲.
8. J. Lekner, “Determination of complex refractive index and thickness of a homogeneous layer by combined reflection and transmission ellipsometry,” J. Opt. Soc. Am. A 11, 2156 –2158 共1994兲.
9. G. D. Feke, D. P. Snow, R. D. Grober, P. J. De Groot, and L. Deck, “Interferometric back focal plane microellipsometry,” Appl. Opt. 37, 1796 –1802共1998兲.
10. M.-H. Chiu, J.-Y. Lee, and D.-C. Su, “Refractive-index mea-surement based on the effects of total internal reflection and the uses of heterodyne interferometry,” Appl. Opt. 36, 2936 – 2939共1997兲.
11. M. Born and E. Wolf, Principles of Optics, 6th ed.共Pergamon, Oxford, 1980兲, p. 40.
12. D. C. Su, M. H. Chiu, and C. D. Chen, “Simple two frequency laser,” Precis. Eng. 18, 161–163共1996兲.
13. M.-H. Chiu, C.-D. Chen, and D.-C. Su, “Method for determin-ing the fast axis and phase retardation of a wave plate,” J. Opt. Soc. Am. A 13, 1924 –1929共1996兲.
14. Ref. 1, pp. 285 and 323.
15. N. M. Oldham, J. A. Kramar, P. S. Hetrick, and E. C. Teague, “Electronic limitations in phase meter for heterodyne inter-ferometry,” Precis. Eng. 15, 173–179共1993兲.
16. J. M. De Freitas and M. A. Player, “Importance of rotational beam alignment in the generation of second harmonic errors in laser heterodyne interferometry,” Meas. Sci. Technol. 4, 1173– 1176共1993兲.
17. W. Hou and G. Wilkening, “Investigation and compensation of the nonlinearity of heterodyne interferometers,” Precis. Eng. 14, 91–98共1992兲.
18. A. E. Rosenbluth and N. Bobroff, “Optical sources of nonlin-earity in heterodyne interferometers,” Precis. Eng. 12, 7–11 共1990兲.
19. P. C. Logofatu, D. Apostol, V. Damian, and R. Tumbar, “Op-timum angles for determining the optical constants from re-flectivity measurements,” Meas. Sci. Technol. 7, 52–57共1996兲.