ELSEVIER Physica C 260 (1996) 86-92
PHYSICA
On the off stoichiometry of cerium oxide thin films deposited
by RF sputtering
C.C. Chin
a, *,1 R.J. Lin
9 b,1,Y.C. Yu c C.W. W a n g c, E.K. Lin c
9W.C. Tsai d, T.Y. Tseng d
a Institute of Astronomy and Astrophysics, Academia Sinica, Nankang, Taipei, Taiwan b Department of Material Science, National Tsing Hua University, HsinChu, Taiwan
c Institute of Physics, Academia Sinica, Nankang, Taipei, Taiwan
a Department of Electronic Engineering, National Chiao Tung University, HsinChu, Taiwan
Received 3 October 1995
Abstract
We have studied the stoichiometry of cerium oxide films deposited by RF sputtering as a function of deposition conditions using the resonant Rutherford backscattering method. We found that some films have an off-stoichiomelry of CeO r with y greater than 2.0. Such an off-stoichiometry cannot be due to a mixture of the known phases of bulk cerium oxide samples. Those thin samples may have either cerium vacancies or interstitial oxygen atomic impurities. We have tried to determine the valence of the cerium ions by measuring the X-ray photoemission.
1. Introduction
C e r i u m oxide C e O 2 thin films has been proved to be a g o o d buffer layer for the growth o f Y B a 2 C u 3 0 x thin films on sapphire and Si substrates [1-3]. The cerium oxide thin films have been grown b y v a c u u m evaporation [1], laser ablation [2] and sputtering [3]. Bulk cerium oxide samples were k n o w n to have several phases o f C e O 2 , C e 2 0 3 and even oxygen-de- ficient C e O y with 1.5 < y < 2.0 [4,5]. It is very l i k e l y that cerium oxide thin films m a y not be o f the stoichiometry o f C e O 2. H o w e v e r , to the best o f our
* Corresponding author. Correspondence should be directed to:
Chi-Chung Chin, Institute of Astronomy and Astrophysics, Academia Sinica, Nankang, Taipei, Taiwan.
l Also at Materials Research Laboratories, ITRI.
k n o w l e d g e , the dependence o f the stoichiometry o f c e r i u m oxide thin films on the deposition conditions have not b e e n studied in detail yet.
The familiar 160(ct,
O~)160
elastic nuclear reso- nance near 3.03 M e V offers an attractive sensitive m e a n o f extending the Rutherford backscattering (RBS) technique to probe the o x y g e n in oxides. The resonant RBS cross-sections are as much as 25 times greater than the RBS cross-sections. This m e t h o d is very suitable to probe the light o x y g e n atoms among the h e a v y cerium atoms. In this paper, we have used the resonant RBS m e t h o d to determine the o x y g e n contents o f the cerium oxide thin films grown b y R F sputtering as a function o f sputtering conditions. W e found that some samples have an off-stoichiometry o f CeOy with y > 2.0. The stoichiometry depends on the sputtering conditions. The ratios o f the o x y g e n atoms to cerium atoms, y are equal to or less than 0921-4534/96/$15.00 © 1996 Elsevier Science B.V. All rights reservedC.C. Chin et aL / Physica C 260 (1996) 86-92 87 2.0 for all the k n o w n phases o f b u l k c e r i u m oxides.
Therefore such an off-stoichiometry cannot be due to the mixture o f the k n o w n phases o f b u l k samples. Those thin films with y > 2.0 m a y be either cerium deficient or o x y g e n overdosed. Furthermore, to un- derstand w h y y is greater than 2.0, we have tried to determine the valences o f the c e r i u m ions b y measur- ing the X - r a y p h o t o e m i s s i o n spectroscopy (XPS) o f some selected samples. The lattice spacings as a function o f the values o f y are also studied b y X-ray diffraction (XRD).
2. E x p e r i m e n t a l
The CeOy films studied here were grown b y the on-axis r a d i o frequency (RF) magnetron sputtering method. The substrates used are either (1102) sap- phire or (100) M g O . To prove the universality o f our results, the samples were grown b y two different deposition chambers A and B and b y two different research groups. The sample names, deposition chambers, substrates, deposition temperature T d, o x y g e n - t o - a r g o n pressure ratio O 2 / A r , deposition pressure, orientation and the full width at the h a l f m a x i m u m o f the rocking curve o f the (200) peak A to o f the films deposited are s u m m a r i z e d in Table 1. ( A t o o f some s a m p l e s were m e a s u r e d at the (111) peak and were m a r k e d b y an asterisk.) The R F
p o w e r o f the chambers A and B is, respectively, 60 and 40 W . After deposition, the films were cooled to r o o m temperature in an atmospheric pressure and 50 Torr o x y g e n atmospheric pressure and 50 Torr oxy- gen atmosphere for chambers A and B, respectively. S o m e samples have pure (11 l ) or (200) orientations while m o s t o f them have m i x e d orientations o f (111) and (200). The A to o f the samples f r o m c h a m b e r A were m u c h larger than those o f the samples from chamber B e x c e p t s a m p l e A1018 which has pure (200) orientation.
To take the r a n d o m RBS spectra, the H e + ion b e a m was incident at the angles o f 3 to 5 degrees to the normal o f the film. S o m e measurements were repeated at different incident angles such that we could be sure to get the true r a n d o m spectra b y comparing the different spectra obtained. The detec- tor was set at a laboratory scattering angle o f 170 degrees. The respective Si and A u edges o f the r a n d o m spectra o f a quartz crystal and a g o l d thin film grown on glass were u s e d to calibrate the channel numbers to the corresponding energy o f the scattered H e + ions. The CeOy thin f i l m was covered b y a 5 - 1 0 n m thick A u l a y e r which was used to avoid charge up. C a m e r o n [6] has first reported the resonant energies, resonant cross-sections and reso- nant widths b e t w e e n the H e ions and o x y g e n atoms. Recently, Leavitt et al. [7] have m e a s u r e d accurately the resonant energies, the resonant widths, and the
Table 1
Summary of the sample names, deposition chambers, substrates, deposition temperature To, oxygen-to-argon pressure ratio O2/Ar, deposition pressure, orientation, the full width at the half maximum of the rocking curve of the (200) peak A to of the films and the stoichiometry deduced. (A to measured at the (111) peak was marked by an asterisk.)
Sample Deposition Substrate T d (°C) O2/Ar Deposition pressure Orientation A to (degree) Stoichiometry
chamber (mTorr) (111 )/(200)
A1020a A sapphire 720 5/100 30 15/85 4.67 Cel.oO2.0 ~ 2.2
A1020h A sapphire 720 25/100 30 9/91 2.68 C e l . 0 0 2 . 5
A1020c A sapphire 720 10/100 30 9/91 3.89 Cel.oO2.0 ~ 2.2
A1015 A sapphire 720 25/100 20 98.4/1.6 7.32 a Cel.0Ol. 8
A1018 A sapphire 720 5/100 15 0/100 0.59 Cel.003. 3
B0427 A MgO 700 25/100 15 11/89 2.74 C e l . 0 0 2 . 1
B0414 A MgO 750 25/100 15 47/53 3.76 C e l . 0 0 2 . 4
B0125 A MgO 720 25/100 15 2/98 1.57 Cel.002. 5
VAO B sapphire 600 100/100 60 100/0 0.31 a Cel.oO2.0~ 2.2
VA3S1 B sapphire 760 100/100 60 0/100 0.3 C e l . o O 3 . 3
VB314 B sapphire 650 100/100 100 91/9 0.71 Cel.oO2. 4
VB3 B sapphire 710 100/100 100 15/85 0.29 C e l . o O l . 9
88 C.C. Chin et a l . / Physica C 260 (1996) 86-92
resonant cross-sections. In this study, the enhanced resonant scattering cross-sections were calculated by the partial-wave method using the parameters deter- mined by Leavitt et al. [7]. The conventional RBS cross-sections between the He ions and oxygen atoms were replaced by the enhanced resonant cross-sec- tions in the computer program Gisa 3.91 [8] to fit the random RBS spectra. Rutherford cross-section with the correction of electron screening was used for the cerium atoms. The stoichiometry of the CeOy films was deduced from the fitting. The thickness of the thin-film samples is approximately 100 nm. The exact energy of the He + ions determined by the energy of the resonant oxygen peak was found to be 3.04 MeV. Therefore the resonance occurs near the surface of the films.
The XPS spectra were acquired by the V G Micro- lab MKIII system using the Mg Ktx X-ray radiation. The exposure time of the sample to the X-ray radia- tion for spectrum measurement was limited to a short period of 5 min to avoid radiation damage on the sample surface [9]. The orientations and the rocking curves of the films are measured by the standard XRD method.
3. Results
3.1. RBS
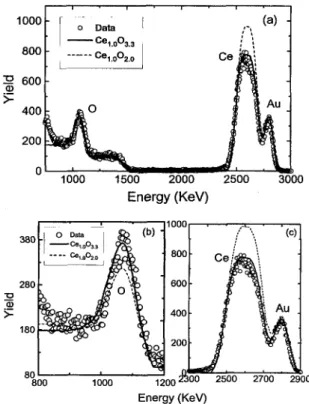
The fitting of the computer simulation to the random RBS spectrum of magnesium oxide substrate standard yields a stoichiometry of MgO as shown in Fig. 1. It serves as the calibration of our measure- ment procedures, enhanced oxygen cross-sections and the computer simulation. Figs. 2 and 3 show the examples of the measured random spectrum and the computer simulation of the samples A1020a and A1018, respectively. The computer simulation fits well to both the cerium and resonant oxygen peaks. The stoichiometry of sample A1020a was deter- mined to be Cel.002. 0 ~ 2.2 which was very closed to CeO 2. However, sample A1018 was found to be Cel.003. 3 which has either too much oxygen or not enough cerium. Figs. 3(b) and (c) show the details of the fitting to the oxygen and cerium peaks, respec- tively. For comparison, the computer simulation of the stoichiometry of Cel.002. 0 was also plotted as the
1000 0 800 "~"O 600 A 1 ~_ 400 200 M 500 ' l d 0 0 1500 ' 2d00 ' 25100 ' 3000
Energy (KEY)
Fig. 1. The random RBS spectrum of a MgO substrate. The solid line is the computer simulation fitting to the spectrum assuming a stoichiometry of MgO. The insert shows the details of the fitting
to the resonant oxygen peak.
dash line in Figs. 3(a), (b) and (c). The stoichiometry of all the samples obtained by the best fitting to the random spectrum were summarized in Table 1. Some samples have the stoichiometry o f CeOy with y > 2.0 while some do not.
We have studied the stoichiometry as a function of deposition conditions. The results show that the stoichiometry of cerium oxide thin film frustrated sensitively with T a, O 2 / A r ratio and deposition pres- sure.
Samples A1020a, A1020b, and A1020c were de- posited at a fixed temperature and pressure but with different oxygen partial pressures. Samples A1020a and A1020c have stoichiometry very near Cel.002. 0. However, sample A1020b which was deposited with the highest oxygen partial pressure has a stoichiome- try of Cei.002. 5. Increasing the oxygen partial pres- sure above a certain limit will increase the oxygen contents of the films.
Sample A1015 was deposited at the same sub- strate, T d and O 2 / A r ratio but at slightly lower total deposition pressure of sample A1020b. Sample A1015 has a stoichiometry with y less than 2.0. Slightly decreasing the deposition pressure "will change not only the stoichiometry but also change the orientation from mainly (200) to mainly (111). However, the only difference in deposition condi- tions of samples A1020a and A1018 was also depo- sition pressure but at a different fixed O : / A r ratios. On decreasing the deposition pressure, y of samples A1020a and A1018 increases from 2.0 to 3.3 which
C.C. Chin et a l . / Physica C 260 (1996) 86-92 89 2 0 0 0 1500
._~
>- lOOO
500 t
o'
i l o D a ~ ) CeI.o02.2 . . . 0el.o02. 0< .
1000 2 0 0 0Energy (KeV)
3 0 0 0Fig. 2. The random RBS spectrum of sample A1020a. The solid and dashed lines are the computer-simulation fitting to the spec- trum assuming a stoichiometry of CeLoO2. 2 and Cel.oO2. 0, re- spectively. Both lines fit quite well to the spectrum.
is the highest value observed so far. The orientation of the films does not change and is mainly (200) (samples A1020a and A1018) on decreasing the deposition pressure this time. The above studies show that the stoichiometry fustrates very sensitively with deposition pressure and O 2 / A r ratio.
Samples B0427, B0414 and B0125 were de- posited on the same substrate and under the same O 2 / A r ratio and deposition pressure but at different T d. At low T d of 700°C for sample B0427, y is equal to 2.1. On slightly increasing T a from 700 to 720 and 750°C, y increases to 2.5 and 2.4, respectively. The experiment was repeated using another substrate of sapphire, deposition chamber, and at higher deposi- tion pressure of 60 m Torr for samples VAO and VA3S1. Again on increasing the T a from 600 to 760°C, y increases from 2.0-2.2 to 3.3. However, samples VB314 and VB3 were deposited at a much higher deposition pressure of 100 m Ton'. At such a high pressure, y is equal to 2.4 (greater than 2.0) at the low Ta of 650°C. On increasing the T d to 710°C, y decreases to 1.9 which is very closed to 2. The high deposition pressure gives a value of y greater than 2 at the low T d of 650°C in contrast with the results at low deposition pressure discussed above. The value of y depends sensitively on Ta and deposi- tion pressure. Changing T d and deposition pressure change the kinetic energy of the oxygen and cerium ions during the sputtering pressure. It is believed that the kinetic energy of those ions should affect the stoichiometry of the films.
The above study shows that the stoichiometry and the orientation of the cerium oxide films are a com- plicated function of the substrate used, T d, O 2 / A r ratio and deposition pressure.
3.2. XPS
Fig. 4 shows an example of the cerium 3d XPS spectrum of sample A1015. The XPS spectra of all samples were analyzed by deconvolution fitting. The energy values and the relative areas of the peaks deduced as shown in Fig. 4 are summarized in Table 2 for all the thin-film samples as well as the standard CeO 2 powder. Refs. [9] and [10] give the energies of the peaks for CeO2:882.2 and 888.6 eV, while those of Ce203 are 884.4 and 880.6 eV. None of the energies of the peaks match those of CeO 2 or even Ce203 for the thin-film samples. No XPS spectrum
1000 800 -o 6 0 0 >- 4OO 20O 0 i i r o Data I Cel.oO3.3 i . . . C e 1 . 0 0 2 . o ~ 0 1000 1500 2000
Energy
(KEY) ,- (a)2500
3000
._~ >.. 3 8 9 " 0 Data 2 8 0 180 i 8 0 0 0 1000o 0 o l f ,c,
i 8 o o . ~ 6 0 0 400 200 1200 2~00 2500 2700 2900 Energy (KEY)Fig. 3. (a) The random RBS spectrum of sample A1018. The solid and dashed lines are the computer-simulation fitting to the spec- trum assuming a stoichiometry of Cel.oO3. 3 and Cel.oO/.o, re- spectively. The solid line fits well to the spectrum but the dashed line does not. (b) The details o f the fitting to the resonant oxygen peak. (c) The details of the fitting to the cerium peak.
90 C.C. Chin et al./Physica C 260 (1996) 86-92 2C 19 = o 18 ~'~ 17 16 ' • • ' I I I I 879 883 887 891 895 Binding Energy / eV
Fig. 4. The cerium 3d XPS spectrum of sample A1015.
other than the stoichiometry of C e O 2 , C e 2 0 3 and reduced CeO 2 have been so far reported for compar- ison. (Reduced CeO 2 is a mixture of CeO z and Ce203.) We still cannot conclude to the valence of the cerium ion by XPS studies. However, it is the
first XPS studies in those films with stoichiometry of CeOy with y greater than 2. No clear correlation between the energy of the peaks and the stoichiome- try was observed either.
3.3. XRD
XRD shows that all the films studied have the CeO z phase with (200), (111) or mixed orientations. No impurity phase was observed. Table 3 summa- rizes the length of the lattice in the (200) and (111) directions. If the off-stoichiometry is due to the oxygen interstitial atoms or cerium vacancies, then the lattice spacing will be longer or shorter, respec- tively. We cannot find a direct relation of the lattice spacing with the value of y. Therefore, it may be
Table 2
Summary of the energy and the relative area of the peaks of the cerium 3d XPS spectra deduced by deconvolution
Sample C e l Ce2 Ce3
Energy (eV) Area Energy (eV) Area Energy (eV) Area
A 1020a 883.4 52% 887.6 38 % 890.3 A 1020b 883.8 34% 887.2 61% 891.5 A1020c 883.2 50% 887,4 50% - A 1018 882.4 59% 887.3 41% - A1015 883.5 65% 889.8 35% - B0427 884.3 62% 890.4 38% - B0125 883.4 60% 889.5 40% - CeO 2 882.2 64% 888.6 36% - powder 10% 5% Table 3
Summary of the values of y, and the length of the lattice spacing in the (200) and (111) directions for different samples. The data for CeO 2 powders are also given for reference
Sample Value of y (200) lattice spacing in nm (111) lattice spacing in nm
A 1020a 2.0-2.2 0.2714 0.3105 A 1020b 2.5 0.2709 0.3115 A1020c 2.0 0.2717 0.3118 A1015 1.8 0.2719 0.3106 A1018 3.3 0.2713 - B0427 2.1 0.2709 0.3092 B0414 2.4 0.2711 0.3097 B0125 2.5 0.2708 - VAO 2.0 - 0.3150 VA3S 1 3.3 0.2718 - VB314 2.4 0.2711 0.3141 VB3 1.9 0.2713 0.3147 CeO 2 2.0 0.2706 0.3123
C.C. Chin et al. / Physica C 260 (1996) 86-92 91
likely that both the cerium vacancies and oxygen interstitial atoms play a certain role in the off- stoichiometry depending on the deposition condi- tions.
4. Discussion
Is the off-stoichiometry with y greater than 2.0 due to surface roughness, any embedded impurity atoms, wrong input cross-sections, computer errors or even a channeling effect?
The height of the cerium and oxygen peaks of the random spectra can be affected by the roughness of the samples. The thin-film samples have very smooth surfaces with the peak to a valley roughness of 3 to 6 nm as observed by atomic force microscope. There- fore, the off-stoichiometry should not be due to
surface roughness.
The sample and target holders were made of either Fe or A1. Fe or A1 atoms may be sputtered into the films and then are oxidized to form oxide impu- rity phases which cause y to be greater than 2.0. No Fe or A1 impurity atom imbedded in the cerium oxide film was observed in any RBS spectra of the samples. Thus such an off-stoichiometry should not be due to any impurity Fe or A1 atoms imbedded in the films. No other impurity atom was observed in the RBS spectra. Furthermore, no impurity spectrum line was found in the XPS observation.
Although we have utilized the latest most accurate enhanced resonant oxygen cross-sections reported so far [7], any underestimation of the resonant oxygen cross-section can give a wrong result of y greater than 2. However, it should be noted that we can still deduce the cerium compositions and hence the oxy- gen contents of the samples by fitting only the height of the RBS spectrum of the peaks of the cerium sublattice and the A1203 or MgO substrates. Our computer simulation fits well to the cerium peaks. We have checked the formulation of calculating the cerium cross-section in the computer program Gisa 3.91 by fitting the non-resonant RBS spectrum of cerium oxide films reported in Ref. [1]. We get the same stoichiometry close to CeO2. 0 as reported in Ref. [1].
Furthermore, cerium was known to have several isotopes with nuclear mass of 136, 138, 140 and 142
of relative abundance of 0.0019, 0.0025, 0.8848 and 0.1107, respectively. Most of the isotopes have a nuclear mass of 140 and 142. The ratios of the Rutherford cross-sections and the kinematic factors of these two isotopes are, respectively, less than 0.005% and 0.16%. The difference in the cross-sec- tions is very small. The energy of the He ions scattered from these two isotopes should be within 5 keV which is much smaller than the resolution of the detector. Therefore, although we take as input the average Rutherford cross-section and average kine- matic factor for the cerium atoms in the computer simulation, the difference in the cross-sections and kinematic factors of the isotopes should not affect the results of the deduced stoichiometry of the sam- ples obtained by the computer simulation,
We have also double checked our computer simu- lation by analyzing again the spectra of some of our samples using the commercially available software, RUMP. The same compositions were obtained. Therefore, the off stoichiometry of CeOy with y > 2.0 should not be due to impurities, computer errors, wrong input cross sections or artifacts, if any.
Such an off-stoichiometry cannot be due to the channeling or partial channeling effect, if any oc- curred in the random spectra measurement for the following reasons. Firstly, although samples A1018, VA3S1, VB314 which have the stoichiometry with y > 2 have rather good crystallinity (small values of Ao~), samples A1020b, B0414 and B0125 have a very poor crystallinity. The rocking curves of those samples with poor crystallinity are very broad with- out any sharp peak embedded in the rocking curve observed. Therefore, the grains should not be well aligned. Channeling effect is impossible o n those samples with poor crystallinity. Secondly, if any partial channeling effect occurs, both the cerium and oxygen peaks will decrease and then the spectra cannot be fitted to the computer simulation which assumes complete random scattering of the He + ions. Even though if some how the partial channeling is mainly steered by the potential of the Ce sublat- tices, and therefore the height of the oxygen peaks do not decrease, the oxygen peak of our computer simulation should be higher than the experimental data because we had a higher oxygen concentration than it should be in our computer simulation. Thirdly, we have repeated the measurements at different inci-
92 C.C. Chin et a l . / Physica C 260 U996) 86-92
dent angles. We got the same spectra. This was not possible if a partial channeling effect occurred in any measurement. Lastly, if any channeling effect oc- curs, we may observe the surface peak or part of the surface peak in the spectrum on samples with high crystallinity.
5. Conclusion
We found that the stoichiometry of cerium oxide thin film frustrated sensitively with T d, O 2 / A r ratio and deposition pressure. Some cerium oxide films even have the off stoichiometry of CeOy with y > 2.0. Those thin films with such an off-stoichiometry cannot be a mixture of the known phases of the bulk samples. Chin and Morishita [11] have also observed that the oxygen contents of the a-axis YBa2Cu30 x oxide films deposited by RF sputtering depends on the deposition temperature. It may be a general phenomenon that the oxygen contents of oxide films deposited by RF sputtering depend on the deposition conditions.
Mansour et al. [12] and Neterfield [13] also re- ported the RBS observation of an excess oxygen-to- cerium ratio on the films deposited by oxygen ion- assisted electron-beam evaporation when the current density of oxygen ion was larger than a critical level. Cerium dioxide was evaporated by the electron beam onto an unheated substrate which was irradiated by an oxygen ion beam. They gave the interpretation that the off-stoichiometry was due to the oxygen-ion implantation into the films. The growth mechanism of the films deposited by sputtering is quite different from that of the ion-assisted e beam. The films were grown at a high temperature about 600°C. It is possible that excess oxygen ions are implanted into the films during the sputtering process. However, it is not clear whether the off-stoichiometry with y > 2 is due to cerium vacancies or interstitial oxygen atoms. Future transmission electron microscopy study may help us to answer this question. Unfortunately,
XPS studies cannot determine the valence of the cerium ion in those samples but we have given the first data of the XPS on those off-stoichiometric thin films with y greater than 2. XRD shows that there is no direct relationship between the lattice spacings and the values of y. It may show that both the cerium vacancies and interstitial oxygen atoms may play a role in the off stoichiometry depending on the deposition conditions.
Acknowledgement
We gratefully thank I. Sarrilahti for allowing us to use the computer program Gisa written by him, and Y.C. Chen for his help in gold evaporation.
References
[1] T. Inoue, Y. Yamamoto, S. Koyama, S. Suzuki and Y. Ueda, Appl. Phys. Lett. 56 (1990) 1332.
[2] X.D. Wu, S.R. Foltyn, R.E. Muenchausen, D.W. Cooke, A. Pique, D. Kalokitis, V. Pendrick and E. Belohoubek, J. Supercond. 5 (1992) 353.
[3] F. Wang and R. Wbrdenweber, Thin Solid Films 227 (1993) 200.
[4] R. Korner, M. Ricken and J. Nolting, J. Solid State Chem. 78 (1989) 136.
[5] O. Toft Sorensen, J. Solid State Chem. 18 (1976) 217. [6] J.R. Carmeron, Phys Rev. 90 (1953) 839.
[7] J.A. Leavitt, L.C. Jr. Mclntyre, M.D. Ashbaugh, J.G. Oder, Z. Lin and B. Dezfouly-Arjomandy, Nucl. Instr. and Meth. B 44 (1990) 260.
[8] I. Saarilahti and E. Rauhala, Nucl. Instr. and Meth. B 46 (1992) 734.
[9] E. Paparazzo, G.M. Ingo and N. Zacchetti, J. Vac. Sci. Technol. A 9 (1991) 1416.
[10] M.L. Trudeau, A. Tschope and J.Y. Ying, Surface and Interface Analysis 23 (1995) 219.
[11] C.C. Chin and T. Morishita, Physica C 243 (1995) 373. [12] S. Mansour Al-Robaee, M. Ghanashyam Krishna, K.
Narasimha Rao and S. Mohan, J. Vac. Sci. Technol. A 9 (1991) 3048.
[13] P.R. Netterfield, W.G. Sainty, P.J. Martin and S.H. Sie, Appl. Optics 14 (1985) 2267.