科技部補助專題研究計畫成果報告
期末報告
核糖核酸測序實驗資料的維度縮減在基因集分析的運用
計 畫 類 別 : 個別型計畫 計 畫 編 號 : NSC 102-2118-M-004-006- 執 行 期 間 : 102 年 08 月 01 日至 103 年 07 月 31 日 執 行 單 位 : 國立政治大學統計學系 計 畫 主 持 人 : 薛慧敏 計畫參與人員: 碩士班研究生-兼任助理人員:蔡志旻 碩士班研究生-兼任助理人員:顏佑君 碩士班研究生-兼任助理人員:許義欣 博士班研究生-兼任助理人員:許斯淵 博士班研究生-兼任助理人員:梁穎誼 報 告 附 件 : 出席國際會議研究心得報告及發表論文 處 理 方 式 : 1.公開資訊:本計畫涉及專利或其他智慧財產權,2 年後可公開查詢 2.「本研究」是否已有嚴重損及公共利益之發現:否 3.「本報告」是否建議提供政府單位施政參考:否中 華 民 國 103 年 09 月 15 日
中 文 摘 要 : 特定基因集分析的目的為評估一組預先決定的基因集合與外 顯因子相關程度的顯著性。分析方法多是彙整基因集資料中 重要的資訊,以簡潔呈現與外顯因子的相關性。本計畫運用 適當的維度縮減方法在基因集資料的資訊彙整中,我們考慮 由 Cook 與 Weisberg 於 1991 年所提出的分段平均變異估計 法(Sliced average variance estimation, SAVE),該方法 已被證明在多元常態分配中有好的理論性質。後續則借由該 方法在估計維度程序所牽涉到的邊際維度檢定(marginal dimension test),以檢定基因集與外顯因子的顯著性。我們 設計一電腦模擬來驗證該方法。模擬的設定則參考兩種基因 實驗:微陣列實驗(microarray)與核糖核酸測序實驗(RNA-Seq)。 中文關鍵詞: 基因集分析,邊際維度檢定,充分段平均變異估計法,分維 度縮減。
英 文 摘 要 : Gene set analysis is to determine whether a
pre-specified gene set has a significant association with a phenotype. Usually, the data of the gene set are summarized to reveal the correlation between the set and the phenotypic response variable. The study
consider a sufficient dimension reduction in the data summarization for solid theoretical background. We apply the sliced average variance estimation proposed by Cook and Weisberg (1991). This method has been shown to have well performance under specific conditions. In the procedure, the dimension of the reduced data set is determined by a sequence of marginal dimension tests. It's known that the independence between the gene set and the response implies that the dimension is zero. We hence apply the zero-dimension test for the gene set analysis. Several simulations are conducted to validate the proposed method.
英文關鍵詞: Gene set analysis, marginal dimension test, sliced average variance estimation, sufficient dimension reduction
科技部補助專題研究計畫成果報告
(□期中進度報告/■期末報告)
核糖核酸測序實驗資料的維度縮減在基因集分析的運用
Dimension Reduction in the RNA-Seq Data: Application to the Gene
Set Analysis
計畫類別:■個別型計畫 □整合型計畫
計畫編號:NSC 102 - 2118 -M - 004 - 006 -
執行期間: 102 年 8 月 1 日至 103 年 7 月 31 日
執行機構及系所:國立政治大學統計系
計畫主持人:薛慧敏
共同主持人:
計畫參與人員:
本計畫除繳交成果報告外,另含下列出國報告,共 一 份:
□執行國際合作與移地研究心得報告
■出席國際學術會議心得報告
期末報告處理方式:
1. 公開方式:
□非列管計畫亦不具下列情形,立即公開查詢
■涉及專利或其他智慧財產權,□一年■二年後可公開查詢
2.「本研究」是否已有嚴重損及公共利益之發現:■否 □是
3.「本報告」是否建議提供政府單位施政參考 ■否 □是, (請列舉提
供之單位;本部不經審議,依勾選逕予轉送)
中 華 民 國 一 零 三 年 九 月 十 一 日
摘 要
特定基因集分析的目的為評估一組預先決定的基因集合與外顯因子相關程度的顯著性。 分析方法多是彙整基因集資料中重要的資訊,以簡潔呈現與外顯因子的相關性。本計畫運 用適當的維度縮減方法在基因集資料的資訊彙整中,我們考慮由 Cook 與 Weisberg 於 1991 年所提出的分段平均變異估計法(Sliced average variance estimation, SAVE),該方法已被證明 在多元常態分配中有好的理論性質。後續則借由該方法在估計維度程序所牽涉到的邊際維 度檢定(marginal dimension test),以檢定基因集與外顯因子的顯著性。我們設計一電腦模擬 來驗證該方法。模擬的設定則參考兩種基因實驗:微陣列實驗(microarray)與核糖核酸測序實 驗(RNA-Seq)。
Abstract
Gene set analysis is to determine whether a pre-specified gene set has a significant association with a phenotype. Usually, the data of the gene set are summarized to reveal the correlation between the set and the phenotypic response variable. The study consider a sufficient dimension reduction in the data summarization for solid theoretical background. We apply the sliced average variance estimation proposed by Cook and Weisberg (1991). This method has been shown to have well performance under specific conditions. In the procedure, the dimension of the reduced data set is determined by a sequence of marginal dimension tests. It’s known that the independence between the gene set and the response implies that the dimension is zero. We hence apply the zero-dimension test for the gene set analysis. Several simulations are conducted to validate the proposed method.
Keywords: Gene set analysis, marginal dimension test, sliced average variance estimation,
Background
To quantify the transcripts in a cell, the hybridization-based approaches, such as microarrays, have become prominent due to the fact that they are high throughput and cost less. On the other hand, although the traditional sequence-based approach can directly provide the cDNA sequence, it is of limited use because it is relatively less effective and expensive. Recently, the RNA-Seq experiment is developed for a high-throughput DNA sequencing method for mapping and quantifying the transcriptomes. The method improves the existing microarray approaches in terms of providing more accurate signals, being not limited to existing genomic sequence and requiring less RNA sample. The RNA-Seq is believed to replace microarrays when the sequencing cost reduces. Please see Wang, Gerstein and Snyder (2009) for a thorough description of the experiment.
The computation required in a statistical analysis of the data set from a genomic experiment is always a major concern. A suitable dimension reduction is useful in increasing the computational efficiency of an analysis. This study investigates the possibility of embedding a dimension reduction into a statistical procedure. In the past two decades, several dimension reduction for regression have been proposed. Most of them are based on the inverse regression. For example, the sliced inverse regression (SIR) and the method of principal Hessian directions (PHD) by Li (1991, 1992) are based on the inverse mean function, the sliced average variance estimation (SAVE) by Cook and Weisberg (1991), Cook (1998) and Cook and Lee (1999) are based on the inverse mean and inverse variance. The found subspace is shown belong to the minimal sufficient dimension reduction subspace for elliptically distributed predictors. Bura and Pfeiffer (2003) applied the two methods to develop a graphical method for classification problem with microarray data set. Dai et al. (2006) compared the performances of several dimension reduction methods in embedding in a classification procedure.
We focus on the gene-set analysis (GSA) in this study. The purpose of the GSA is to evaluate the association between the expression of biological pathways, or a priori defined gene sets, and a particular phenotype. Genes that serves a molecular function, a biological process, or a cellular component are annotated to the same term and grouped together into sets. The annotation terms can be obtained from libraries such as Gene Ontology (GO) or KEGG, BioCarta and Broad Institute.
According to the null hypothesis to test, Tian et al. (2005) and Goeman and Bühlmann (2007) classify the existing tests into two types: the competitive and self-contained tests. While the former ones determine whether the specific gene set is significantly differentially expressed compared to all other gene sets, the self-contained test is interested in the significance of the gene set alone. Previously many GSA tests for microarray data sets have proposed. See Goeman and Bühlmann
(2007), Gao et al. (2011) and Hsueh et al. (2012). However, so far, many developed methods are based on the first or second moment of the gene set. That is, limited information are subtracted from the whole data set.
In this study, we apply the SAVE in the GSA for a sufficient data subtraction. SAVE has been shown to have nice properties for multivariate normally distributed covariates. However, the gene expression level often has a more complex pattern. The adequacy of application of SAVE in the genomic data set is investigated in this study. In SAVE, the dimension of the reduced sufficient subspace is based a sequence of marginal dimension tests, proposed by Shao, Cook and Weisberg (2007). We find that if the gene set has no association with the phenotypic variable, then the subspace has zero dimension. Consequently, we propose to test the null hypothesis of zero dimension for assessment of the significance of the gene set. Although it has been shown that the test statistic has a chi-square distribution asymptotically, to ease the assumptions on both the population and the sample size, we use permutations to estimate the observed significance. We further conduct simulations to validate the proposed method.
Method
First, the sufficient dimension reduction and the sliced average variance estimation (SAVE) are introduced. Please refer to Cook and Weisberg (1991) and Cook (1998). Consider a regression problem. Suppose the px1 random vector, X, is the predictor and Y is the response variable. The aim of the statistical analysis is to explore P(Y|X). Consider a subspace of Rp, SB, along with the matrix B whose columns form a basis of the subspace. Then SB is called a dimension-reduction subspace for the regression of Y on X if P(Y|X, BTX) = P(Y|BTX). Under some mild condition, see Cook (1998), the intersection of all such spaces is a dimension reduction space. The intersection,
called the central space and denoted by SY|X, is the inferential object under parsimony principle.
Consider the standardized predictors, Z = ΣX−
1 2(X − µ
X.). Then if the columns of the matrix γ form a basis of SY|Z, the central space with respect to the standardized predictors, then the columns of ΣX1/2γ form a basis for SY|X. Hence, without loss of generality, the dimension reduction is conducted on the standardized data.
Denote the projection matrix of the basis γ as Pγ and Qγ=I-Pγ. Under the following linearity
condition,
E(Z|γTZ) = P γZ, and the following constant variance condition,
Var(Z|γTZ) = Q γ,
then the inverse mean function, E(Z|Y), and the inverse variance related function, Ip-Var(Z|Y), are included in the central subspace SY|Z. It’s shown that if X follows a multivariate normal distribution, then the two conditions hold. Assume a binary response Y, which is equal to zero for a non-diseased subject, is one for a diseased subject. Suppose
Z|Y = y~N(µy, Σy), y=0,1.
Cook and Lee (1999) showed that the inverse mean and inverse variance are functions of differences between the two conditional means and between the two conditional variances, ν = µ1− µ0, Δ = Σ1− Σ0. Consider M = (ν, Δ), then the SAVE subspace is the space spanned by M. The basis of the space can be found by the singular value decomposition of M.
When the population parameters are unknown, only a data set is available. The dimension reduction subspace is estimated by using the moment estimates, µ�1, µ�0, Σ�1, Σ�0, to replace µ1, µ0, Σ1, Σ0. Define the standardized predictors by Z�, further M� = (ν�, Δ�), with ν� = µ�1−µ�0, Δ� = Σ�1− Σ�0. Then the estimation of the basis of the SAVE subspace is found by the singular value decomposition of M�. However, in solving for the basis, the determination of the dimension of the subspace, denoted by d, is not trivial. A dimension test is suggested by conducting a serial of marginal dimension tests proposed by Shao, Cook and Weisberg (2007). Start from testing d=0 against d>0. If finding a significance, then next testing d=1 against d>1, and so on. Stop the test, whenever an insignificance of d=d0 is obtained. Then we infer d=d0. After the dimension reduction,
assume the obtained basis for SY|Z is γ�, and the d0× 1 reduced vector of predictor is W� = γ�TZ. Then the estimated sample means and covariance matrices of W are µ�W,y = γ�Tµ�y and Σ�W,y = γ�TΣ�
yγ�. Again denote the mean difference as ν�W = µ�W,1−µ�W,0.
In the gene set analysis (GSA), X is the list of the gene expression levels of a pre-specified set of genes. The phenotypic response variable, Y, can be of binary, categorical or continuous type. If X and Y are independent, then the dimension of the central space is zero. Further, the subspace found by SAVE, which is contained in the central subspace, has zero dimension. Consequently, we propose to test the specific null hypothesis
H0: d=0 VS H1:d>0
for assessment of the significance of the gene set. Under the circumstance, the marginal dimension (MD) test statistic has the following form: T = 𝑡𝑡𝑡𝑡�∑Hs=1 P� ( Is p− Σ�s )2�. The null hypothesis is rejected if T is sufficiently large. Shao, Cook and Weisberg (2007) showed that asymptotically T follows a central chi-square distribution under null hypothesis. However, due to the fact that a genomic data often has limited sample size, we adapt the permutation method to produce the observed significance.
Numerical Results
We conduct two simulations to simulate the data from two different genomic experiments. For microarray study, the gene intensity is relatively continuous. Multivariate normality is sometimes assumed for the gene expression data set. Our first study generates the data from a multivariate normal distribution. Consider a binary response. Every group has 10 subjects. Assume the gene set has 100 genes, which are classify into 3 disjoint groups. Within the first two groups, the gene expressions are pairwise correlated with correlation ρ. However, the genes in the third group are independent. The genes between the groups are independent. The p-value of a data set is found from 500 permutations. Moreover, the rejection proportion from 1000 repetitions at significance level α=5% is calculated for the empirical type I error rate and power.
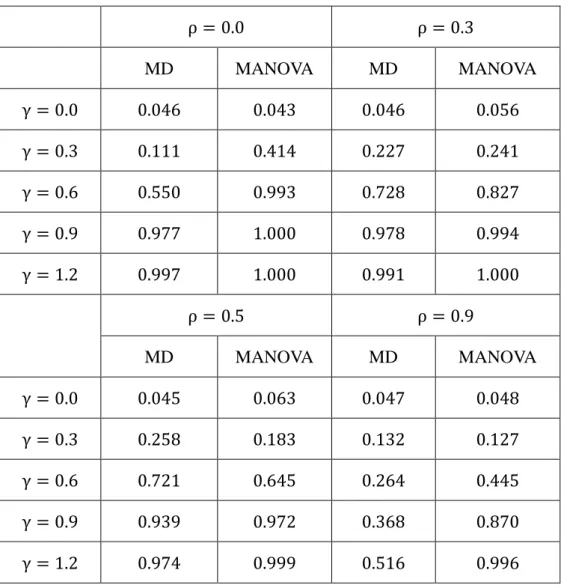
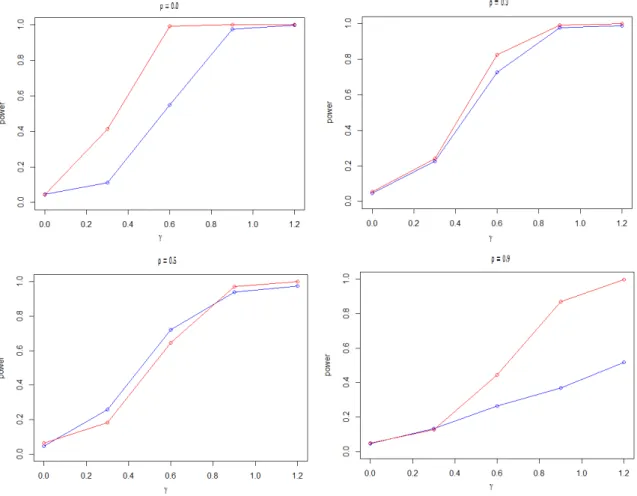
In the first study, the genes of the gene set have mean difference across the two response groups. The parameter γ reflects the magnitude of the difference. Table 1 and Figure 1 show the numerical
results. It can be found that the MANOVA test has better performance in detecting the mean difference.
Table 1. Empirical type I error rate and the power of the proposed MD method and MANOVA test when there is difference in mean expression.
ρ = 0.0 ρ = 0.3 MD MANOVA MD MANOVA γ = 0.0 0.046 0.043 0.046 0.056 γ = 0.3 0.111 0.414 0.227 0.241 γ = 0.6 0.550 0.993 0.728 0.827 γ = 0.9 0.977 1.000 0.978 0.994 γ = 1.2 0.997 1.000 0.991 1.000 ρ = 0.5 ρ = 0.9 MD MANOVA MD MANOVA γ = 0.0 0.045 0.063 0.047 0.048 γ = 0.3 0.258 0.183 0.132 0.127 γ = 0.6 0.721 0.645 0.264 0.445 γ = 0.9 0.939 0.972 0.368 0.870 γ = 1.2 0.974 0.999 0.516 0.996
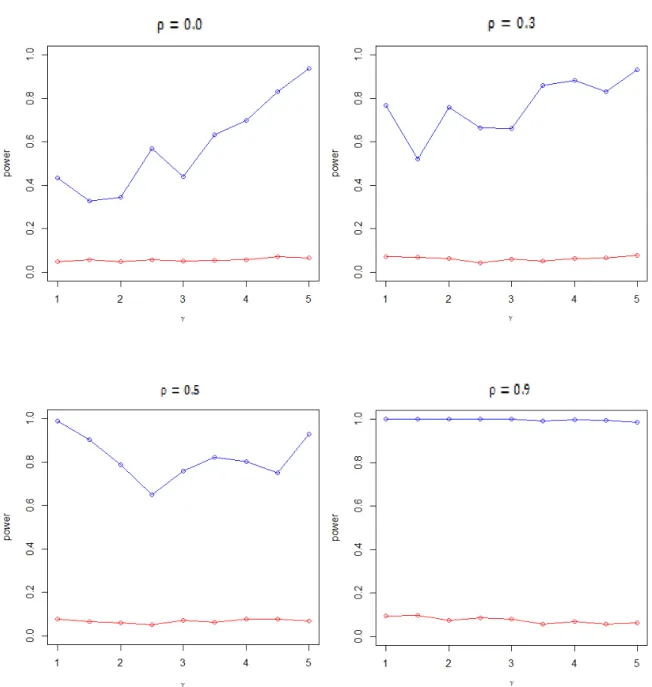
Secondly, the genes of the two response groups have different variations. From the following power curve, it is obvious that the MANOVA lack of power in detecting the variation difference. In contrast, the proposed MD method is more powerful.
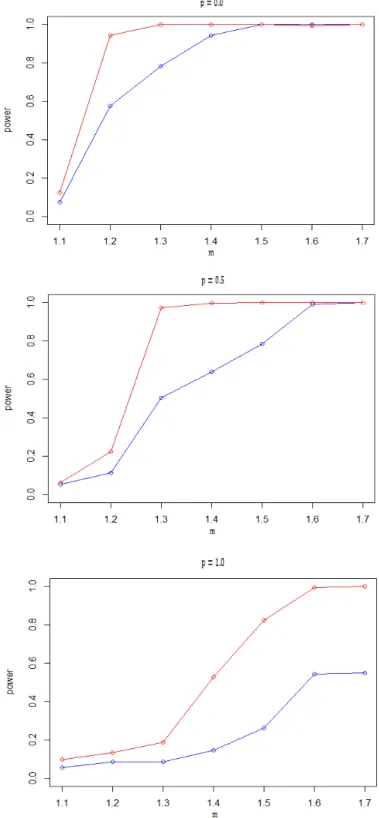
To study our method for the data set from a RNA-Seq experiment, we generate the gene expressions from a Poisson distribution. The simulation setup follows the study of Auer and Doerge (2012). The power curves of the MD test are plotted in Figure 3, in which, γ is the proportion of differentially expressed genes in the gene set; p is the proportion of over-dispersed genes.
Figure 3. The power curves of MD test. The blue line is γ=0.1, the red line isγ=0.2. The upper, middle and the bottom panel are corresponding to p=0, 0.5 and 1, respectively.
Concluding Remarks
From the numerical results, it can be seen that the MD method can detect both the difference in the first and second moments of the gene expression. Adapting the permutations for the observed significance, the method seems to have satisfactory performance in normal or non-normal distributed data.
Reference
Auer, P.L. and Doerge, R.W. (2011) A Two-Stage Poisson Model for Testing RNA-Seq Data.
Statistical Applications in Genetics and Molecular Biology, 10, 1.
Bura, E. and Pfeiffer, R. M. (2003) Graphical methods for class prediction using dimension reduction techniques on DNA microarray data. Bioinformatics, 19, 1252-1258/
Cook, R. D. (1998) Regression Graphics, Ideas for Studying Regressions through Graphics, New York: Wiley.
Cook, R. D. and Lee, H. (1999) Dimension-reduction in binary response. Journal of the American
Statistical Association, 94, 1187-1200.
Cook, R. D. and Weisberg, S. (1991) Discussion of “Sliced inverse regression” by K. C. Li, Journal
of the American Statistical Association, 86, 328-332.
Dai, J. J., Lieu, L. and Rocke, D. (2006) Dimension reduction for classification with gene expression microarray data. Statistical Applications in Genetics and Molecular Biology, 5, Article 6.
Gao, L., Fang, Z., Zhang, K., Zhi, D. and Cui, X. (2011) Length bias correction for RNA-seq data in gene set analyses. Bioinformatics, 27, 662-669.
Goeman, J. J. and Bühlmann, P. (2007) Analyzing gene expression data in terms of gene sets methodological issues. Bioinformatics, 23, 980-987.
Hsu, M.-J., Chang, Y.-c. I. and Hsueh, H. M. (2012) “Significance-based Biomarker Selection for Medical Diagnosis using the Partial Area under the ROC Curve,” submitted.
Hsu, M.-J. and Hsueh, H.M. (2012) “The linear combinations of biomarkers which maximize the partial area under the ROC curves,” to appear in Computational Statistics.
Hsueh, H.-M., Zhou, D.-W. and Tsai, C.-A. (2012) Random forests-based differential analysis of gene sets for gene expression data. Genes, accepted.
Karlis, D.and Meligkitsidou, L. (2005) Multivariate Poisson regression with covariance structure.
Statistics and Computing, 15, 255-265.
Li, K. C. (1991) Sliced inverse regression for dimension reduction. Journal of American Statistical
Association, 86, 316-342.
Li, K. C. (1992) On principal hessian directions for data visualization and dimension reduction: Another application of Stein’s lemma. Journal of the American Statistical Association, 87, 1025-1039.
Li, J., Witten, D. M., Johnstone, I. M. and Tibshirani, R. (2012) Normalization, testing, and false discovery rate estimation for RNA-sequencing data. Biostatistics, 13, 523-538.
Robinson, M. D., McCarthy, D. J. and Smyth, G. K. (2010) edger: a Bioconductor package for differential expression analysis of digital gene expression data. Bioinformatics, 26, 139-140. Robinson, M. D. and Smyth, G. K. (2007) Moderated statistical tests for assessing differences in tag abundance. Bioinformatics, 23, 2881-2887.
Robinson, M. D. and Smyth, G. K. (2008) Small-sample estimation of negative binomial dispersion, with applications to SAGE data. Biostatistics, 9, 321-332.
Shao, Y., Cook, R. D. and Weisberg, S. (2007) Marginal tests with sliced average variance estimation. Biometrika, 94, 285-296.
Tian, L., Greenberg, S. A., Kong, S. W., Altschuler, J., Kohane, I. S. and Park, P. J. (2005) Discovering statistically significant pathways in expression profiling studies. Proc. Natl Acad. Sci.,
102, 13544-13549.
Wang, Z., Gerstein, M. and Snyder, M. (2009) RNA-Seq: a revolutionary tool for transcriptomics.
Nature Reviews Genetics, 10(1), 57-63.
徐碩亨 (2013) 《充分維度縮減於整體性檢定之應用》國立政治大學統計研究所碩士論文, 未出版,台北市。
科技部補助專題研究計畫出席國際學術會議心得報告
日期:103 年 9 月 12 日一、參加會議經過
本次接受中央研究院統計研究所張源俊研究員邀請,至第九屆泛華統計協
會國 際會議講述最近的演講成果。
二、與會心得
此次參加會議,有機會與國際學者專家交換最新研究心得,了解最新研究成果,
收穫豐富。
三、發表論文全文或摘要
A biomarker is usually used as a diagnostic or assessment tool in medical
research. In the presence of multiple biomarkers, we propose stepwise selection
procedures to identify those biomarkers of statistical significance. In the procedures,
a biomarker is assessed under the criterion of the partial area under the ROC curve
計畫編號
MOST 102 - 2118 -M - 004 - 006 -
計畫名稱
核糖核酸測序實驗資料的維度縮減在基因集分析的運用
出國人員
姓名
薛 慧 敏
服務機構
及職稱
國立政治大學統計系副教授
會議時間
102 年 12 月 20 日
至
102 年 12 月 23 日
會議地點
香 港
會議名稱
(中文) 第九屆泛華統計協會國際會議
(英文) The 9th ICSA International Conference
發表題目
(中文) 運用操作者特徵函數部分線下面積以選取重要生物標記
(pAUC). Numerical studies are conducted to evaluate the proposed methods for data
sets with a moderate number of biomarkers. In addition, the analytical results of
several real examples are performed for illustration.
四、建議
無。
五、攜回資料名稱及內容
大會議程與論文摘要。
六、其他
無。
科技部補助計畫衍生研發成果推廣資料表
日期:2014/09/15科技部補助計畫
計畫名稱: 核糖核酸測序實驗資料的維度縮減在基因集分析的運用 計畫主持人: 薛慧敏 計畫編號: 102-2118-M-004-006- 學門領域: 生物統計無研發成果推廣資料
102 年度專題研究計畫研究成果彙整表
計畫主持人:薛慧敏 計畫編號: 102-2118-M-004-006-計畫名稱:核糖核酸測序實驗資料的維度縮減在基因集分析的運用 量化 成果項目 實際已達成 數(被接受 或已發表) 預期總達成 數(含實際已 達成數) 本計畫實 際貢獻百 分比 單位 備 註 ( 質 化 說 明:如 數 個 計 畫 共 同 成 果、成 果 列 為 該 期 刊 之 封 面 故 事 ... 等) 期刊論文 0 0 100% 研究報告/技術報告 1 0 100% 研討會論文 0 0 100% 篇 論文著作 專書 0 0 100% 申請中件數 0 0 100% 專利 已獲得件數 0 0 100% 件 件數 0 0 100% 件 技術移轉 權利金 0 0 100% 千元 碩士生 0 0 100% 博士生 0 0 100% 博士後研究員 0 0 100% 國內 參與計畫人力 (本國籍) 專任助理 0 0 100% 人次 期刊論文 0 1 100% 研究報告/技術報告 0 0 100% 研討會論文 1 1 100% 篇 論文著作 專書 0 0 100% 章/本 申請中件數 0 0 100% 專利 已獲得件數 0 0 100% 件 件數 0 0 100% 件 技術移轉 權利金 0 0 100% 千元 碩士生 0 0 100% 博士生 0 0 100% 博士後研究員 0 0 100% 國外 參與計畫人力 (外國籍) 專任助理 0 0 100% 人次其他成果