行政院國家科學委員會專題研究計畫 成果報告
以核磁共振乳房影像模擬乳房非線性變形壓縮:計算乳房密
度
研究成果報告(精簡版)
計 畫 類 別 : 個別型
計 畫 編 號 : NSC 98-2221-E-039-009-
執 行 期 間 : 98 年 08 月 01 日至 99 年 07 月 31 日
執 行 單 位 : 中國醫藥大學生物醫學影像暨放射科學學系
計 畫 主 持 人 : 施子卿
共 同 主 持 人 : 陳中和、何永仁
計畫參與人員: 此計畫無其他參與人員
報 告 附 件 : 出席國際會議研究心得報告及發表論文
處 理 方 式 : 本計畫可公開查詢
中 華 民 國 99 年 10 月 23 日
計畫類別:■個別型計畫 □整合型計畫
計畫編號:NSC 98-2221-E-039 -009
執行期間: 98 年 8 月 1 日至 99 年 7 月 31 日
執行機構及系所:中國醫藥大學
生物醫學影像暨放射科學學系
計畫主持人:施子卿
共同主持人:陳中和、何永和、蘇敏瑩
報告目錄
成果報告封面 P2
報告內容 P3
參考文獻 P9
成果報告及計畫成果自評表 P13
出席國際學術會議心得報告 P15
行政院國家科學委員會補助專題研究計畫
■成果報告
□期中進度報告
(計畫名稱)
以核磁共振乳房影像模擬乳房非線性變形壓縮
:計算乳房密度
Computational Simulation of Breast Compression
Based on Non-Linear Deformation by Using Magnetic
Resonance Images: to Measure Breast Density
計畫類別:■個別型計畫 □整合型計畫
計畫編號:NSC 98-2221-E-039 -009
執行期間: 98 年 8 月 1 日至 99 年 7 月 31 日
執行機構及系所:中國醫藥大學 生物醫學影像暨放射科學學系
計畫主持人:施子卿
共同主持人:陳中和、何永和、蘇敏瑩
計畫參與人員:
成果報告類型(依經費核定清單規定繳交):■精簡報告 □完整報告
本計畫除繳交成果報告外,另須繳交以下出國心得報告:
□赴國外出差或研習心得報告
□赴大陸地區出差或研習心得報告
■出席國際學術會議心得報告
□國際合作研究計畫國外研究報告
處理方式:
除列管計畫及下列情形者外,得立即公開查詢
□涉及專利或其他智慧財產權,□一年□二年後可公開查詢
中 華 民 國 99 年 10 月 23 日
I. Introduction
Mammographic density is a quantitative estimate of the proportion of fibroglandular tissue to the total breast area analyzed on mammograms. The fat and fibroglandular tissues are two major components of the breast. The fibroglandular tissue is denser than the fatty tissue, and therefore shows brighter intensity on mammograms; and as such the percentage of the dense tissues in the breast area can be measured based on the contrast shown in the mammogram, termed “mammographic density”. There is well-established evidence that a higher mammographic density is associated with an increased risk of breast cancer [1-4], thus the breast density may play an important role in the evaluation of cancer risk. Women with mammographic density greater than 50% have 3- to 5-fold higher breast cancer risk than those with less than 25% density [4-8].
Despite the established role of breast density as one of the strongest predictors of breast cancer risk, the progress to build the density into the risk assessment model has been relatively slow. That is in part due to the lack of reliable measurement methods. Visual estimation has been still commonly used in recent publications [11-15]. Quantitative measurements by planimetry, computer-assisted thresholding, and clustering segmentation methods [16] have been reported, yet whether they are reliable for measuring changes over time remains to be determined.
Even if a reliable method can be developed, another fundamental problem is the nature of projection images in mammography. The measured density may depend upon the projection angle, compression level, patient position, and x-ray intensity. Recently, Kopans (2008) indicated that the use of two-dimensional (2D) mammograms alone to assess the ratio of dense to fatty tissue in the breast is inaccurate for determining the volume ratios of the soft tissues, and suggested that an accurate breast density should be obtained from the three-dimensional (3D) data (i.e., volumetric measurement of breast density) [1]. However, the value of breast density measured by mammography is currently under debate [17]. Recently, there are some efforts to estimate density on mammograms considering the overlapping tissue along the projection direction. For example, Ding et al. (2008) developed “standard mammogram form (SMF)” to estimate the density volumetrically [18], but it was found that SMF is not better compared to the thresholding method for cancer risk prediction. The thresholding method, a computer-assisted technique that uses the gray scale in the digitized images, is to calculate the percent area of breast covered in dense regions or is to compute the number of pixels in dense area and total breast area (i.e., measuring breast density) for assessing the risk of breast cancer [19-21]. Furthermore, the stepwise rises in a breast cancer risk associated with higher density was measured by the thresholding method [18].
Therefore, the variations in the measured density by mammography warrant more research. To investigate this variation, the mammograms taken from the same woman using different positions, compression angles, and compression levels should be compared; however, since radiation is given to the woman, it is not ethical to perform such a study due to concern for excessive radiation exposure. Instead, a simulation model may be used to investigate the dependence of measured density on mammograms based on the 3D distribution of fatty and fibroglandular tissues within the breast measured by MRI. The first step for such a simulation model is to account for the effects of breast compression. In this work, we applied a nonlinear deformation model to estimate the displacement of tissues based on different elastic properties of fibroglandular and fatty tissues.
II. Methods
The MRI study was performed on a 1.5 T Eclipse scanner (Philips, Cleveland, OH) using a dedicated four-channel breast coil. The pre-contrast T1-weighted images without fat saturation were using a 3D SPGR (RF-FAST) pulse sequence, with TR=1.8 ms, TE=4.0 ms, slice thickness=4.0 mm, flip angle=20, matrix size=256256, FOV=380 mm. A total of thirty-two axial slices were used to cover the entire breast. Only normal breast was used for simulation. First, a computer-assisted algorithm was employed to segment the fatty and the fibroglandular tissues from MR images, based on the method reported in Nie et al. (2008) [22]. The breast was segmented from the body using the following procedures: (a) perform an initial V-shape cutting using three body landmarks to determine the posterior cutoff points of breast in the lateral boundary; (b) apply a fuzzy C-means (FCM) based segmentation algorithm(i.e., excluding air and lung tissue) with the B-spline curve fitting to obtain the breast boundary. Fuzzy C-means algorithm uses a fuzzy pixel classification to segment images [23-25]. The FCM clustering algorithm needs a priori information about the number of classes in the dataset [26-28]. The FCM clustering algorithm is also sensitive to the situation of the initialization and easy to fall into the local minimum or a saddle point while iterating. B-spline curve fitting is used to exclude chest wall muscle and dynamic searching to exclude skin. B-splines curve fitting is to compute a curve to a set of data points by basis function of a fixed order [29,30]. After the breast region is obtained, the fuzzy C-means clustering algorithm is applied for homogeneity correction and segmentation between the fibroglandular and fatty tissues. An example of the segmented breast region and the fibroglandular tissues from 32 imaging slices acquired from one patient is shown in Fig. 1.
Fig. 1. The segmented fatty tissue (white areas) and the fibroglandular tissue (red areas) using by the MRI-based segmentation method (Nie et al., 2008)[22].
In order to generate the volume mesh of the breast, the outside surface of the whole breast needs to be determined first. Currently available medical imaging software for 3D reconstruction treats objects as surface components, and this is done using triangulation of the surface [31-36]. The surface triangulation uses a set of triangular facets (i.e., triangular surface elements) of different sizes and shapes to cover the surface of an object. The surface of breast tissues were covered with triangular elements by the Avizo® 6.0 software package (Visage Imaging Inc., Carlsbad, California, USA), in which the Delaunay triangulation was employed to build topological structures from MR images. The MR image set had 32 slices with the corresponding voxel size of 1.481.484 mm3. The Avizo® 6.0 software package (Visage Imaging Inc., Carlsbad, California, USA) was used to create the 3D surface of the breast, as shown in Fig. 2.
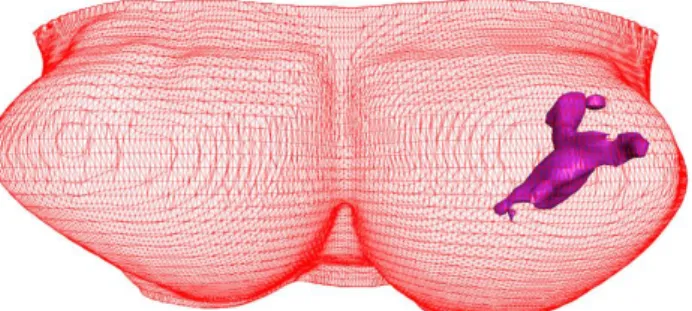
Fig. 2. The 3D surface of the whole breast and the fibroglandular tissues generated by using Avizo® 6.0 software package based on the segmentation results shown in Fig.1.
The 3D surface geometry of the fibroglandular tissue within the breast was also generated, as demonstrated in Fig. 3. The outside surface of the whole breast contained 56,098 points and 109,248 faces (i.e., triangular elements).
Fig. 3. The 3D surface generation of breast and fibroglandular tissues reconstructed by Avizo® 6.0 software to show coronal view (a, the front view from anterior to posterior), sagittal view (b, the side view from lateral to medial), and axial view (c, from superior to inferior).
II.C. Volume mesh generation
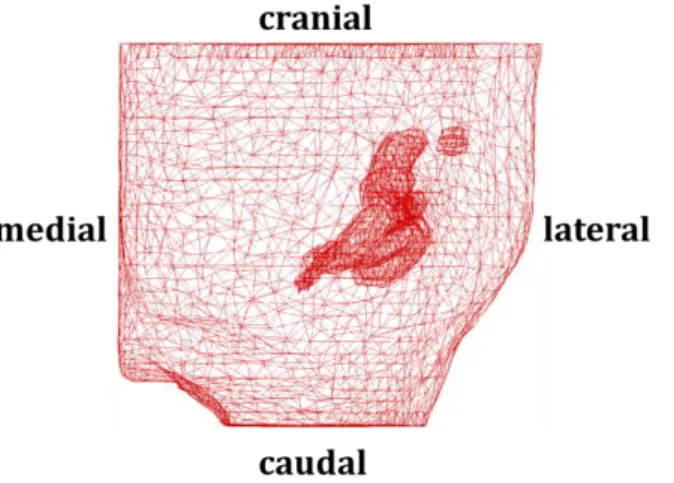
The finite element software package MSC.Marc® (MSC Software Corporation, Santa Ana, California, USA) was used to generate the volume mesh from the 3D surface geometry of the breast and the fibroglandular tissues, shown in Fig.2. The tetrahedral volume mesh with 4 nodes was defined as one element. The breast was meshed into 23,777
elements, 21,417 for the fatty tissue and 2,360 for the fibroglandular tissue. After the volume mesh is generated, this allows simulation of breast deformation using the finite element (FE) method when an external force is applied.
Fig. 4. The volume mesh of the left breast and the fibroglandular tissues generated by using the finite element software package MSC.Marc® . The mesh lines indicate the finite elements used.
II.D. Nonlinear breast compression
For most medical applications with small tissue deformation less than 5% strain, the linear elasticity model has been used commonly. Using atomic force microscopy and finite element modeling, Kang et al. demonstrated changes in the hyperelastic properties of endothelial cells induced by tumor necrosis factor- [37]. Since the deformation of breast compression in mammography is much larger (i.e. over 5%), the nonlinear elastic model was employed [38-40]. The hyperelastic mode is the Mooney-Rivlin nonlinear elastic model to describe the constitutive law for large deformation of the soft tissue [41-43]. We implemented the hyperelastic model to simulate the deformation. The hyperelastic materials have a very small compressibility. It also can endure large elastic strain that is recoverable. A strain energy density function for quasi-incompressible hyperelastic materials in terms of the strain invariants is defined in Eq. (1). For the Moony-Rivilin materials, the strain-energy density function can be described as the simplest rational polynomial representation (Horgan, 2009) [44, 45]. The constitutive model reflects slight deviations from incompressibility on assuming that the material is homogeneous, isotropic and hyperelastic [44,45]. The strain energy density function is expressed using the polynomial constitutive model as follows
N j i j i i jI
I
C
1 2 13
3
(1) whe 2 3 2 2 2 1 1
I
and 21 2 3 2 3 2 2 2 2 2 1 2 I are strain invariants,
1,
2,
3are the eigenvalues of the stretchtensor, and N is the order of the polynomial. If N is set to 1, it represents the Mooney-Rivlin materials [46]. Based on the polynomial model, the measured strain energy coefficients of fatty and fibroglandular tissues were summarized in the report proposed by Tanner et al. (2006) and Samani and Plewes (2004) [39, 40]. The Mooney-Rivlin material constants used in our simulation model were: (N =1,
C
01=1,333 Pa andC
10= 2,000 Pa) for fatty tissues, and (N =1,01
C
=2,333.3 Pa andC
10=3,500 Pa) fibroglandular tissues [47].In order to simulate the nonlinear elastic deformation of breast compression, we used the von Mises strain and tangential Young’s modulus for each iteration step in the MSC.Marc® finite element software solver. The deformation-dependent tangential Young’s modulus is given by
e e
d
d
E
(2)where
e and
e are the von Mises stress and strain, respectively. We also assumed all tissues are incompressible during deformation upon compression. Finally, we used the finite element software package MSC.Marc® to simulate breast compression at various compression ratios from 0 to 60%.II.E. Boundary conditions for breast compression
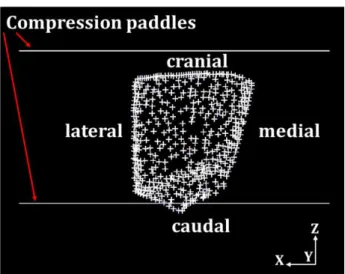
The planar compression paddle was set as a rigid body. Notice that the compression paddle must need to select a 3-D surface object in Contact Bodies item in MSC.Marc software package due to the breast compression is in a 3-D deformation (i.e., the contact between compression paddles and the breast surface is a 3-D touching). The friction contact between the paddle and the breast was assumed based on Coulomb’s friction law and the friction coefficient was set to 0.2 for both contact bodies. In this study, the compression direction was set as the z-direction in either CC or MLO compression. Since the posterior surface of the breast was sitting on the ribcage, it gave another constraint not allowing the nodes to move along the y-axis direction. There are a total of 454 nodes on this surface, and they can only slide within the x-z plane during the deformation under breast compression, as shown in Fig. 5.
Fig. 5. The fixed y-direction displacement on the posterior breast surface during compression as the boundary condition. The red crosses indicate the posterior nodes with fixed displacement in the y-axis direction.
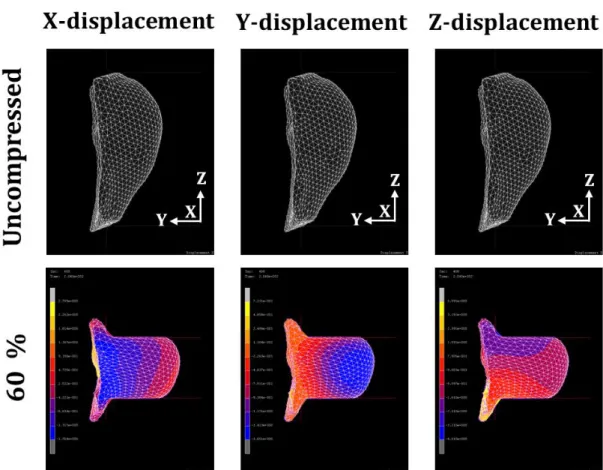
Figure 6 shows the deformations of the breast in the x-axis, y-axis, and z-axis directions at 60% compression ratios in CC compression. The moving velocity of the two paddles toward each other was set at 0.02 cm s-1, and the time step for each iteration was 0.5 sec. When the time reached 133 sec, each compression paddle moved 2.66 cm. The thickness of the breast before compression was 13.3 cm, hence the compression ratio was approximately 40% at this time point (2.662/13.3=0.4). The color-coding indicates the relative extent of displacements in three directions. The MSC.Marc® software detects the maximum and the minimum values of the displacement and equally divides the range into 10 levels indicated by different colors. Therefore the colors can only be used for evaluating relative changes. The maximum and minimum displacements from all nodes in the whole compression volume were obtained to indicate the degree of movement and summarized in Table I. For example, in Fig.6 at 60% compression ratio, the minimum and maximum displacements in the z-axis were -4.0 cm in negative z direction and 4.0 cm in the positive z direction, and the range of displacements was from -1.8 to 2.7 cm in the x-axis, and from -1.7 to 0.7 cm in the y-axis. While the compression paddles were moving along the z-axis direction, the posterior breast (i.e., the chest wall on ribcage) was fixed as the boundary condition; thus, the breast tissue was pushed away from the chest wall. The range of displacement variations in x-, y-, and z-axis directions at 20%, 40%, and 60% compression ratio are listed in Table I.
Fig. 6. The side view of the breast deformation before compression and at 60% CC view compression ratios. The relative displacements at x-, y-, and z-direction are shown by colors on the same sagittal view images. The range between the minimum and maximum displacement values are equally divided into 10 levels, shown by different colors. The blue and yellow color bars indicate the minimum and maximum values of displacements, which is -1.8 to 2.7 cm in x-axis, -1.7 to 0.7 cm in y-axis, and -4.0 to 4.0 cm in z-axis at 60% compression ratio. The displacements in the z-direction (the compression direction between the two paddles) is greater compared to x- and y- displacements.
IV. Conclusions
In this work we demonstrated our compression model and the simulation of tissue displacement by using two software packages, Avizo® 6.0 and MSC.Marc® . We need to further refine the model to mimic the way that a derived mammogram is taken. For example, for MLO view compression, we may also include the muscle in the analysis to match the typical MLO mammogram. Our simulation model may provide a suitable tool for analyzing the change of breast density at different compression situations to further understand the measurement variations due to technical factors that cannot be studied in humans. In order to achieve this goal, we will need to improve the spatial resolution of the compressed breast, and then to generate a derived mammogram based on the characteristic properties of x-ray sources and detectors.
V. References
[1] D. B.Kopans, “Basic physics and doubts about relationship between mammographyically determined tissue and breast cancer risk,” Radiology, 246:348-353, 2008.
[2] N. F.Boyd, H. Guo, L. J. Martin, et al., “Mammographic density and the risk and detection of breast cancer,” N. Engl.
J. Med., 356:227-236, 2007.
[3] L. J. Martin and N. F. Boyd, “Potential mechanisms of breast cancer risk associated with mammographic density: hypotheses based on epidemiological evidence,” Breast Cancer Res., 10:1-14, 2008.
[4] C. Byrne, “Invited commentary: assessing breast density change-lessons for future studies,” Am. J. Epidemiol., 167:1037-1040, 2008.
[5] J. N. Wolfe, A. F. Saftlas and M. Salane, “Mammographic parenchymal patterns and quantitative evaluation of mammographic densities: a case-control study,” Am. J. Roentgenol. 148:1087-1092, 1987.
[6] C. Byrne, C. Schairer, J. Wolfe, et al., “Mammographic features and breast cancer risk: effects with time, age, and menopause status,” J. Natl. Cancer Inst., 87:1622-1629, 1995.
[7] N. F. Boyd, G. A. Lockwood, J. W. Byng, et al., “Mammographic densities and breast cancer risk,” Cancer
Epidemiol. Biomarkers Prev., 7:1133-1144, 1998.
[8] N. F. Boyd, G. S. Dite, J. Stone, et al., “Heritability of mammographic density, a risk factor for breast cancer,” N.
Engl. J. Med., 347:886-894, 2002.
[9] J. A.Tice, S. R. Cummings, R. Smith-Bindman, et al., “Using clinical factors and mammographic breast density to estimate breast cancer risk: development and validation of a new predictive model,” Ann. Intern. Med., 148:337-347, 2008.
[10] K. Kerlikowske, L. Ichikawa, D. L. Miglioretti, et al., “Longitudinal measurement of clinical mammographic breast density to improve estimation of breast cancer risk,” J. Natl. Cancer Inst., 99:386-395, 2007.
[11] C. M. Vachon, C. H. van Gils, T. A. Sellers, et al., “Mammographic density, breast cancer risk and risk prediction,”
Breast Cancer Res., 9:217-225, 2008.
[12] C. M. Vachon, V. S. Pankratz, C. G. Scott, S. D. et al., “Longitudinal trends in mammographic percent density and breast cancer risk,” Cancer Epidemiol. Biomarkers Pre., 16:921-928, 2008.
[13] H. Johansson, S. Gandini, B. Bonanni, et al., “Relationships between circulating hormone levels, mammographic percent density and breast cancer risk factors in postmenopausal,” Breast Cancer Res. Treat., 108:57-67, 2008.
[14] J. Stone, G. S. Dite, A. Gunasekara, et al., “The heritability of mammographically dense and nondense breast tissue,” Cancer Epidemiol. Biomarkers Pre., 15: 612-617, 2006.
[15] J. J.Heine, M. J. Carston, C. G. Scott, et al., “An automated approach for estimation of breast density,” Cancer
Epidemiol, Biomarkers Prev., 17:3090-3097, 2008.
[16] C. K. Glide-Hurst, N. Duric and P. Littrup, “A new method for quantitative analysis of mammographic density,”
Med. Phys., 34:4491-4498, 2007.
[17] F. M. Hall, “Letters to the editor-Mammographically determined breast density and cancer risk,” Radiology, 248:1083, 2008.
[18] J. Ding, R. Warren, I. Warsi, et al., “Evaluating the effectiveness of using standard mammogram form to predict breast cancer risk: case-control study,” Cancer Epidemiol, Biomarkers Prev., 17:1074-1081, 2008.
[19]Byng, J. W., N. F. Boyd, E. Fishell, R. A. Jong, and M. J. Yaffe. The quantitative analysis of mammographic densities. Phys. Med. Biol. 39:1629-1638, 1994.
[20] J. W. Byng, M. J. Yaffe, R. A. Jong, et al., “Analysis of mammographic density and breast cancer risk from digitized mammograms,” Radiographics, 18:1587-1598, 1998.
[21] V. A. McCormack, R. Highnam, N. Perry, et al., “Comparison of a new and existing method of mammographic density measurement: intramethod reliability and associations with known risk factors,” Cancer Epidemiol. Biomarkers
Prev., 16:1148-1154, 2007.
[22] K. Nie, J. H. Chen, S. Chan, et al., “Development of a quantitative method for analysis of breast density based on three-dimensional breast MRI,” Med. Phys., 35:5253-5262, 2008.
[23] J. C. Bezdek, Pattern Recognition with Fuzzy Objective Function Algorithms Plenum, New York, 1981.
[24] A. D. Kulkarni, Fuzzy Logic Fundamentals in Computer Vision and Fuzzy-Neural Systems. Prentice-Hall, Englewood Cliffs, NJ, 61-101, 2001.
[25] W. Chen and M. L. Giger. “A fuzzy c-means (FCM) based algorithm for intensity inhomogeneity correction and segmentation of MR images,” IEEE International Symposium on Biomedical Imaging (ISBI): From Nano to Macro, 1307-1310, 2004.
Cybernetics and Systems, 3:32-57, 1973.
[27] M. N. Ahmed, S. M. Yamany, N. Mohamed, et al., “A modified fuzzy c-means algorithm for bias field estimation and segmentation of MRI data,” IEEE Trans. Med. Imaging, 21:193-199, 2002.
[28] J. C. Bezdek, “A convergence theorem for the fuzzy ISODATA clustering algorithms,” IEEE Pattern Analysis
Machine Intelligence, PAMI-2:1-8, 1980.
[29] H. Park and J. Lee, “B-spline curve fitting based on adaptive curve refinement using dominant point,”
Computer-Aided Design, 39:439-451, 2007.
[30] W. Wang, H. Pottmann, and Y. Liu, “Fitting B-spline curves to point clouds by curvature-based squared distance minimization,” ACM Transactions Graphics, 25:214-238, 2006.
[31] D. Kluess, R. Souffrant, W. Mittelmeier, et al., “A convenient approach for finite-element-analyses of orthopaedic implants in bone contact: Modeling and experimental validation,” Computer Methods and Programs in Biomedicine, 95:23-30, 2009.
[32] J. C. Cuillière, “An adaptive method for the automatic triangulation of 3D parametric surfaces,” Computer-Aided
Design, 30:139-149, 1998.
[33] M. Shi, Y. F. Zhang, H. T. Loh, et al., “Triangular mesh generation employing a boundary expansion technique,” Int.
J. Adv. Manuf. Technol., 30:54-60, 2006.
[34] J. R. Shewchuk, “Delaunay refinement algorithms for triangular mesh generation,” Computational Geometry, 22:21-74, 2002.
[35] D. Rypl and Z. Bittnar, “Triangulation of 3D surfaces reconstructed by interpolating subdivision,” Computers and
Structures, 82:2093-2103, 2004.
[36] J. D. Boissonnat, R. Chaine, P. Frey, et al., “From arteriographies to computational flow in secular aneurisms: the INRIA experience,” Med. Imag. Anal., 9:133-143, 2005.
[37] I. Kang, D. Panneerselvam, V. P. Panoskaltsis, et al., “Changes in the hyperelastic properties of endothelial cells induced by tumor necrosis factor-,” Biophys. J., 94:3273-3285, 2008.
[38] F. S. Azar, D. N. Metaxas and M. D. Schnall, “Methods for modeling and predicting mechanical deformations of the breast under external perturbations,” Med. Imag. Anal., 6:1-27, 2002.
[39] A. Samani and D. Plewes, “A method to measure the hyperelastic parameters of ex vivo breast tissue samples,”
Phys. Med. Biol., 49:4395-4405, 2004.
[40] C. Tanner, J. A. Schnabel, D. L. G. Hill, et al., “Factors influencing the accuracy of biomechanical breast models,”
Med. Phys., 33:1758-1769, 2006.
[41] R. S. Rivlin, “Large elastic deformations of isotropic materials .I. fundamental concepts,” Phil. Trans. R. Soc. Lond.
A., 240:459-490, 1948.
[42] H. M. Yin, L. Z. Sun, G. Wang, et al., “ImageParser: a tool for finite element generation from three-dimensional medical images,” BioMedical Eng. OnLine, 3:1-9, 2004.
[43] S. Sokhanvar, J. Dargahi and M. Packirisamy, “Hyperelastic modelling and parametric study of soft tissue embedded lump for MIS applications,” Int. J. Med. Robotics Computer Assisted Surgery, 4:232-241, 2008.
[44] C. O. Horgan and J. G. Murphy, “Compression tests and constitutive models for the slight compressibility of elastic rubber-like materials,” Int. J. Eng. Sci., 47:1232-1239, 2009.
[45] H. Bechir, L. Chevalier, M. Chaouche, et al., “Hyperelastic constitutive model for rubber-like materials based on the first Seth strain measures invariant,” European J. Mechanics A/Solid, 25:110-124, 2006.
Chichester, Wiley, New York, 1997.
[47] T. A. Krouskop, T. M. Wheeler, S. Garra, et al., “Elastic moduli of breast and prostate tissues under compression,”
國科會補助專題研究計畫成果報告自評表
請就研究內容與原計畫相符程度、達成預期目標情況、研究成果之學術或應用價
值(簡要敘述成果所代表之意義、價值、影響或進一步發展之可能性)
、是否適
合在學術期刊發表或申請專利、主要發現或其他有關價值等,作一綜合評估。
1. 請就研究內容與原計畫相符程度、達成預期目標情況作一綜合評估
■ 達成目標
□ 未達成目標(請說明,以
100 字為限)
□ 實驗失敗
□ 因故實驗中斷
□ 其他原因
說明:部分結果已發表在國際著名期刊
Physics in Medicine & Biology
T.C. Shih*, J.H. Chen, D. Liu, K. Nie, L. Sun, M. Lin, D. Chang, O. Nalcioglu,
and M.Y. Su, “Computational Simulation of Breast Compression Based on
Segmented Breast and Fibroglandular Tissues on Magnetic Resonance
Images,” Physics in Medicine and Biology, vol. 55, no.14, pp.4153-4168,
July, 2010. (國科會計畫編號 NSC 98-2221-E-039-009)
2. 研究成果在學術期刊發表或申請專利等情形:
論文:■已發表 □未發表之文稿 □撰寫中 □無
專利:□已獲得 □申請中 □無
技轉:□已技轉 □洽談中 □無
其他:
(以
100 字為限)
3. 請依學術成就、技術創新、社會影響等方面,評估研究成果之學術或應用價
值(簡要敘述成果所代表之意義、價值、影響或進一步發展之可能性)(以
500 字為限)
學術成就
:部分研究成果已發表在國際著名期刊 Physics in Medicine and
Biology, July,2010.
技術創新
:本研究使用核磁共振乳房影像模擬乳房非線性大變形壓縮二項技
術,是醫學影像與生物力學結合之技術創新。
社會影響
:乳房攝影是在早期診斷乳癌有效的診斷方式。乳房攝影所得的乳房
攝影緻密度(乳房密度)即是纖維腺體組織在全部乳房組織的比值,其亦是一
評估乳癌風險之重要標誌。新證據顯示乳房攝影緻密度高的女性會增加
4~5
倍乳癌風險的罹患率。乳房壓縮是乳房攝影必要的方式,乳房壓縮不僅減少
乳房攝影厚度亦可減少病人輻射劑量並改善影像。然而,乳房密度會隨者壓
縮角度、壓縮率、病人的姿態和位置、放射人員的技術品質而改變。即使是
同一個病人同一放射師,不同投影角度也可能穫得不同的乳房密度。由於,
乳房壓縮是大變形(通常超過 20%變形,非線性變形),本研究使用核磁共振
乳房影像模擬乳房非線性壓縮。結果顯示在壓縮方向的乳房組織位移變化比
其他兩個方向大。壓縮的組織厚度,
60%的壓縮比下,壓縮後乳房厚度約為
5-7 公分的範圍,這是典型的乳房 X 光檢查範圍。此研究提供一個有用的工
具的可靠性評估乳房密度方法可用於評估患乳腺癌的風險模型。
國科會補助專題研究計畫項下出席國際學術會議心得報告
日期:99 年 10 月 23 日一、參加會議經過
參加
2010/5/1~2010/5/7 瑞典斯德哥爾摩國際醫用磁振造影學會(ISMRM)2010
年會及
ESMRMB,SMRT 大會聯合會所主辦,國際醫用磁振造影學會(ISMRM)是每年
最重要的醫用磁振造影大型學術會議。這次舉辦在瑞典首都典斯德哥爾摩,可說不
管是在醫用磁振造影學術界或產業最重要的會議之一。本次會議共有來自世界各地
的國家超過六千位的教授、學者、研究人員及產業界代表等參與,約超過
5000 篇被
接受為壁報展示或口頭報告,內容遍及醫學物理師應了解磁振造影基本物理、磁振
造影在工程上的應用、在臨床試驗前的磁振造影癌症研究、腦連結的磁振造影評估、
心臟磁振造影的現況應用、臨床需求、及其技術發展、磁振造影工程、分子與細胞
計畫編號
NSC 98-2221-E-039-009
計畫名稱
以核磁共振乳房影像模擬乳房非線性變形壓縮
:計算乳房密度
Computational Simulation of Breast Compression Based on
Non-Linear Deformation by Using Magnetic Resonance Images: to
Measure Breast Density
出國人員
姓名
施子卿
服務機構
及職稱
中國醫藥大學
生物醫學影像暨放射科學學系
會議時間
99 年 5 月 1 日至
99 年 5 月 7 日
會議地點
瑞典斯德哥爾摩
會議名稱
(中文)第 19 屆國際磁振學會醫學學術會議暨展覽會
(英文) International Society for Magnetic Resonance in Medicine
19th Scientific Meeting & Exhibition
發表論文
題目
(中文)使用三維核磁共振乳房影像模擬乳房不同壓縮角度之投影乳房
密度
(英文) Quantitative Analysis of Projection Breast Density Changes
at Different Compression Angles Based on 3D MRI
影像、擴散和灌流磁振造影影像技術開發、磁振造影在臨床影像量化方法、高強度
超音波熱手術、高解析度振造影影像、新下一代腫瘤治療儀器與影像技術等…。為期
七天的會議中,超過
150 個研究主題研討會,非常豐富的研究內容,提供大家充分
的討論和交流的機會。
二、與會心得
參與國際會議瞭解磁振造影及癌症醫學影像目前最新的發展情況、本人之報告共
計二篇,所發表的題目分別 “Quantitative Analysis of Projection Breast Density
Changes at Different Compression Angles Based on 3D MRI” 及 “Correction of Skin
Volume in the Breast Density Measured by MRI”共二篇論文,能與在場的專家學者一
起討論,觀摩其他世界各地的實驗室的研究成果及研究方向,並分享彼此的研究內
容與經驗,並獲得磁振造影相關未來的研究方向,讓本人獲益良多。
三、考察參觀活動(無是項活動者略)
無。
四、建議
能參與國際會議並獲得能提供影像處理以及醫學兩大領域之專家學者互相交換研
究心得之機會難得,能激發跨領域深入的研究,跨領域的整合研究應是未來醫學的重
心,建議國科會能提供並鼓勵學者參與出席國際會議之機會。
五、攜回資料名稱及內容
1. ISMRM 會議議程,醫用磁振造影相關資料
2. 會議論文集【光碟】
六、其他
無。
出席國際學術會議心得報告
計劃編號
NSC 98-2221-E-039-009
計畫名稱
以核磁共振乳房影像模擬乳房非線性變形壓縮:計算乳房
密度
出國人員姓名
服務機關及職稱
施子卿
中國醫藥大學生物醫學影像暨放射科學學系
副教授
會議時間地點
2010/5/1~2010/5/7 瑞典斯德哥爾摩
會議名稱
International Society for Magnetic Resonance in Medicine
19
thScientific Meeting & Exhibition
發表論文題目
Quantitative Analysis of Projection Breast Density Changes
at Different Compression Angles Based on 3D MRI 及
Correction of Skin Volume in the Breast Density Measured
by MRI 共二篇論文
一、參加會議經過
參加2010/5/1~2010/5/7瑞典斯德哥爾摩國際醫用磁振造影學會(ISMRM)2010
年會及ESMRMB,SMRT大會聯合會所主辦,國際醫用磁振造影學會(ISMRM)是每
年最重要的醫用磁振造影大型學術會議。這次舉辦在瑞典首都典斯德哥爾摩,可
說不管是在醫用磁振造影學術界或產業最重要的會議之一。本次會議共有來自世
界各地的國家超過六千位的教授、學者、研究人員及產業界代表等參與,約超過
5000篇被接受為壁報展示或口頭報告,內容遍及醫學物理師應了解磁振造影基
本物理、磁振造影在工程上的應用、在臨床試驗前的磁振造影癌症研究、腦連結
的磁振造影評估、心臟磁振造影的現況應用、臨床需求、及其技術發展、磁振造
影工程、分子與細胞影像、擴散和灌流磁振造影影像技術開發、磁振造影在臨床
影像量化方法、高強度超音波熱手術、高解析度振造影影像、新下一代腫瘤治療
儀器與影像技術等…。為期七天的會議中,超過150個研究主題研討會,非常豐
富的研究內容,提供大家充分的討論和交流的機會。
二、與會心得
參與國際會議瞭解磁振造影及癌症醫學影像目前最新的發展情況、本人之報告共
計二篇,所發表的題目分別 “Quantitative Analysis of Projection Breast Density
Changes at Different Compression Angles Based on 3D MRI” 及 “Correction of
Skin Volume in the Breast Density Measured by MRI”共二篇論文,能與在場的專
家學者一起討論,觀摩其他世界各地的實驗室的研究成果及研究方向,並分享彼
此的研究內容與經驗,並獲得磁振造影相關未來的研究方向,讓本人獲益良多。
三、建議
能參與國際會議並獲得能提供影像處理以及醫學兩大領域之專家學者互相交換
研究心得之機會難得,能激發跨領域深入的研究,跨領域的整合研究應是未來醫
學的重心,建議國科會能提供並鼓勵學者參與出席國際會議之機會。
四、攜回資料名稱及內容
ISMRM會議議程,醫用磁振造影相關資料
會議論文集【光碟】
五、其他
無
98 年度專題研究計畫研究成果彙整表
計畫主持人:
施子卿
計畫編號:
98-2221-E-039-009-計畫名稱:
以核磁共振乳房影像模擬乳房非線性變形壓縮:計算乳房密度
量化
成果項目
實際已達 成數(被接 受或已發 表) 預期總達成 數(含實際 已達成數)本計畫
實際貢
獻百分
比
單位
備註
(質 化 說 明 : 如 數
個 計 畫 共 同 成 果、成 果
列 為 該 期 刊 之 封 面 故
事 ...等
)期刊論文
0
0
100%
研 究 報 告 / 技 術 報 告0
0
100%
研討會論文
1
0
100%
篇
T.C. Shih, K.C. Ju, H.L
Liu,
and
Y.J.
Ho, 'Three-Dimensional
Finite Element Modeling
of Breast Compression,'
2009
International
Symposium on Biomedical
Engineering
Combined
with
the
Annual
Scientific Meeting of
Biomedical Engineering
Society of R.O.C., p.
199, Taipei, Taiwan,
December 11-12, 2009.
論文著作
專書
0
0
100%
申請中件數
0
0
100%
專利
已獲得件數
0
0
100%
件
件數
0
0
100%
件
技術移轉
權利金
0
0
100%
千元
碩士生
0
0
100%
博士生
0
0
100%
博士後研究員
0
0
100%
國內
參與計畫人力
(本國籍)
專任助理
0
0
100%
人次
期刊論文
1
1
100%
T.C. Shih*, J.H. Chen, D.
Liu, K. Nie, L. Sun, M.
Lin,
D.
Chang,
O.
Nalcioglu,
and
M.Y.
Su,
'Computational
Simulation of Breast
Compression Based on
Segmented Breast and
Fibroglandular Tissues
on Magnetic Resonance
Images,' Physics in
Medicine and Biology,
vol.
55,
no.14,
pp.4153-4168,
July,
2010. ( 國 科 會 計 畫 編 號
NSC 98-2221-E-039-009)
研 究 報 告 / 技 術 報 告0
0
100%
國外
論文著作
研討會論文
2
2
100%
篇
1. T.C. Shih, J.H. Chen,
D. Chang, K. Nie, M. Lin,
O. Nalcioglu, and M.Y.L.
Su,
'Quantitative
Analysis of Projection
Breast Density Changes
at Different Compression
Angles Based on 3D MRI,'
International
Society
for Magnetic Resonance
in
Medicine
19th
Scientific
Meeting
& ; Exhibition,
#4511,
Stockholm,
Sweden, May 1-7, 2010.
( 國 科 會 計 畫 編 號 NSC
98-2221-E-039-001)
2. K. Nie, D. Chang, J.H.
Chen, T.C Shih, C.C. Hsu,
O. Nalcioglu, and M.Y. L.
Su, 'Correction of Skin
Volume in the Breast
Density Measured by MRI,
International
Society
for Magnetic Resonance
in
Medicine
19th
Scientific
Meeting
& ; Exhibition,
#5038,
Stockholm,
專書
0
0
100%
章/本
申請中件數
0
0
100%
專利
已獲得件數
0
0
100%
件
件數
0
0
100%
件
技術移轉
權利金
0
0
100%
千元
碩士生
0
0
100%
博士生
0
0
100%
博士後研究員
0
0
100%
參與計畫人力
(外國籍)
專任助理
0
0
100%
人次
其他成果
(
無法以量化表達之
成果如辦理 學 術 活
動、獲得獎項、重要
國際合作、研究成果
國際影響力 及 其 他
協助產業技術發展
之 具 體 效 益 事 項
等,請以文字敘述填
列。)
1.藉由此國科會計畫的執行,與加州大學爾灣分校功能性腫瘤影像中心建立研究
合作的管道。
2.研究成果已發表於國際知名期刊 Physics in Medicine and Biology,增進研
究之國際影響力。
3.因研究成果受矚目,Physics in Medicine and Biology 和 Integrative Biology
邀請審查核磁共振乳房影像相關論文審查
Ref: PMB/365752/PAP/246645 ''''Magnetoacoustic tomography with
magnetic induction (MAT-MI) for breast tumor imaging: Numerical
modeling and simulation ' ' ' '
for Physics in Medicine and
Biology(20100814);
ID IB-ART-09-2010-000089 entitled ''''Topographic enhancement
mapping of the cancer-associated breast stroma using breast MRI''''for
the Integrative Biology.(20100923)。
成果項目 量化 名稱或內容性質簡述 測驗工具(含質性與量性)
![Fig. 1. The segmented fatty tissue (white areas) and the fibroglandular tissue (red areas) using by the MRI-based segmentation method (Nie et al., 2008)[22]](https://thumb-ap.123doks.com/thumbv2/9libinfo/8978945.281140/5.892.290.620.550.986/segmented-fatty-tissue-fibroglandular-tissue-areas-segmentation-method.webp)