Toward the Best Feature Model for Network Intrusion Detection Using Stepwise Regression and Support Vector Machine
6
0
0
全文
(2) one feature at a time and compared the resulting performance in each SVM test. They also applied this method to the KDDCup’99 data and performed the feature ranking for feature selection [8]. They ranked the features into three categories: “important”, “secondary”, and “insignificant” according to three main performance criteria: overall accuracy of classification, training time, and testing time. 19 important features were identified and used in the experiments. However, this heuristic-based method is time consuming. Chebrolu et al. [9] proposed two feature selection algorithms, Bayesian networks (BN) and Classification and Regression Tree (CART). Three different sets of feature (12, 17 and 19 features) were derived and used in their ensemble approach for IDS. Although a very high prediction rate was obtained in their experiment, their method could not be fully convinced since only 5092 and 6890 records were considered in the training and testing procedure, respectively. Ohn, Kim, Park, et al. [10, 11] adopted genetic algorithm to search the optimal feature set for SVM. 31 features were used with radial kernel function in their experiment and a very high prediction rate was obtained for the original KDDCup’99 test dataset (corrected.gz) [12]. Since their training data was sampled from the full dataset (kddcup.data.gz), the challenge of the problem was reduced. The same author group later proposed a correlation-based feature selection to find the best subset of features which applied a correlation test to the resulting features generated by genetic algorithm [13]. 12 features were obtained and proved to achieve 99.56% detection rate and 99% classification rate. However, only the Denial of Service (Dos) attack was considered and a portion of original dataset was used. There is no way to compare their result to the literatures. Besides, principal component analysis approach and Discriminant analysis approach have been proposed to decrease the overhead of IDS and increase the detection rates [14, 15]. Support Vector Machine [16] is a prediction tool based on statistical machine learning which shows more theoretical basis than Neural Network. It has been successfully applied to pattern recognition, classification and also intrusion detection system. Sung and Mukkamala [17] applied four different methods: SVM, linear genetic programming (LGP), Artificial Neural Network (ANN), and Multivariate Adaptive Regression Splines (MARS) to IDS. Their study showed that SVM and LGP had better performance than the other two. In their other study [18], they applied ANN and SVM to the KDDCup’99 dataset. Their result showed that both SVM and ANN had the same prediction rate, however, SVM was more efficient. What we know so far, multiple linear regression (MLR) is rarely applied to anomaly-based network intrusion detection for feature selection. In our approach, we take a data-centric point of view and consider intrusion detection as a data analysis process. The central theme of our approach is to adopt this widely used statistical method which was successfully applied in social and behavioral sciences to capture the actual behavior of intrusion and normal activities. This approach significantly reduces the need to manually analyze the intrusion patterns of normal. - 844 -. usage profiles. Our research target aims to develop a more systematic and automated approach for building lightweight IDS. We first use MLR to identify the “best model” of features from the training dataset and then to validate the obtained feature set with SVM. The rest of this paper is organized as follows. In Section 2, we briefly introduce the concept of MLR. The SVM technique is described in Section 3. Experimental results are shown in Section 4. Finally, in Section 5, we present our conclusion and the direction of future research.. 2.. MULTIPLE LINEAR REGRESSION. Suppose that we have a response variable Ri and a n-dimensional vector of explanatory variables Ei = (Xi1, Xi2, …, Xin), then the general regression model is given by. Ri = F (Ei ) + ε i , i = 1,2,..., n. where F() represents any function, and the ε are independent random variables with zero mean and constant variance for all i. If the function F() of a simple regression model is a straight line function, then the regression model is called a simple linear regression model. In the same concept, if the function F() of a multiple regression model is a straight line function, then the regression model is called a multiple linear regression model. The response variable can be described as follows:. Ri = F ( X i1 , X i 2 , ... , X in ) + ε i = β 0 + β1 X i1 + β 2 X i 2 + ... + β n X in + ε i. where βi are unknown parameters. In order to use the model for statistical inference, such as testing hypotheses about the model, or using it to make predictions on the response variable for new values of the explanatory variables, it is often appropriate to assume that Ri is independent normally distributed random variables with equal variances and mean values depending linearly on X. A multiple linear regression model is defined to be linear in the regression parameters rather than in the explanatory variables. In complex regression situations, when there is a large number of explanatory variables which may be relevant for making predictions about the response variable, it is useful to be able to reduce the model to contain only the variables which provide important information about the response variable. There are many different methods for selecting the best regression model, but for each method, two key issues must always be taken into consideration. The first issue refers to choosing a selection criterion and the second issue to choosing a selection procedure. There are several variable selection procedures to multiple regression analysis such as forward selection, backward elimination, and stepwise. The most recent and most sensible procedure is the ‘all possible models’ procedure. In this procedure, all possible models are fitted to the data, and the selection criterion is used on all the models in order to choose the best one. In general, if the maximum model has k explanatory variables, one has to fit (and compare) 2k-1 different models. Thus, in situations with many explanatory variables in the maximum model, the all.
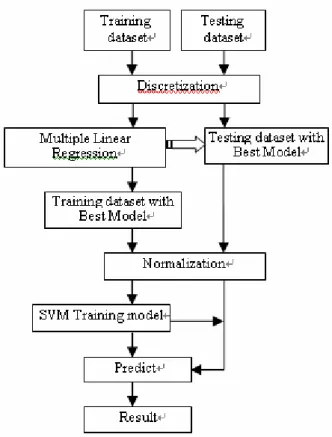
(3) possible models procedure becomes impractical. However, this procedure should always be preferred unless the number k is large. The two traditional procedures, the forward selection procedure and the backward elimination procedure, respectively concentrate on deciding whether each of the explanatory variables should, or should not, be included in the final model. The procedures are fast even in situations with many possible explanatory variables. However, they do not always lead to the best model! The stepwise regression procedure was developed from the traditional procedures in order to improve the chance of achieving the best model. The stepwise method is straightforward. It finds the variable with the highest correlation to the dependent, and builds an equation. Then it calculates a "partial correlation coefficient" for everything else, i.e., it determines the correlation between whatever is left and Y, removing the variance already explained by X. The variable with the most significant partial correlation, but not already in the equation, is entered next. This continues until there are no variables left that have a partial coefficient with a significance of at least 95%. To conclude the usage of selection procedure, if the number of explanatory variables is large, and you want the smallest possible number of variables, and if you don't have a lot of missing data (i.e. the multicollinearity is low) the best alternative is to use stepwise regression.. 3.. SUPPORT VECTOR MACHINE. SVM is originated as an implementation of Vapnik’s structural risk minimization principle, which reduces the empirical risk and quantities based on the bounds of the generalization error, i.e. true error on unseen examples. The basic idea in SVM is to transform the training data into a higher dimensional space and find the optimal hyperplane in the space that maximizes the margin between classes. The simplest model of SVM is called the maximal margin classifier. As shown in Equation (1), SVM attempts to place a linear boundary between the two different classes and to orient this line in such a way that the margin 2/‖w‖is maximized. The nearest data points used to define the margin are known as support vectors, which contain all the information needed to define the classifier. yi ( wT xi + b ) ≥ 1, for i = 1,2,..., N and xi ∈ A ∪ B ⎫ ⎪ ⎬ 1 2 Minimize w,b w ⎪ 2 ⎭. (1). When two classes cannot be completely separated, this approach may not be feasible due to overlapping distribution. Therefore, the slack variable ξ is introduced to control misclassification. As shown in Equation (2), the generalized optimal margin classifier, called soft margin classifier, softens the hard constraint of completely separating cases. Another technique to deal with non-linearly separable cases is to map the data into higher dimensions, called feature space, using a kernel function. In high-dimensional space, it is possible to create a hyper-plane that allows linear separation – corresponding. - 845 -. to a curved surface in the lower-dimensional input space. Accordingly, the kernel function plays an important role in SVM. In practice, various kernel functions can be used, such as linear, polynomial, or the Gaussian radial basis function Many real world problems exist in more than two classes. Most researchers view multi-class SVMs as an extension of the binary SVM classification problem. Two commonly used approaches are one-against-all and one-against-one methods. The one-against-all method is easy for implementation. It constructs k SVM models where k is the number of classes. The p-th SVM is trained by using all the examples in the p-th class with positive labels, and all other examples with negative labels. The decision function chooses the class corresponds to the maximum value of k binary decision functions specified by the furthest positive hyperplane. This approach is computationally expensive because k quadratic optimization problems (QP) with sample size l need be solved. The one-against-one method involves binary SVM classifier construction for all pairs of classes. This method constructs k(k-1)/2 classifiers where each one is trained by the data from two classes. This number is usually larger than the number of one-against-all classifiers. Although this suggests significantly large training time, the individual problems are smaller because in average, each QP problem has about 2l/k variables. y i ( w T x i + b ) ≥ 1 − ξ i , i = 1, 2,..., N and x i ∈ A ∪ B ⎫ ⎪ N ⎪ (2) 1 2 Minimize w ,b w + C ∑ ξ i , i = 1, 2,..., N ⎬ 2 i =1 ⎪ ⎪ ξ i > 0, i = 0,1, 2,..., N ⎭. 4.. EXPERIMENTS. 4.1. Test Data The KDDCup’99 intrusion detection datasets are connection records generated from binary TCP dump data. Each connection record corresponds to a normal connection or to a specific attack. It was originated from the study of MIT Lincoln Lab in the framework of the intrusion detection evaluation program and post-processed by the Columbia University. The dataset includes 41 different features involving four categories of attack: deny of services (DoS), surveillance and other probing (Probing), unauthorized access to local root privileges (U2R), and unauthorized access from a remote machine (R2L). In each category there are different types of attack. The official data files were used in our experiment. The kddcup.data_10_percent.gz data file (contain 10% original data) with 494,021 records was used for training and the corrected.gz data file with 311,029 records was used for testing. The total normal and attack records of the testing data are 60593 and 250436, respectively.. 4.2. Test Procedure Our procedure proposed in this paper is outlined as in.
(4) Figure 1. Before the data was fed to our procedure, the class label of all attack data was unified to one class “attack”. A MLR procedure of SPSS [19] was conducted on the preprocessed data to obtain the best feature model. Only the corresponding features in the best feature model of the data were fed to SVM [20] for training and testing. When the training process was finished, the testing dataset was examined. The typical kernel function, Gaussian Radial Basis Function (RBF), was chosen in our experiment. RBF can be written as exp(-γ║xi-xj║2), γ>0. Two parameters that must be determined are the kernel parameterγand the penalty C. In determining these two parameters, 10-fold Cross Validation (CV) technique was used in the training dataset to choose parameters yielding the best result. Subsequently, this set of parameters was applied to the testing dataset. The parameters tried in the 10-fold CV process were γ={2, 1, 0.5, 0.1, 0.01, 0.001} and C={1000,500, 250, 100, 50, 10}.. Since the model with the largest number of explanatory variables will always have the largest R Square value, we evaluate the adjusted version of R Square instead of R Square itself. There are 38 models given in the model summary table. Table 1 shows those models with the adjusted version of R Square values. According to the issue of parsimony of model selection, one should prefer the simpler if two models are equally good. Model 28 is the best feature model, however, it has 28 features and seems too large. From the table, we selected five more “smaller” models (7, 8, 9, 12, and 20) to perform further testing. We observed that when γ was at 0.01 and C was at 1000, the results achieved the better performance. Table 2 shows the cross-validation result for the examined 6 models Model Summary R adj. R adj. R adj. Model Model Model Square Square Square 1 0.632 14 0.942 27 0.945 2 0.745 15 0.943 28 0.947 3 0.897 16 0.943 29 0.947 4 0.912 17 0.943 30 0.947 5 0.923 18 0.943 31 0.947 6 0.929 19 0.944 32 0.947 7 0.931 20 0.945 33 0.947 8 0.934 21 0.945 34 0.947 9 0.936 22 0.945 35 0.947 10 0.937 23 0.945 36 0.947 11 0.938 24 0.945 37 0.947 12 0.940 25 0.945 38 0.947 13 0.941 26 0.945 Table 1. The Model Summary generated from the training data. Cross Validation Test Model Accuracy 7 99.32 8 99.24 9 99.47 12 99.72 20 99.89 28 99.90 Table 2. The cross validation test for the six examined models.. Figure 1. The outline of the proposed method.. 4.3. Results SPSS provides a table called “Model Summary” which shows the strength of relationship between the model and the explanatory variables. The entering sequence of the explanatory variables is according to the importance of the variables. The R value, the multiple correlation coefficients, in the model summary is the linear correlation between the observed and model-predicted values of the response variable. The R Square value, the coefficient of determination, is the squared value of the multiple correlation coefficients, which measures the goodness-of-fit of the examined model in terms of the proportion of the variations of the explanatory variables.. - 846 -. To show the effectiveness of our methods, the works from Ambwani [21] and the KDDCup’99 winner are listed. Ambwani applied SVM with all 41 features to the two official datasets of KDDCup’99 while KDDCup’99 winner is a fair comparison. In addition, we also applied SVM with Ohn’s 31 features [10] and Sung’s 25 features [7] to compare the performance. Table 3 shows the original full feature set and Table 4 shows the feature set of each method. Table 5 shows the performances of each compared methods, where TP and TN denotes true positive and true negative, respectively. The performance of our.
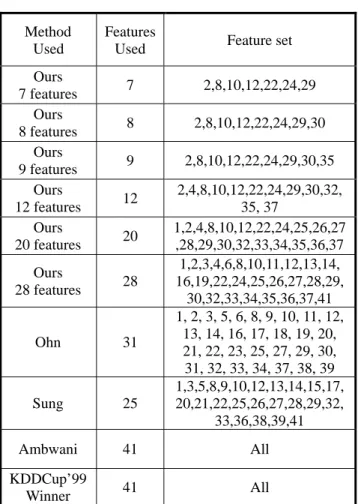
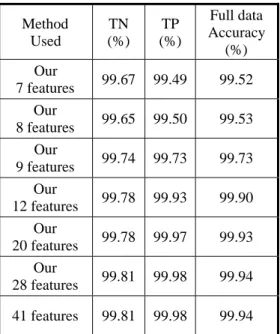
(5) best feature model with 28 features obtained from MLR is slightly better than Ambwani’s 41 features and Sung’s 25 features. In addition, we have also applied the same SVM train models obtained from trained data using MLR to the full data set for further performance observation. There are 4,898,431 records in total where the normal and attack records are 972,781 and 3,925,650, respectively. The result is shown in Table 6. Empirical results indicate that even though we use 12 features extracted from the Stepwise Regression we still can get nearly the same performance as the full feature set. The best feature model can get the same performance, 99.94%, as the full feature set too. 1 2 3 4 5 6 7 8 9 10 11 12 13 14 15. Duration Protocol_type Service Flag Src_bytes Dst_bytes Land Wrong_flagment Urgent Hot Num_failed_logins Logged_in Num_compromised Root_shell Su_attempted. 22 23 24 25 26 27 28 29 30 31 32 33 34 35 36. 16. Num_root. 37. 17 18. Num_file_creations Num_shells. 38 39. 19 20 21. Num_access_files Num_outbound_cmds Is_host_login. 40 41. Is_guest_login Count Srv_count Serror_rate Srv_serror_rate Rerror_rate Srv_rerrot_rate Same_srv_rate Diff_srv_rate Srv_diff_host_rate Dst_host_count Dst_host_srv_count Dst_host_same_srv_rate Dst_host_diff_srv_rate Dst_host_same_src_port _rate Dst_host_srv_diff_host_ rate Dst_host_serror_rate Dst_host_srv_serror_rat e Dst_host_rerror_rate Dst_host_srv_rerror_rate. Table 3. The original full feature set.. 5.. CONCLUSIONS. We have presented a statistical based method, multiple linear regressions with stepwise selection procedure, to identify the best feature model for anomaly-based network intrusion detection system based on KDDCup’99 dataset. Our approach is based on theoretical method for finding features. It is fast and precise. By using support vector machine, the best feature model can provide good results. In short, the elimination of features by our approach leads to a simplification of the problem. Faster and more accurate detection can be expected. They can be applied on lightweight intrusion detection system according to the requirement of the performance and the appropriateness of the selected features.. Method Used. Features Used. Feature set. 7. 2,8,10,12,22,24,29. 8. 2,8,10,12,22,24,29,30. 9. 2,8,10,12,22,24,29,30,35. Ours 7 features Ours 8 features Ours 9 features Ours 12 features Ours 20 features. 12 20. Ours 28 features. 28. Ohn. 31. Sung. 25. Ambwani. 41. 2,4,8,10,12,22,24,29,30,32, 35, 37 1,2,4,8,10,12,22,24,25,26,27 ,28,29,30,32,33,34,35,36,37 1,2,3,4,6,8,10,11,12,13,14, 16,19,22,24,25,26,27,28,29, 30,32,33,34,35,36,37,41 1, 2, 3, 5, 6, 8, 9, 10, 11, 12, 13, 14, 16, 17, 18, 19, 20, 21, 22, 23, 25, 27, 29, 30, 31, 32, 33, 34, 37, 38, 39 1,3,5,8,9,10,12,13,14,15,17, 20,21,22,25,26,27,28,29,32, 33,36,38,39,41 All. KDDCup’99 41 All Winner Table 4. The features used in each examined method. TN (%). TP (%). Test data Accuracy (%). 99.65. 90.31. 92.13. 99.64. 90.31. 92.13. 99.54. 90.48. 92.25. 99.59. 90.60. 92.35. 99.54. 90.74. 92.45. 99.54. 90.89. 92.58. 99.55. 90.92. 92.60. 99.52. 90.82. 92.51. Ambwani 41 features. 99.57. 90.74. 92.46. KDDCup’99 Winner. 99.45. 91.81. 93.29. Method Used Our 7 features Our 8 features Our 9 features Our 12 features Our 20 features Our 28 features Ohn 31 features Sung 25 features. Table 5. The performance for each examined method.. - 847 -.
(6) Method Used Our 7 features Our 8 features Our 9 features Our 12 features Our 20 features Our 28 features 41 features. TN (%). TP (%). Full data Accuracy (%). 99.67. 99.49. 99.52. 99.65. 99.50. 99.53. 99.74. 99.73. 99.73. 99.78. 99.93. 99.90. [11]. [12] [13]. [14]. 99.78. 99.97. 99.93. 99.81. 99.98. 99.94. 99.81. 99.98. 99.94. [15]. Table 6. The performance for each examined method.. [16] [17]. References [1]. [2]. [3]. [4]. [5]. R. Bace, “An Introduction to Intrusion Detection and Assessment: for System and Network Security Management,” ICSA White Paper, 1998. P. Kabiri and A.A. Ghorbani, “Research on Intrusion Detection and Response: A Survey”, International Journal of Network Security, Vol. 1, No.2, pp. 84-102, 2005. M.-L. Shyu, S.-C. Chen, K. Sarinnapakorn, L. Chang, “A Novel Anomaly Detection Scheme Based on Principal Component Classifier,” Proceedings of the IEEE Foundations and New Directions of Data Mining Workshop, in conjunction with the Third IEEE International Conference on Data Mining (ICDM'03), pp. 172-179, Nov. 19-22, 2003, Melbourne, Florida, USA. N. Ye, S. Emran, Q. Chen, S. Vilbert, “Multivariate Statistical Analysis of Audit Trails for Host-Based Intrusion Detection,” IEEE Transactions on Computers, Vol. 51, No. 7, pp. 810-820, 2002.. E.J. Pedhazur, Multiple regression in behavioral research, third edition. New York: Harcourt Brace College Publishers, 1997.. [6]. P.V. Larsen, ST111: Regression and analysis of variance, http://statmaster.sdu.dk/courses/st111, July 2006. [7] A.H. Sung, S. Mukkamala, “Identifying important features for intrusion detection using support vector machines and neural networks”, Proceedings of Application and the Internet, pp. 209-216, Jan. 2003. [8] S. Makkamala, A. H. Sung, “Feature ranking and selection for intrusion detection systems using support vector machines”, Proceedings of the International Conference on Information and Knowledge Engineering, pp. 503-509, June 2002. [9] S. Chebrolu, A. Abraham, J.P. Thomas, “Feature deduction and ensemble design of intrusion detection systems”, Computers & Security, Vol. 4, Issue 4, pp. 295-307, June 2005. [10] S.-Y. Ohn, H.-N. Nguyen, D.S. Kim, and J.S. Park, “Determining optimal decision model for support vector machine by genetic algorithm”, Computational and. - 848 -. [18]. [19] [20] [21]. Information Sciences, Lecture Notes in Computer Science, Vol. 3314, pp. 895-902, Springer Verlag, 2004. D.S. Kim, H.-N. Nguyen, S.-Y. Ohn, and J.S. Park, “Fusions of GA and SVM for Anomaly Detection in Intrusion Detection System,” Advanced in Neural Networks, Lecture Notes in Computer Science, Vol. 3498, pp. 415-420, Springer Verlag, 2005. http://kdd.ics.uci.edu/databases/kddcup99/task.html J.S. Park, K.M. Sazzad, D.S. Kim, “Toward Modeling Lightweight Intrusion Detection System through Correlation-based Hybrid Feature Selection,” SKLOIS Conference on Information Security and Cryptology, Lecture Notes in Computer Science, Springer Verlag, 2005. Y. Bouzida and S. Gombault, “Intrusion Detection Using Principal Component Analysis,” Seventh multi-conference on Systemics, Cybernetics and Informatics, Orlando, Florida, USA, July, 2003. W.-T. Wong, C.-Y. Lai, “Identifying important features for intrusion detection using Discriminant analysis and support vector machine,” Proceedings of 2006 International Conference on Machine Learning and Cybernetics, Dalian, China, Aug. 13-16, Vol. 6, pp.3563-3567, 2006. V.N. Vapnik, The Nature of Statistical Learning Theory, Springer-Verlag, New York, 1995. S. Mukkamala, A.H. Sung, “A comparative study of techniques for intrusion detection”, Proceedings of 15th IEEE International Conference of Tools with Artificial Intelligence, pp. 570-577, Nov. 2003. S. Mukkamala, G. Janoski, A.H. Sung, “Intrusion detection using neural networks and support vector machines”, Proceedings of the International Joint Conference on Neural Networks (IJCNN’02), Vol. 2, pp. 1702-1707, May 2002. SPSS 12.0, © SPSS Inc, www.spss.com. http://www.csie.ntu.edu.tw/~cjlin/libsvm/faq.html T. Ambwani, “Multi class support vector machine implementation to intrusion detection”, Proceedings of the International Joint Conference of Neural Networks, Vol. 3, pp. 2300-2305, July 2003..
(7)
數據
相關文件
Then, based on these systematically generated smoothing functions, a unified neural network model is pro- posed for solving absolute value equationB. The issues regarding
If the best number of degrees of freedom for pure error can be specified, we might use some standard optimality criterion to obtain an optimal design for the given model, and
We have also discussed the quadratic Jacobi–Davidson method combined with a nonequivalence deflation technique for slightly damped gyroscopic systems based on a computation of
• Adds variables to the model and subtracts variables from the model, on the basis of the F statistic. •
what is the most sophisticated machine learning model for (my precious big) data. • myth: my big data work best with most
Deep learning usually refers to neural network based model.. Shallow – Speech Recognition. ◉
The angle descriptor is proposed as the exterior feature of 3D model by using the angle information on the surface of the 3D model.. First, a 3D model is represented
In this chapter, the results for each research question based on the data analysis were presented and discussed, including (a) the selection criteria on evaluating
