845
Heat Flow Measurements over Bottom Simulating Reflectors,
Offshore Southwestern Taiwan
Chuen-Tien Shyu1,
*
, Yu-Jhong Chen 2, Shaye-Tang Chiang1, and Char-Shine Liu1(Manuscript received 20 March 2006, in final form 20 July 2006)
ABSTRACT
1
Institute of Oceanography, National Taiwan University, Taipei, Taiwan, ROC
2
Macronix International Co., Ltd., Science Park, Hsinchu, Taiwan, ROC
*
Corresponding author address: Prof. Chuen-Tien Shyu, Institute of Oceanography, National Taiwan University, Taipei, Taiwan, ROC; E-mail: ctshyu@oc.ntu.edu.twThe submarine accretionary wedge offshore of southwestern Taiwan consists of an intensively deformed upper slope and a lower slope charac-terized by mostly west-vergent anticlines and thrusts. The fast accumula-tion of sediment covers and seals organic material before it is oxidized within the accretionary wedge. The bottom simulating reflectors (BSRs) associ-ated with the accretionary prism and imbricate wedge are often observed in marine seismic reflection data from continental slopes and rises.
A total of 23 heat flow measurements were carried out along seismic profiles with obvious BSRs offshore of southwestern Taiwan. On average, through sedimentation-correction heat flows have increased by 10%, and the base of gas hydrate stability zone (BGHS) predicted by geotherm has up-shifted by 11%. The average depth of BGHSs is 304 mbsf versus 358 mbsf for BSRs.
The average heat flow from measurements is 64 mW m-2, while that
estimated from BSRs is 54 mW m-2 (16 percent less) which is reasonable
compared with past results of other researchers. They are both increasing from coastal waters southward to the front of the accretionary wedge. One interesting fact found is that one of our heat flow measurements showed no indication of impact friction raised temperature on data recordings. The friction may have been absorbed by gas hydrate for dissociation.
Terr. Atmos. Ocean. Sci., Vol. 17, No. 4, December 2006
846
1. INTRODUCTION
Gas hydrate is an ice-like compound of water with inclusions of methane, ethane, propane, hydrogen sulfide, carbon dioxide, and salt (NaCl) (McIver 1974; Yefremova and Gritchina 1981; Brooks et al. 1984; Ginsburg et al. 1992; Kvenvolden 1995; Kastner et al. 1998). High pressures and low temperatures are required for the formation of a gas hydrate. These require-ments restrict its natural occurrence to deep ocean bottom sedirequire-ments and areas of thick permafrost. The stability of gas hydrate is dependent on pressure, temperature, and the solubil-ity of gas as a function of pressure and temperature in the system (e.g., Handa 1990; Zatsepina and Buffett 1997). The gas hydrate stability is significantly more susceptible to changes in temperature than pressure. There are two methods to estimate the boundary of methane hy-drate stability for all combinations of temperature, pressure and salinity. The first method is based on experimental recordings of the critical temperature and pressure at the onset of gas hydrate (e.g., Handa 1990; Dickens and Quinby-Hunt 1994, 1997; Brown et al. 1996). The second method is based on minimizing the Gibbs Free Energy of the system. Computer pro-grams to determine the gas hydrate stability boundary at varied temperatures and pressures may be available (Sloan 1990, 1998; Zatsepina and Buffett 1997, 1998; Buffett and Zatsepina 1999). Gas hydrate forms wherever appropriate physical conditions, moderately low temperature, and moderately high pressure exist. These conditions are usually found on sea floor sediments at depths greater than about 500 m (depending on the water temperature). Minimum temperature normally occurs at the sea floor; however, downward through the sediments, the temperature rises along the geothermal gradient (geotherm). At the base of the gas hydrate stability zone (BGHS), or at a depth where the gas hydrate begins to dissociate due to temperature and pressure conditions no longer meet the requirement for methane hydrate to be stable (e.g., too higher temperature). Hydrate is confined to the uppermost layer (above BGHS) of sediments, while free gas is stable below the BGHS. When the BGHS between gas hydrate above, and nonhydrated (and possibly gas-charged) sediments below, exists within the sedimentary column, the decrease in velocity and density makes for an acoustic impedance (density multiplied by sound velocity) contrast (reflectivity) at the BGHS to be prominent and consequently a negative-polarity reflector. This contrast may produce rather striking bottom-simulating reflectors (BSRs) on seismic reflection profiles. In general, BSRs are more or less parallel to the sea floor and exhibit increasing depth with water depth. This is predicted from the pressure-temperature conditions for stable gas hydrate, where increasing hydrostatic pres-sure and decreasing water-bottom temperature will make hydrates stable to greater depths in the sediments. The depth and in situ temperature at BGHS can be estimated when seismic velocity, pressure, and gas composition are known. Shipley et al. (1979) estimated geotherms from the depth of the BGHS on continental slopes and rises. Townend (1997) concluded that BSR data is very useful in determining offshore heat flow around New Zealand, and suggested that heat flow estimates need to be corrected for thermal effects of ongoing sediment deposition. Ganguly et al. (2000) analyzed the heat flow variations from data of BSR on the continental slope of the northern Cascadia margin, and accentuated that carrying out topographic correc-tions in regions of significant relief such as the continental slope are important to heat flow
values. Though the heat probe measured heat flows and BSR heat flow estimates are often combined to interpret the regional thermal patterns and trends (Hyndman et al. 1993), heat flow data measured by heat probe is not always consistent with that estimated from BSRs (Davis et al. 1990). In the present study, we examined the detailed variation of heat flows measured with heat probes and compared them with those estimated from BSRs on the seis-mic profiles for offshore southern Taiwan. The importance of this study is: (1) that the heat flow values, variations, and trends of the continental slopes and rises of offshore southwestern Taiwan may greatly affect the gas hydrate distribution patterns in this region; and (2) that the derived BGHSs either from geotherms of heat probe data or from BSR estimates are very useful for the assessment of gas hydrate deposits, which could be commercially developed to supply huge volumes of energy to a needy world far into the future.
2. TECTONIC SETTING
The studied areas off southwestern Taiwan in the northern end of the South China Sea are at the junction between the Chinese continental margin and the accretionary wedge of south-ern Taiwan. The wedge was formed by the eastward subduction of the South China Sea litho-sphere under the Luzon arc during the Cenozoic time (Big 1972; Bowin et al. 1978; Teng 1990; Huang et al. 1997). Normal faults which form horsts and grabens are observed in the shelf and slope regions of the passive Chinese continental margin located in the northwestern corner of the junction area. The frontal portion of the imbricated thrusts and related folds, observed in the lower slope region of the accretionary wedge which extended north-north-westerly toward the Chinese continental margin, were gradually buried and terminated as they reached the Chinese continental slope (Liu et al. 1997). The Chinese continental margin in this area is characterized by a host-and-graben system related to the extensional tectonic of a passive margin (Sun 1982, 1985; Hu 1988). Seismic profiles indicate that large amounts of incoming orogenic sediments from the Taiwan mountain belt have caused outward growth of the accre-tionary wedge and westward migration of the deformation front (Liu et al. 1997; Yu and Huang 2006). The submarine accretionary wedge of offshore southwestern Taiwan consists of an intensively deformed upper slope, and a lower slope characterized by mostly west-vergent anticlines and thrusts. Many mud volcanoes and diapirs were reported both on-land and sub-marine southwestern Taiwan (Chow et al. 2000; Yang et al. 2004; Chiu et al. 2006). The trend evolution of the frontal folds and thrusts in the lower slope was described in detail by Liu et al. (2005).
The fast accumulation of sediment covers and seals the organic material before it is oxi-dized in the accretionary wedge. BSRs are often observed in marine seismic reflection data from continental slopes and rises, many of which are associated with the accretionary prism and imbricate wedge (Katz 1982; Lewis and Pettinga 1993; Ashi et al. 2002). Intensive BSRs have been observed in off southwestern Taiwan (Chi et al. 1998; Liu et al. 2006). Some abnor-mally geological and geochemical features (Chao and You 2006; Chuang et al. 2006; Horng and Chen 2006; Jiang et al. 2006; Lin et al. 2006; Yang et al. 2006) have also been reported. It infers that gas hydrates are widely distributed in the region.
Terr. Atmos. Ocean. Sci., Vol. 17, No. 4, December 2006
848
3. ACQUISITION AND PROCESSING OF HEAT FLOW DATA
3.1 Determination of the Temperature and Thermal Conductivity of Sediments
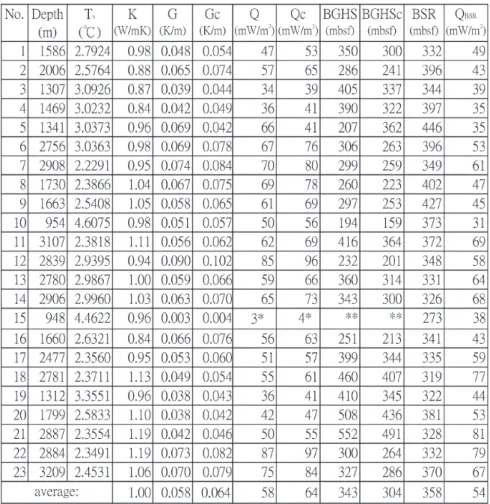
The heat flow data presented in this paper was collected aboard the R/V Ocean Researcher I from 2000 to 2003. Most of the heat flow sites were chosen along pre-existing seismic pro-files of obvious BSRs (Figs. 1, 5). The Lister-type high-resolution heat probe used for heat flow measurements was developed at the Institute of Oceanography, National Taiwan University. It allows temperature resolution to be better than 0.1 mK in the range of -1 to 25°C. Although the heat probe has the capability of multi-penetration, due to the time constraint, only one penetration was attempted for all measuring sites. During each penetration, the instrument remains undisturbed in the seafloor for about 30 minutes to measure temperature and thermal conductivity in situ (12 minutes for the geotherm; 8 minutes for the thermal conductivity). The equilibrium ambient temperature of sediment was obtained by fitting the temperature decay curve with the thermal decay model of a cylinder (Bullard 1954; Carslaw and Jaeger 1959), and regressing with respect to parameters of ambient temperature, initial temperature rise, thermal conductivity, and heat capacity of the sediment (Shyu and Chang 2005). The same regressing process was applied to the heat pulse decay and extrapolated to infinite time (asymptotic solution) for solving the thermal conductivity of sediment (Hyndman et al. 1979). The data at shallow penetration sites generally reveals abnormal geotherms compared to other sites. This may be related to bottom water temperature variations in this area; consequently, these data were excluded from analysis. The resulting temperatures and thermal conductivities at 23 sites are displayed in Fig. 2 and listed in Table 1.
3.2 Estimation of the BGHS from Geotherm
The pressure at the depth of the BGHS is the sum of the pressure of the seawater column overlying the seafloor and the pressure of the sediment column overlying the BGHS. Al-though hydrostatic pressure (from the pore-water of the sediment) of the sediment column could be used for the calculation, lithostatic pressure (from the gross density of the sediment), on the other hand, may give heat flow values which are closer to those determined by seafloor heat probe measurement (Davis et al. 1990; Ganguly et al. 2000). Nevertheless, a suitable criterion for the model selection (hydrostatic or lithostatic model) has not been proposed. In the study area, the pressure is close to lithostatic due to fluid expulsion along faults or the mud diapir pierced the sea floor Chiu et al. (2006). In the following, we convert the BGHS to pressure by taking both hydrostatic pressure for the water column and lithostatic pressure for the sediment column.
Sediments on the lower slope of the accretionary wedge offshore southwestern Taiwan consist of silts and clays. In our pressure calculation for the methane hydrate stability curve, the density for the water and the sediments in the study area were assumed to be 1.025 and 1.7 g cm-3 (Chen 1997), respectively. The depth (in mbsf) at BGHS for each heat flow site is deter-mined at the intersection between the geotherm extrapolated from measured temperatures and the gas hydrate boundary curve. The pressure-temperature empirical equation for methane
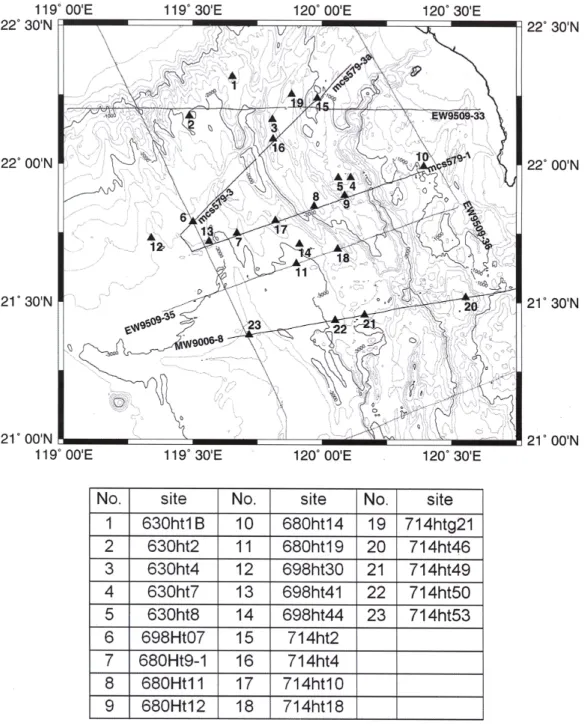
Fig. 1. Locations of heat flow sites ( ) and seismic tracks ( ) in offshore
southwestern Taiwan. Selective seismic profiles are shown in Fig. 5. The site number used in the paper and its original name are listed in the table blow the plot.
Terr. Atmos. Ocean. Sci., Vol. 17, No. 4, December 2006
850
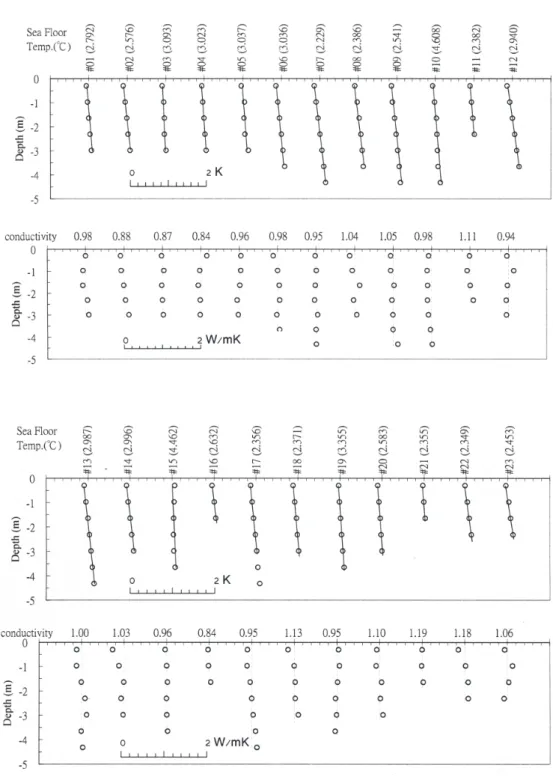
Fig. 2. Temperature and corresponding conductivity profiles for each heat flow
site. Origin of the depth axis is at the seafloor surface. Temperatures in °C on the seafloor surface are parenthesized at each site.
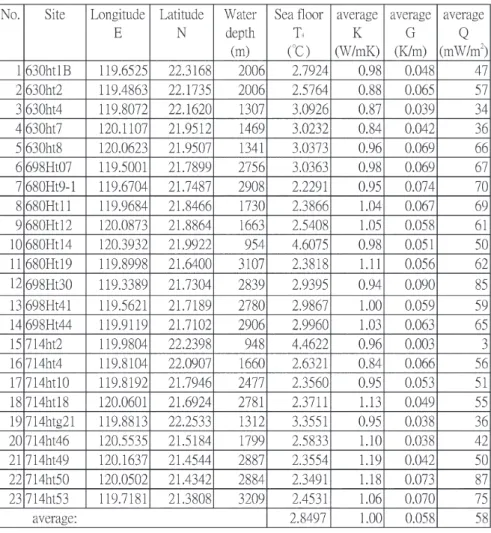
Table 1. Heat flow results in the southwest offshore area of Taiwan.
hydrate stability (gas hydrate boundary curve) in seawater of 350
00 salinity is given in the
following (Dholabhai et al. 1991; Dickens and Quinby-Hunt 1997):
Ln P = 31.59 - 8343 (1 / T) , (1)
where T is the temperature in K and P is the pressure in MPa.
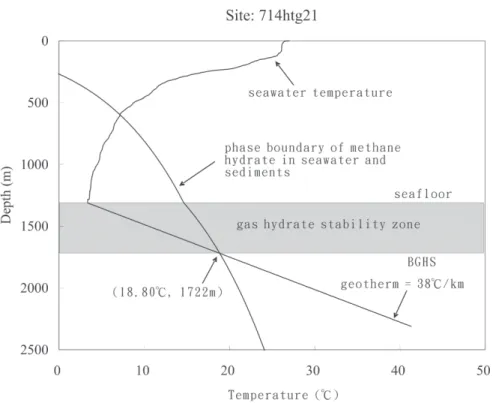
A typical example in Fig. 3 shows a simple geometrical procedure of obtaining the depth of BGHS. The resulted depths of the BGHS for all heat flow measurement sites are summa-rized in Table 2, most of which are around 250 ~ 400 mbsf.
Terr. Atmos. Ocean. Sci., Vol. 17, No. 4, December 2006
852
Fig. 3. Schematic profile of the gas hydrate stability zone in marine sediments at
a typical site. The intersection of the geotherm with the temperature for three-phase equilibrium defines the base of the gas hydrate stability zone (BGHS).
4. RESULTS AND DISCUSSION
The discrepancy between the theoretical BGHS (predicted by the extrapolation of the geotherm) and the observed base of gas hydrate bearing sediments may be related to miscellaneousneous mechanisms such as the effect of the interstitial water chemistry (Lu and Matsumoto 2001), the capillary effect (Handa and Stupin 1992), the gas composition (Waseda and Uchida 2004), the uplift of the BGHS (Foucher et al. 2002), and the change of thermal gradient with depth. We will discuss the heat flow distribution, trend, and the comparison of the BGHSs predicted by geotherms with the observed BSRs on seismic profiles below.
4.1 Geotherms and Thermal Conductivities
In general, the geotherms show less departure from a straight line than those of thermal conductivities. Average geotherms are determined from the best linear fit of equilibrium
tem-Table 2. Comparison of measured geotherm, heat flow, geotherm predicted BGHS with those of sedimentation-corrected and BSR estimated values.
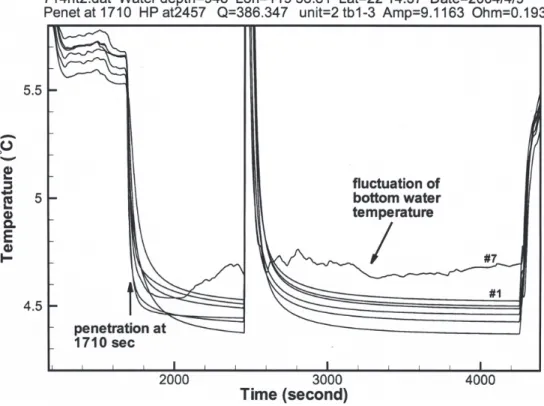
peratures for each thermistor versus depth. To assure a better fit of the regression line, we did not take those data points that deviated far away from the regression line into account. The extremely low or slightly negative geotherm that occurred at site No. 15 (Fig. 2; Table 1) is of the most interest to us because there is no indication of friction raised temperature on tempera-ture recording when the heat probe impacted the ocean floor (Fig. 4). This may happen if the
Terr. Atmos. Ocean. Sci., Vol. 17, No. 4, December 2006
854
Fig. 4. Temperature recordings at site No. 15. Note: (1) There was no recorded
abnormal raised temperature from friction when the heat probe was in-serted in the seafloor; and (2) irregular oscillation temperature was re-corded by the sensor #7 on the seafloor surface.
ocean floor material is very soft and very close to a fluid state (e.g., gas in seawater). Accord-ing to the present data collected on location (Fig. 5) we conjecture that for the reduction of friction, the material is likely to be an outcrop of powdery gas hydrate disseminated over the sediments. Thus a small amount of friction generated heat by the probe penetration is taken into the gas hydrate dissociation process (endothermic process). That is, the powdery ice-like solid gas hydrate absorbed the friction heat and changed to methane at the same temperature. Additional auxiliary evidence is the temperature fluctuation of bottom water which could be affected by the upward dissociation methane flux (Fig. 4 ).
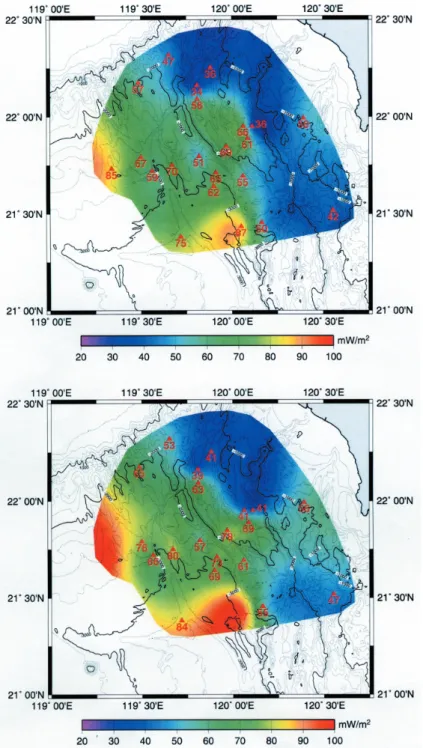
Most heat flow measurement sites are located on the muddy floor. Figure 6 (upper panel) shows how the heat flow increases to the southwest with water depth; this trend could be explained by the lower geotherm close to the coast at the top of the sea floor having been reduced by a high rate of sedimentary deposition while the higher geotherm, in the front of the
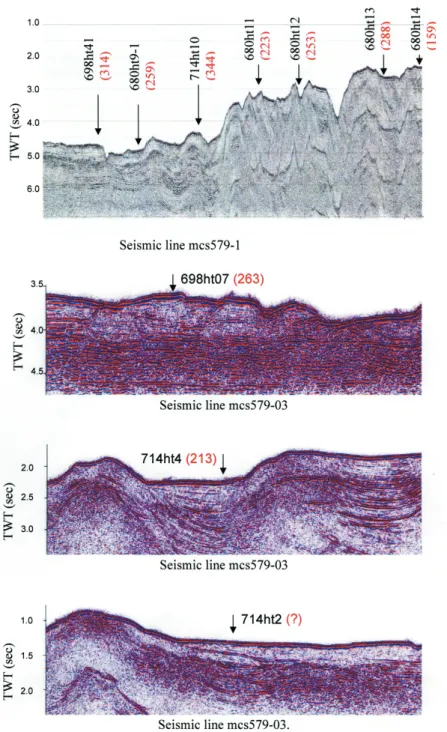
Fig. 5. Locations of heat flow sites (↓) along the corresponding seismic profiles. Parenthetical values at sites are the sedimentation-corrected BGHS (BGHSc) in mbsf. BGHSc at site 714ht2 is not predicted due to extremely low geotherm ( 0).
Terr. Atmos. Ocean. Sci., Vol. 17, No. 4, December 2006
856
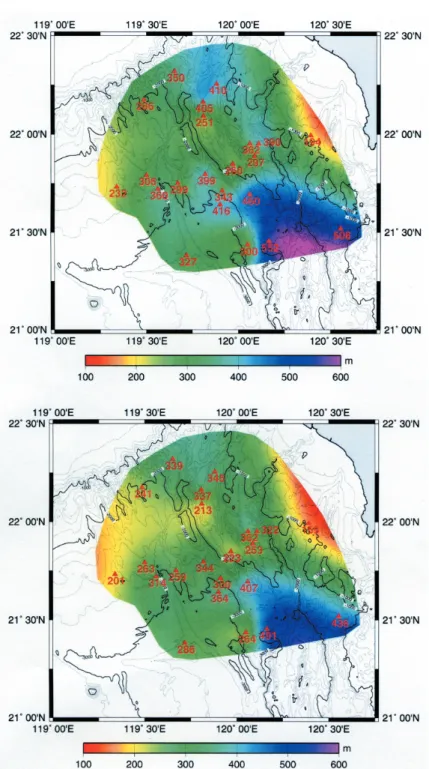
Fig. 6. Measured (top) and sedimentation-corrected (bottom) heat flow
distribution. Numerical values at measured sites ( ) are heat flow value in mW m-2.
accretionary wedge, came about as a result of the northeastward subduction of the China Sea lithosphere. Sediments are derived mainly from Shou-Shan Gully and Kaoping Canyon passages. Abundant terrigenous clastic materials continuously pour into the shelf and slope by river propagation and longshore erosion. In general, sedimental skewness is greater than 0.1 which implies that coarse sediments are dominant in this area (Chen 1997). This may explain partly why the deviation of thermal conductivity with respect to a line is obviously greater than that of temperature (Fig. 2). The conductivities are generally uniform with a mean value of 1.00 ± 0.10 Wm-1K-1 which is higher than that of typical marine sediments (~0.9 Wm-1K-1). Experiments show that pure gas hydrate has a low thermal conductivity of about 0.5 Wm-1K-1. In contrast, water ice, a substance to which hydrate is often compared, has thermal conductiv-ity of 2.23 Wm-1K-1 (Sloan 1998). Therefore, our result of slightly higher thermal conductivity may imply that the sediment contains hydrate and ice mixtures. However, it is impossible to determine whether the sediments contain gas hydrate, or what the percentage of the gas hy-drate is contained by the level of thermal conductivity.
Thermal conductivity generally increases to the southeast. Although there are some dif-ferences in mean conductivity between sites, variation with respect to depth is not obvious at most of the sites. Because of the lower conductivity values of 0.87 and 0.84 Wm-1K-1, and temperature gradients of 0.039 and 0.042 K m-1 at sites No. 3 and No. 4, respectively, heat flows at these sites are lower (Table 1).
4.2 Effects of Sedimentation
Since heat flow measurements are made by a Lister-type heat probe, which can only penetrate no deeper than 4.5 mbsf, the temperature gradient across the thin upper layer of sediments may be depressed due to sedimentation. Each grain of sediment arrives at the sea floor at the temperature of the sea bottom water through which it has fallen, which is normally lower than the temperature of those sediments already on the seabed. As the water-sediment boundary is slowly rising, the temperature at every point below it must adjust upward towards a new equilibrium value. This means that part of the conducted heat must be used to warm the material through which it is passing, and the heat flow value at the sea floor is reduced.
The fine particle turbidity sediments of offshore southwestern Taiwan are mainly from erosion of the southern end of the western foothills and western flank of the Central Range. Sedimentation rates estimated from seismic profile analysis range from 0.1 to 0.5 cm yr -1 (Liu et al. 1997). With this extremely high sedimentation rate, the temperature and geotherm disturbance becomes significant in comparison with measurement errors. A better way to exclude the effects of sedimentation is to estimate the thickness of recently deposited sedimentary layers from seismic reflection profiles and the sedimentation rates at each site. However, sedimenta-tion rate may vary greatly depending on site locasedimenta-tions. In the following calculasedimenta-tion, according to Liu et al. (1997), we have adopted an average sedimentation rate of 0.3 cm yr-1 and esti-mated the thickness of the recently deposited sedimentary layers at each site. The correction equation is given by Jaeger (1965; adapted by Kappelmeyer and Haenel 1974):
Terr. Atmos. Ocean. Sci., Vol. 17, No. 4, December 2006
858
where GRAD is the corrected thermal gradient, GRADS the thermal gradient with sedimentation, and Ω is given by:
Ω = 1 2 - + erf - exp -v k v k v k v k v k s s s s s 2 2 2 2 2 2 4 τ τ τ τ τ π τ τ , (3) where vs is the mean uncompacted sedimentation rate, τ is the duration of sedimentation, k is
the thermal diffusivity , the ratio of thermal conductivity (K) to heat capacity (ρc) of the sediment, and “erf” denotes the error function. In our calculation, we have assumρc = (5.79 -3.67K + 1.016K 2)106 Jm-3K-1 as that proposed by Hyndman et al. (1979).
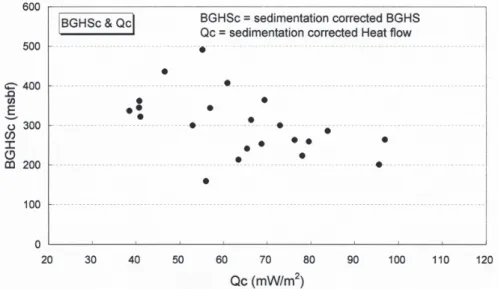
The uncorrected and sedimentation-corrected geotherms, BGHSs, and heat flows are given in Table 2, Figs. 5 and 7. The geotherms and heat flows are both raised to about 10% on average. Consequently, the intersection of geotherms and gas hydrate stability boundary curves become relatively close to the seafloor surface. That is, the sedimentation-correction leads to an up-shift of the BGHS by about 11% of the uncorrected BGHS. As we expected, the sedi-mentation-corrected BGHS (BGHSc) is decreasing with heat flow (Fig. 8).
The depths of BSRs in Table 2 were converted by the following empirical depth-sound travel time relation given by Hamilton’s geoacoustic model (1980), which was based on data from 20 areas of terrigenous sediments in the North Pacific and adjacent areas (applicable to silt, turbidites, mudstone shale):
Z = (1511 + 1041t - 372t 2)t , (4)
where t is the seismic P-wave one-way time in sec and Z is the depth below seafloor in mbsf. The theoretical BGHS on the Blake Ridge in the western Atlantic is deeper than the actual observed gas hydrate based on ODP Leg 164 drilling well data (Paull and Matsumoto 2000). Henry et al. (1999) attributed the downward shift of the BGHS (about 9 ~ 25% deeper) to capillary effects. The coring data taken from survey wells in the eastern Nankai Trough, on the other hand, indicate that the predicted depth of the BGHS is shallower than the base of the gas bearing sandstones (less than about 15%) and the depth of the BSRs (less than about 14%) (Matsumoto et al. 2004). They proposed more complicated possible mechanisms to explain the discrepancy. The present data (Table 2; Fig. 9) has shown that most of the BGHScs (17 of 23) are shallower than the depth of BSRs. The average depth of BGHSc is 304 mbsf which is about 16% shallower than that of BSR (358 mbsf). Beside the above mechanisms which may lead to error, the differences may be relevant to the uncertainties of the sedimentation rate used in Eq. 2 and the BSR depth conversion Eq. 4 (due to uncertainty of seismic velocity). We would rather have an average depth close to 304 mbsf than 358 mbsf for BSR. This will be discussed in the following section.
Contrary to the common belief that the BGHS is theoretically increasing with water depth, we found that this relation is not obvious in our examples (Fig. 10). This may be related to the fact that the seabed temperature is in a non-equilibrium state due to continuous crustal movement.
Fig. 7. Comparison of the geotherm predicted BGHS (top) with those of
sedi-mentation-corrected BGHS (bottom). Numerical values at sites ( ) are BGHS in mbsf.
Terr. Atmos. Ocean. Sci., Vol. 17, No. 4, December 2006
860
Fig. 9. Comparison of geotherm predicted BGHS with BSR (top) and BGHSc
with BSR (bottom).
Fig. 8. Trend of geotherm predicted BGHSc (sedimentation-corrected BGHS)
Fig. 10. Relationship between BGHSc and water depth. Fig. 9. (Continued)
Terr. Atmos. Ocean. Sci., Vol. 17, No. 4, December 2006
862
Fig. 11. Distribution of heat
flow estimated from BSR. Numerical values at sites are heat flow values in mW m-2.
4.3 Heat Flow Estimated from BSR
Yamano et al. (1982) first applied the base depth of BSRs to estimate heat flow in the Nankai accretionary prism, and found that heat flows estimated by the methane hydrate stabil-ity boundary diagram were almost consistent with the values measured by heat probe. The same method has been applied by others (e.g., Hyndman et al. 1993; Townend 1997; Ashi et al. 2002). The difficulties are the estimation of parameters such as the density of hydrate bearing sediments for pressure calculations and thermal conductivity for heat flow calculations. For a more detailed estimation of these parameters, refer to the article by Ashi et al. (2002). The method used here is basically similar to that initially proposed by Yamano et al. (1982) and discussed in detail by Minshull and White (1989). In the estimation of heat flows from BSRs, all previous used parameters like the temperature at the seafloor surface, thermal conductivity, density of gas hydrate bearing sediments, and the methane hydrate stability equation were adopted except the depths of BSRs being derived from Eq. 4. Accordingly, estimated heat flows increase southward and reach a maximum in a zone which is slightly eastward of that from direct measurements (Figs. 6, 11). The average heat flow estimated from the BSRs is 54 mW m-2, which is slightly below that from measurements (58 or 64 mW m-2 for sedimentation-corrected heat flow, Table 2; Fig.12). They both vary positively with water depth (Figs. 6, 11, 12, and 13). Since the dominant structural patterns in the study are fold-and-thrust structures or products of continuous collision, higher heat flows are supposed to occur reasonably. For example, if we expect to have a consistent heat flow value from heat probe measurement and from BSRs, then according to Table 2 we need to have a greater geotherm derived from BSRs or a thinner thickness of BSRs for geotherms.
Fig. 12. Geotherm predicted BGHS (top) and those with sedimentation-corrected
BGHSc (bottom) on plots of water depth versus BSR depth below seafloor. Four curves with different heat flow values represent theoretical rela-tionships between BSR depths and water depths (assuming average tem-perature on the seafloor = 2.850°C and average thermal conductivity of the sediments = 1.00 W mK-1 as shown in Table 1).
Terr. Atmos. Ocean. Sci., Vol. 17, No. 4, December 2006
864
Fig. 13. Trends of measured heat flows (top) and estimated heat flows from BSRs
(bottom) with water depth.
5. CONCLUTIONS
Twenty-three heat flow sites along pre-existing seismic profiles with obvious BSRs of offshore southwestern Taiwan were surveyed by a Lister-type high-resolution probe. Heat flows at these sites were also estimated from multi-channel seismic reflection data. The depths
of BGHSs have been predicted by the intersections between the geotherms and the gas hydrate boundary curves, which have been compared with that of BSRs. The conclusions are summa-rized as follows:
1. Through sedimentation-corrected geotherms and heat flows, both are raised to about 10% on average. The correction leads to an up-shift of the BGHS by about 11% on average. 2. The average heat flow estimated from the base depth of BSRs is 54 mW m-2, which is below
the measured heat flow of 64 mW m-2 with sedimentation-correction, on average. We would rather have a greater geotherm derived from a BSR or a thinner thickness of BSR for consis-tency considerations because 54 mW m-2 is too low on a continuous collision zone with fold-and-thrust structures. Nevertheless, they are both increasing approximately southward. 3. When comparing the depths of sedimentation-corrected BGHSs and that of BSRs, we may roughly estimate the range of BGHSs to be between about 300 to 360 mbsf. The average depth of BGHSs is 304 mbsf, which is about 16% shallower than that of BSRs in the study area. This amount of difference seems reasonable compared to previous studies.
4. Contrary to the common belief that the BGHS is theoretically increasing with water depth in our examples, we found that their relation is not obvious. This may be related to the fact that the seabed temperature is in a non-equilibrium state due to continuous crustal interaction and movement.
5. One heat flow measurement showed that there was no indication of friction heat raised temperature when the heat probe impacted on the seafloor. We surmise the ice-like solid gas hydrate has absorbed the small amount of friction heat for dissociation and is changed to a methane state. However, the statement is based on data from one measurement only, further experimentation is highly desirable.
Acknowledgements We wish to thank the efforts of electronic engineers H. I. Chang and C.
C. Lai in the construction of the high-resolution heat probes. We would like to thank L. Kubik for critical review of the earlier version of the manuscript. We are indebted to the officers, crew, and shipboard technicians of R/V Ocean Researcher I and S. D. Chiou of the Ocean Research Vessel Instrument Center for their professional assistance, which made this survey possible. This research was supported by the National Science Council of the Republic of China and the Central Geological Survey of the Ministry of Economic Affairs, Republic of China.
REFERENCES
Ashi, J., H. Tokuyama, and A. Taira, 2002: Distribution of methane hydrate BSRs and its implication for the prism growth in the Nankai Trough. Mar. Geol., 187, 177-191. Big, C. C., 1972: Dual-trench structure in the Taiwan-Luzon region. Proc. Geol. Soc. China,
15, 65-75.
Bowin, C., R. Lu, C. S. Lee, and H. Shouthen, 1978: Plate convergence and accretion in Taiwan-Luzon region. AAPG Bull., 62, 1645-1672.
Terr. Atmos. Ocean. Sci., Vol. 17, No. 4, December 2006
866
Brooks, J. M., M. C. Kennicutt II, R. R. Fay, and T. T. McDonald, 1984: Thermogenic gas hydrates in the Gulf of Mexico. Science, 225, 409-411.
Brown, K. M., N. L. Bangs, P. N. Froelich, and K. A. Kvenvolden, 1996: The nature distribution, and origin of gas hydrate in the Chile Triple junction region. Earth Planet. Sci. Lett.,
139, 471-483.
Buffett, B. A., and O. Y. Zatsepina, 1999: Metastability of gas hydrate. Geophys. Res. Lett.,
26, 2981-2984.
Bullard, E. C., 1954: The flow of heat through the floor of the Atlantic Ocean. Proc. Roy. Soc.
London, Ser. A., 222, 408-429.
Carslaw, H. S., and J. C. Jaeger,1959: Conduction of Heat in Solids, 2nd Ed., Oxford Univ. Press, London, 510 pp.
Chao, H. C., and C. F. You, 2006: Distribution of B, Cl and their isotopes in pore waters separated from gas hydrate potential areas, offshore southwestern Taiwan. Terr. Atmos.
Ocean. Sci., 17, 961-979.
Chen, Y. C., 1997: Sedimentology of surface sediments off southwest Taiwan. Ph.D. Thesis, Natl. Taiwan Univ., Taiwan, 160 pp. (in Chinese)
Chi, W. C., D. L. Reed, C. S. Liu, and N. Lundberg, 1998: Distribution of the bottom-simulat-ing reflector in the offshore Taiwan collision zone. Terr. Atmos. Ocean. Sci., 9, 779-794. Chiu, J. K., W. H. Tseng, and C. S. Liu, 2006: Distribution of gassy sediments and mud
volcanoes offshore southwestern Taiwan. Terr. Atmos. Ocean. Sci., 17, 703-722. Chow, J., J. S. Lee, R. Sun, C. S. Liu, and N. Lundberg, 2000: Characteristics of the bottom
simulating reflectors near mud diapirs: offshore southwestern Taiwan. Geo-Mar. Lett.,
20, 3-9.
Chuang, P. C., T. F. Yang, S. Lin, H. F. Lee, T. F. Lan, W. L. Hong, C. S. Liu, J. C. Chen, and Y. Wang, 2006: Extremely high methane concentration in bottom water and cored sediments from offshore southwestern Taiwan. Terr. Atmos. Ocean. Sci., 17, 903-920. Davis, E. E., R. D. Hyndman, and H. Villinger, 1990: Rates of fluid expulsion across the northern Cascadia accretionary prism: constraints from new heat flow and multichan-nel seismic reflection data. J. Geophys. Res., 95, 8869-8889.
Dholabhai, P. D., P. Englezos, N. Kalogerakis, and P. R. Bishnoi, 1991: Equilibrium condi-tions for methane hydrate formation in aqueous mixed electrolyte solucondi-tions. Can. J.
Chem. Eng., 69, 800-805.
Dickens, G. R., and M. S. Quinby-Hunt, 1994: Methane hydrate stability in seawater. Geophys.
Res. Lett., 21, 2115-2118.
Dickens, G. R., and M. S. Quinby-Hunt, 1997: Methane hydrate stability in pore water: a simple theoretical approach for geophysical applications. J. Geophys. Res., 102, 773-783. Foucher, J. P., H. Nouze, and P. Henry, 2002: Observation and tentative interpretation of a
double BSR on the Nankai Trough. Mar. Geol., 187, 161-175.
Ganguly, N., G. D. Spence, N. R. Chapman, and R. D. Hyndman, 2000: Heat flow variations from bottom simulating reflectors on the Cascadian margin. Mar. Geol., 164, 53-68. Ginsburg, G. D., R. A. Guseynov, A. A. Dadashev, E. V. Telepnev, P. Y. Askeri-Nasirov, A.
A. Yesikov, V. I. Mal’tseva, Y. G. Mashiroav, and I. Y. Shabayeva, 1992: Gas hydrates of the southern Caspian. Int. Geol. Rev., 43, 765-782.
Hamilton, E., 1980: Geoacoustic modeling of the seafloor. J. Acoust. Soc. Am., 68, 1313-1340. Handa, Y. P., 1990: Effect of hydrostatic pressure and salinity on the stability of gas hydrates.
J. Phys. Chem., 94, 2652-2657.
Handa, Y. P., and D. Stupin, 1992: Thermodynamic properties and dissociation characteris-tics of methane and propane hydrates in 70-A-radius silica-gel pores. J. Phys. Chem.,
96, 8599-8603.
Henry, P., M. Thomas, and M. B. Clennell, 1999: Formation of natural gas hydrates in marine sediments: 2. Thermodynamic calculations of stability conditions in porous marine sediments. J. Geophys. Res., 104, 23005-23020.
Horng, C. S., and K. H. Chen, 2006: Complicated magnetic mineral assemblages in marine sediments offshore of southwestern Taiwan: possible influence of methane flux on the early diagenetic process. Terr. Atmos. Ocean. Sci., 17, 1009-1026.
Hu, C. C., 1988: Basement structure and the Oligocene to Miocene stratigraphy of the Tainan Basin. Petroleum, 24, 104-115. (in Chinese)
Huang, C. Y., W. Y. Wu, C. P. Chang, S. Tsao, P. B. Yuan, C. W. Lin, and K. Y. Xa, 1997: Tectonic evolution of accretionary prism in the arc-continent collision terrane of Taiwan.
Tectonophysics, 281, 31-51.
Hyndman, R. D., E. E. Davis, and J. A. Wright, 1979: The measurement of marine geother-mal heat flow by a multipenetration probe with digital acoustic telemetry and insitu thermal conductivity. Mar. Geophys. Res., 4, 181-205.
Hyndman, R. D., K. Wang, T. Yuan, and G. D. Spence, 1993: Tectonic sediment thickening, fluid expulsion and the thermal regime of subduction zone accretionary prisms: the Cascadia margin of Vancouver Island. J. Geophys. Res., 98, 21865-21876.
Jaeger, J. C., 1965: Application of the theory of heat conduction to geothermal measurements. In: Lee, W. H. K. (Ed.), Terrestrial Heat Flow, Am. Geophys. Union, Washington, DC, 7-23.
Jiang, W. T., J. C. Chen, B. J. Huang, C. J. Chen, Y. T. Lee, P. R. Huang, C. C. Lung, and S. W. Huang, 2006: Mineralogy and physical properties of cored sediments from the gas hydrate potential area of offshore southwestern Taiwan. Terr. Atmos. Ocean. Sci., 17, 981-1007.
Kappelmeyer, O., and R. Haenel, 1974: Geothermics with Special Reference to Application. Geoexploration Monographs. Ser. 1, No. 4, Gebrueder Borntraege, Berin, 251 pp. Kastner, M., K. A. Kvenvolden, and T. D. Lorenson, 1998: Chemistry, isotopic composition,
and origin of a methane-hydrogen sulfide hydrate at the Cascadia subduction zone.
Earth Planet. Sci. Lett., 156, 173-183.
Katz, H. R., 1982: Evidence for gas hydrates beneath the continental slope, East coast, North Island, New Zealand. New Zeal. J. Geol. Geophys., 25, 193-199.
Kvenvolden, K. A., 1995: A review of the geochemistry of methane in natural gas hydrate.
Org. Geochem., 23, 997-1008.
Lewis, K. B., and J. A. Pettinga, 1993: The emerging imbricate frontal wedge of the Hikurangi margin. In: Balance, P. F. (Ed.), South Pacific Sedimentary Basins, Elsevier, Amsterdam, 225-250.
migra-Terr. Atmos. Ocean. Sci., Vol. 17, No. 4, December 2006
868
tion and its influence on sulfate reduction in the Good Weather Ridge region, South China Sea continental margin sediments. Terr. Atmos. Ocean. Sci., 17, 883-902. Liu, C. S., I. L. Huang, and L. S. Teng, 1997: Structural features off southwestern Taiwan.
Mar. Geol., 137, 305-319.
Liu, C. S., B. Deffontaines, C. Y. Lu, and S. Lallemand, 2005: Deformation patterns of an accretionary wedge in the transition zone from subduction to collision offshore south-western Taiwan. Mar. Geophys. Res., 25, 123-137.
Liu, C. S., P. Schnürle, Y. Wang, S. H. Chung, S. C. Chen, and T. H. Hsiuan, 2006: Distribu-tion and characters of gas hydrate offshore of southwestern Taiwan. Terr. Atmos. Ocean.
Sci., 17, 615-644.
Lu, H. L., and R. Matsumoto, 2001: Anion plays an more important role than cation in affect-ing gas hydrate stability in electrolytes solution? - a recognition from experimental results. Fluid Phase Equilib., 178, 225-232.
Matsumoto, R., H. Tomaru, and H. Lu, 2004: Detection and evaluation of gas hydrates in the eastern Nankai Trough by geochemical and geophysical methods. Resour. Geol., 54, 53-67.
McIver, R. D., 1974: Hydrocarbon gas (methane) in canned Deep Sea Drilling Project core samples. In: Kaplan, I. R., (Ed.), Natural gases in marine sediments: Plenum, New York, 63-69.
Minshull, T., and R. White, 1989: Sediment composition and fluid migration in the Makran accretionary prism. J. Geophys. Res., 94, 7387-7402.
Paull, C. K., and R. Matsumoto, 2000: Leg 164 gas hydrate drilling: an overview. In: Paull, C. K., R. Matsumoto, P. J. Wallace, et al. (Eds.), ODP Sci. Results, Ocean Drilling Program, College Station, Texas, 164, 3-23.
Shipley, T. H., M. H. Houston, R. T. Buffer, F. J. Shaub, K. J. Mcmillen, J. Wladd, and J. L. Worzel, 1979: Seismic evidence for widespread possible gas hydrate horizons on con-tinental slopes and rises. AAPG Bull., 63, 2204-2213.
Shyu, C. T., and H. I. Chang, 2005: Determination of seafloor temperatures using data from high-resolution marine heat probes. Terr. Atmos. Ocean. Sci., 16, 137-153.
Sloan, E. D., 1990: Clathrate hydrates of natural gases, Marcel Dekker, New York, 641 pp. Sloan, E. D., 1998: Clathrate hydrate of natural gases, 2nd Ed., Marcel Dekker, New York, 705 pp. Sun, S. C., 1982: The Tertiary basins of offshore Taiwan. Proc. 2nd ASCOPE Conf. and Exhib.,
Manila, Philippines, 125-135.
Sun, S. C., 1985: The Cenozoic tectonic evolution of offshore Taiwan. Energy, 10, 421-423. Teng, L. S., 1990: Geotectonic evolution of late Cenozoic arc-continent collision in Taiwan.
Tectonophysics, 183, 57-76.
Townend, J., 1997: Estimates of conductive heat flow through bottom-simulating reflectors on the Hikurangi and southwest Fiordland continental margins, New Zealand. Mar.
Geol., 141, 209-220.
Waseda, A., and T. Uchida, 2004: The geochemical context of gas hydrate in the eastern Nankai Trough. Resour. Geol., 54, 69-78.
Yamano, M., S. Uyeda, Y. Aoki, and T. H. Shipley, 1982: Estimates of heat flow derived from gas hydrates. Geology, 10, 339-343.
Yang, T. F., P. C. Chuang, S. Lin, J. C. Chen, Y. Wang, and S. H. Chung, 2006: Methane venting in gas hydrate potential area offshore of SW Taiwan: evidence of gas analysis of water column samples. Terr. Atmos. Ocean. Sci., 17, 933-950.
Yang, T. F., G. H. Yeh, C. C. Fu, C. C. Wang, T. F. Lan, H. F. Lee, C. H. Chen, V. Walia, and Q. C. Sung, 2004: Composition and exhalation flux of gases from mud volcanoes in Taiwan. Environ. Geol., 46, 1003-1011.
Yefremova, A. G., and N. D. Gritchina, 1981: Gas hydrates in sediments beneath seas and the problem of their exploitation. Geologiya Nefti. Gaza, 2, 32-35.
Yu, H. S., and Z. Y. Huang, 2006: Intraslope basin, seismic facies and sedimentary processes in the Kaoping slope, offshore southwestern Taiwan. Terr. Atmos. Ocean. Sci., 17, 659-677.
Zatsepina, O. Y., and B. A. Buffett, 1997: Phase equilibrium of gas hydrate: implications for the formation of hydrate in the deep seafloor. Geophys. Res. Lett., 24, 1567-1570. Zatsepina, O. Y., and B. A. Buffett, 1998: Thermodynamic conditions for the stability of gas
hydrate in the seafloor. Geophys. Res. Lett., 103, 24127-24139.
Shyu, C. T., Y. J. Chen, S. T. Chiang, and C. S. Liu, 2006: Heat flow measurements over bottom simulating reflectors, offshore southwestern Taiwan. Terr. Atmos. Ocean. Sci.,