Prevalence of overweight and obesity and its associated factors:
findings from National Nutrition and Health Survey
in Taiwan, 1993–1996
Yi-Chin Lin, Ph.D.,
aLee-Lan Yen, Sc.D.,
bSsu-Yuan Chen, M.D.,
cMei-Ding Kao, M.S.,
dMin-Su Tzeng, Dr.Ph.,
ePo-Chao Huang, M.D., D.M.Sc.,
fand Wen-Harn Pan, Ph.D.
a,*
aInstitute of Biomedical Sciences, Academia Sinica, Taipei, Taiwan
bInstitute of Health Policy and Management, National Taiwan University, Taipei, Taiwan cDepartment of Physical Medicine and Rehabilitation, National Taiwan University Hospital, Taipei, Taiwan
dDepartment of Food and Nutrition, Providence University, Taichung, Taiwan eDepartment of Nutrition and Food Sciences, Fu-Jen University, Taipei, Taiwan fDepartment of Biochemistry, College of Medicine, National Taiwan University, Taipei, Taiwan
Abstract
Background.To report the overall and regional prevalence of obesity/overweight in Taiwan and to study its associated risk factors. Methods.A total of 3046 adultsⱖ 20 years of age collected in National Nutrition and Health Survey in Taiwan, 1993–1996. Results.Prevalence rates of overweight and obesity were 21.1 and 4.0% under the current WHO definition. The prevalence rates of overweight and obesity, using the Taiwanese definition (BMI⫽ 24–26.99 kg/m2
andⱖ 27 kg/m2
, respectively), were 22.9 and 10.5% for males and 20.3 and 13.2% for females, respectively. The highest prevalence rates of obesity were found in the mountainous areas. In addition to age and residing location, education level in women and metabolic equivalent (MET) score and alcohol consumption in men were correlates of obesity. Effects of nutrition/health-related behaviors might be in part explained by education level and residing location of the subjects.
Conclusion.The prevalence of obesity defined by WHO criteria among people in Taiwan was moderate, with considerable regional variation. The regional differences in obesity prevalence could not be completely accounted for by the sociodemographic and lifestyle factors studied.
© 2003 American Health Foundation and Elsevier Inc. All rights reserved.
Keywords: Prevalence; Obesity; Overweight; Survey; Taiwan; Risk factors; Physical activity; Alcohol; Aborigines
Introduction
The increasing prevalence of obesity has become a worldwide-public health problem [1– 4]. Evidence from several national health surveys in Asia indicates that the prevalence of overweight/obesity is increasing but varies by country [5–9]. Ethnic or regional differences within the same country have also been observed [5,8]. Issues related
to the possibly high prevalence of obesity in minority pop-ulations have been raised [10].
As the economy and technology have rapidly developed and advanced over the past few decades, the lifestyles and dietary habits of the people in Taiwan have evolved toward affluence. Taiwanese are eating a diet high in fat, protein, and vitamins A and C, but low in carbohydrate, fiber, vitamin E, and calcium [11]. Mortality, incidence, and prev-alence rates of several obesity-related chronic conditions, particularly diabetes and breast cancer, have risen rapidly [12]. Nevertheless, statistics on the nationwide epidemic of overweight/obesity have not been reported according to internationally accepted criteria. Whether obesity is more
* Corresponding author. N141 Institute of Biomedical Sciences, Aca-demia Sinica, #128 Academy Rd. Sec. 2, Taipei, 11529 Taiwan. Fax:
⫹886-2-2782-3047.
E-mail address: [email protected] (W.-H. Pan).
R
Preventive Medicine 37 (2003) 233–241 www.elsevier.com/locate/ypmed
0091-7435/03/$ – see front matter © 2003 American Health Foundation and Elsevier Inc. All rights reserved. doi:10.1016/S0091-7435(03)00119-1
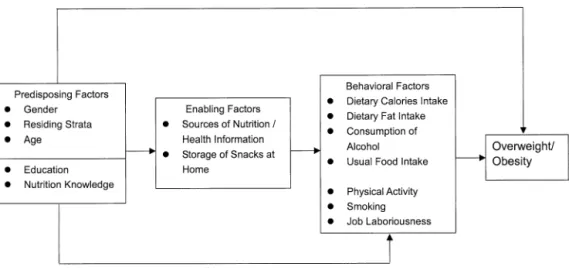
prevalent in certain regionsor minority groups in Taiwan is also a topic of interest. It has been reported that the life expectancy of the aborigines is 10 years less than that of the average of other Taiwanese, and in general, their standard-ized mortality ratios of certain cancers and cerebrovascular disease and the prevalence of hyperuricemia are signifi-cantly higher [13,14]. In the current study, we report the prevalence of overweight and obesity in Taiwan as a whole and the regional differences. The correlates contributing to the state of obesity were examined, including predisposing factors (age, gender, participants’ residing stratum, educa-tion level, and nutrieduca-tion/health-related knowledge score), enabling factors (nutrition information sources and ten-dency to store snack foods at home), and behavioral factors (dietary habits, caloric intake from alcoholic drinks, physi-cal activity, smoking status, and labor intensiveness of one’s job) (Fig. 1).
Materials and methods
Design
The data used in the current analysis were collected through the Nutrition and Health Survey in Taiwan 1993–96 (NAHSIT 1993–96). Two major groups of Taiwanese are the Fukiens and the Hakkas. They are distinguished from each other in dialects, certain dietary behaviors, and in cultural traditions. The aborigines account for about 1.7% of the total population and are thought to resemble the Malayo-Polynesians in their genetic make-up, and most of them live in the mountainous areas. The mountains cross over Taiwan longitudinally, resulting in the isolation of the east coast and its differentiation in the development. The Peng-Hu Islands are the largest archipelago off the southwest shore of Tai-wan island, and the residents there have developed a unique type of dietary habits and lifestyle of their own.
A complex sampling scheme was used in this survey
[14]. The 359 townships or city districts in Taiwan were classified into 7 strata (see Table 2) according to their dietary pattern, geographical location, and degree of ur-banization. A total of 9961 individuals, ages 4 and above, were interviewed with a response rate of 74%. Among those interviewed, 64.9% (6464 individuals) participated and completed the physical examination. In the present study, 3046 individuals, aged 20 and above, were in-cluded.
Measurements
Height without shoes and body weight in light cloth-ing were measured to the nearest 0.1 cm and 0.1 kg, respectively. Body mass index (BMI) was calculated. The terms “overweight” and “obesity” in this article are de-fined as 25 ⱕ BMI ⬍ 30 and BMI ⱖ 30 kg/m2, respec-tively. Other variables in this analysis were obtained through the questionnaires. Education level was ex-pressed as the approximate years of education. Physical activity was assessed by the frequency and average time spent on activities in the preceding month, including biking, ball games, gymnastics/punching boxing, swim-ming, aerobic dancing/country dancing, mountain climb-ing, joggclimb-ing, walkclimb-ing, gardenclimb-ing, housework, and occu-pation-related work such as moving/loading objects or mechanical assembling. The amount of physical activity was expressed by metabolic equivalent (MET) score sys-tem. One MET is approximately 3.5 ml O2/kg body wt/min. METs are used to compare the energy expendi-tures of different activities. The average MET intensity of each physical activity was assigned according to the recently published compendium [15].
A food frequency questionnaire was administered to ob-tain information on usual dietary intake and consumption of alcohol. Alcoholic drinks available in Taiwan were classi-fied into nine categories according to the concentration of alcohol. Energy consumed from alcoholic drinks (7.0 kcal/g
of alcohol) was estimated through the frequency and amount consumed in the preceding month. The labor inten-siveness of one’s job was evaluated based on a scale pre-viously developed from a self-assessed study on job char-acteristics [16]. Dietary intake assessed by the food frequency questionnaire was analyzed with SAS factorial analysis procedures using the orthogonal varimax rotation method, and the number of factors was determined based on the eigenvalue and the scree plot. As a result, six and seven gender-specific factors were included in the univariate anal-yses for males (frequencies of soymilk and preserved/fer-mented foods, animal meat products, deep-fried foods and other soy products, fruits and eggs and dairy products, smoked and uncooked meats, and vegetables) and females (frequencies of smoked/deep-fried foods/poultry, fish and lean meats and fruits, fruits and eggs and dairy products, half-fat meats and soymilk, vegetables and soy products, fermented foods, and uncooked meats), respectively.
Statistical analysis
All variables were weighted to represent the population in Taiwan [11]. The metropolitan stratum was used as the reference level wherever comparison was made between strata. Univariate logistic regression analyses were per-formed to evaluate the association between the risk of being overweight (BMI ⱖ 25 kg/m2) and the possible related factors. The factors with significant effects were entered into the multivariate analyses. A hierarchical regression approach was used to find correlates of overweight, includ-ing predisposinclud-ing factors, enablinclud-ing factors, and energy-re-lated behavioral factors. Statistical analyses were performed using SAS version 8.1 and SUDAAN version 7.5.
Results
Overall prevalence of obesity
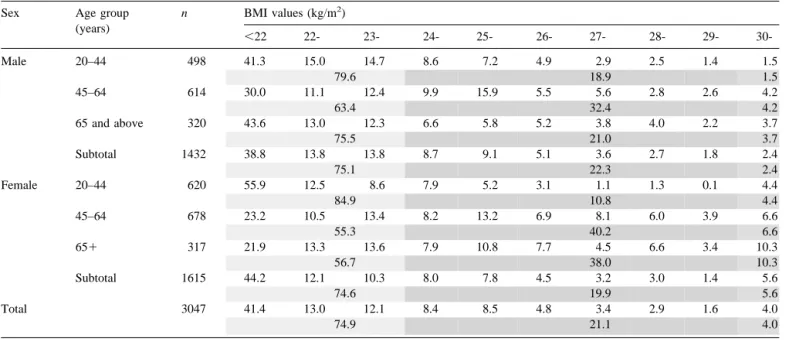
Table 1 shows the age- and gender-specific BMI distri-bution. Using the current WHO definition, 22.3% of the males and 19.9% of the females in Taiwanese adults were overweight, and the prevalence rate of obesity was 2.4% in males and 5.6% in females. There were fewer overweight women than men between the ages of 20 and 45 years, but a reversed men–women trend was observed for age group of 45– 64 years and for the 65 years and above group. There were more obese women than men in every age group. The prevalence rates of overweight and obesity, using the Tai-wanese definition (BMI ⫽ 24–26.99 kg/m2andⱖ 27 kg/ m2, respectively), were 22.9 and 10.5% for males and 20.3 and 13.2% for females, respectively.
Obesity prevalence and related characteristics by gender and by stratum
All participants were comparable in age across the strata (mean age was 41.6 years for both genders, data not shown) (Table 2). Overall, the highest prevalence rates of over-weight and obesity, according to the WHO definition, were both found in the mountainous areas of Taiwan. The prev-alence rate of overweight (i.e., BMIⱖ 25 kg/m2) was higher than 50% in the mountainous regions in both genders. In addition, the prevalence rates of obesity in females of the Peng-Hu Islands and of the provincial cities and class I townships were significantly higher than that of the metro-politan cities.
People in the metropolitan cities had more years of
Table 1
Percentage distribution of BMI by sex and age group (%)
Sex Age group
(years) n BMI values (kg/m2) ⬍22 22- 23- 24- 25- 26- 27- 28- 29- 30-Male 20–44 498 41.3 15.0 14.7 8.6 7.2 4.9 2.9 2.5 1.4 1.5 79.6 18.9 1.5 45–64 614 30.0 11.1 12.4 9.9 15.9 5.5 5.6 2.8 2.6 4.2 63.4 32.4 4.2 65 and above 320 43.6 13.0 12.3 6.6 5.8 5.2 3.8 4.0 2.2 3.7 75.5 21.0 3.7 Subtotal 1432 38.8 13.8 13.8 8.7 9.1 5.1 3.6 2.7 1.8 2.4 75.1 22.3 2.4 Female 20–44 620 55.9 12.5 8.6 7.9 5.2 3.1 1.1 1.3 0.1 4.4 84.9 10.8 4.4 45–64 678 23.2 10.5 13.4 8.2 13.2 6.9 8.1 6.0 3.9 6.6 55.3 40.2 6.6 65⫹ 317 21.9 13.3 13.6 7.9 10.8 7.7 4.5 6.6 3.4 10.3 56.7 38.0 10.3 Subtotal 1615 44.2 12.1 10.3 8.0 7.8 4.5 3.2 3.0 1.4 5.6 74.6 19.9 5.6 Total 3047 41.4 13.0 12.1 8.4 8.5 4.8 3.4 2.9 1.6 4.0 74.9 21.1 4.0
education than all other strata. Males in the stratum of class II townships and females in the mountainous areas con-sumed more alcoholic drinks, whereas the total dietary calories, obtained through 24-h dietary recall method (par-ticipants ages 20 – 64 years only), was not significantly different across all strata. On the other hand, people in the mountainous areas and the east coast regions had higher mean MET scores than people in the metropolitan cities, and the jobs they engaged in seemed to be more labor intensive. The smoking status was generally indifferent among males across all strata, except that there were more male everyday smokers in the Hakka areas and the provin-cial cities/class I townships than in the metropolitan cities. In every stratum most females claimed they’ve never smoked. There was no significant difference in percentage of body fat across the strata for both genders except that the females in the east coast had a significantly higher percent-age of body fat than their counterpart in the metropolitan cities (30.5% vs 27.7%, P⬍ 0.05, data not shown).
Correlates of overweight and obesity
The study framework is illustrated in Fig. 1. In our proposed model, the demographic factors, education level, and nutrition/health knowledge are considered predisposing factors and may have direct or indirect influence on the development of overweight/obesity. “Enabling Factors” are factors that encourage or inhibit the implementation of the
behavior, including the availability of resources. “Behav-ioral Factors” include factors that are directly related to the energy balance. The hierarchical multivariate analyses were performed to examine on the determinants of overweight risk. Results of age-adjusted univariate analysis for each variable, except age itself and the residing stratum, were also listed in the left column below Model 1 through Model 3 (Table 3A and 3B). The first model examined the effects of the predisposing factors (age, participants’ residing stra-tum, education level, and nutrition/health-related knowl-edge score). In males, the effect of age on the risk of being overweight was nearly significant (P⫽ 0.05). Living in the mountainous areas significantly increased the risk. Both the years of education and nutrition/health knowledge scores were nearly significant. In females, age, strata, and years of education were also significant predisposing factors. Al-though the nutrition/health-related knowledge score itself was significantly associated with the risk (age-adjusted odds ratio⫽ 0.86, P ⬍ 0.05), it was not independent of the effect of education and approached nonsignificance in the multiple regression model.
Neither of the enabling factors was associated with over-weight/obesity in males, but the number of nutrition infor-mation sources (odds ratio⫽ 0.85, P ⬍ 0.05) and storage of snacks at home (odds ratio ⫽ 0.93, P ⬍ 0.05) were each significantly inversely associated with the overweight/obe-sity risk in females after age was adjusted. These enabling factors (number of nutrition/health-related information
Table 2
Prevalence of overweight/obesity, distribution of ethnic group, years of education, MET score, dietary calories, and alcohol consumption by gender and stratum
Stratum n Overweighta Obesitya Ethnic groupb(%) Education
(years)
MET score Dietary caloriesc (kcal/day) Alcohol (g/month) Labor intensivenes of jobd Smoking statuse(%)
% (95% CI) % (95% CI) Hakka Aborigines Mean (SE) Mean (SE) Mean (SE) Mean (SE) Mean (SE) N Q NE E
Males Metropolitan Cities 211 21.8 (17.4, 26.2) 1.9 (0.6, 3.3) 7.0 0 11.9 (1.0) 7.9 (0.7) 2158 (1235) 312 (39) 0.34 (0.19) 37.6 15.0 5.3 42.2 East Coast 209 28.9 (18.3, 39.5) 5.0 (2.3, 7.8) 46.2 11.9 9.2* (0.40 18.3** (2.7)* 2455 (1363) 681 (263) 1.25* (0.20) 34.4 9.4 1.1 55.0 Hakka Areas 205 19.9 (14.2, 25.6) 1.1 (0, 3.2) 89.7 0 10.0 (0.6) 9.9 (2.1) 2222 (1447) 299 (92) 0.82 (0.13) 27.9 12.6 3.5 56.0* Mountainous Areas 224 42.5* (33.0, 52.0) 10.0 (1.9, 18.2) 2.5 84.1 8.5* (0.6) 20.1* (4.1) 2384 (1583) 609 (161) 1.84** (0.10) 34.4 11.0 3.5 51.1 Peng-Hu Islands 198 21.1 (16.4, 25.8) 2.3 (0, 4.8) 0.3 0 9.3* (0.5) 6.1 (1.0) 2092 (1100) 542 (180) 0.82 (0.29) 35.4 13.0 2.0 49.7 Provincial Class If 183 21.9 (16.5, 27.3) 3.1 (0.7, 5.4) 11.9 0.3 9.0* (0.5) 9.5 (1.7) 2115 (1302) 317 (76) 1.05* (0.15) 28.6 21.8 5.5 44.0 Provincial Class IIf 202 22.6 (10.6, 34.6) 1.7 (0, 3.5) 2.3 0.3 8.6* (0.7) 11.7 (2.0) 2309 (1244) 545* (58) 1.05 (0.28) 28.9 13.3 3.3 54.5* Total 1432 22.4 (17.6, 27.2) 2.4 (1.3, 3.6) 9.5 (0.4) 10.2 (1.0) 2203 (1280) 416 (38) 0.91 (0.13) 30.6 16.8 4.5 48.2 Females Metropolitan Cities 221 17.9 (15.5, 20.3) 1.9 (0, 4.0) 6.7 0.4 10.0 (0.3) 6.5 (0.4) 1764 (2233) 6 (2) ⫺0.30 (0.21) 94.7 0.0 0.7 4.6 East Coast 235 30.7** (26.9, 34.5) 5.7 (1.4, 9.9) 31.1 21.6 6.9** (0.6) 12.1* (2.2) 1615 (945) 156 (104) 0.73* (0.31) 90.7 1.0 1.4 7.0 Hakka Areas 227 22.3 (18.6, 26.0) 4.1 (2.3, 6.0) 80.5 0.8 8.4* (0.2) 7.2 (0.9) 1545 (951) 2 (2) 0.07 (0.11) 99.3 0.0 0.7 0.0** Mountainous Areas 249 32.0** (29.9, 34.1) 23.1* (13.4, 32.8) 1.1 91.1 7.1** (0.4) 16.8* (1.9) 1559 (909) 85* (21) 1.68** (0.09) 84.1 2.2* 4.4 9.3 Peng-Hu Islands 237 26.5 (18.7, 34.3) 7.2* (4.6, 9.9) 1.9 1.5 6.1** (0.7) 7.6 (0.7) 1519 (795) 10 (4) 0.64* (0.30) 94.6 0.3 1.5 3.6 Provincial Class If 207 18.7 (16.9, 20.5) 8.2** (6.5, 9.9) 15.1 1.1 8.4* (0.4) 7.4 (0.4) 1488 (712) 7 (1) 0.05 (0.19) 95.3 1.1 1.6 2.0 Provincial Class IIf 239 21.5 (15.1, 27.9) 4.3 (1.8, 6.9) 5.5 1.3 6.8** (0.2) 9.00 (1.6) 1614 (880) 9 (4) 0.82* (0.19) 93.9 2.7 0.3 3.2 Total 1615 19.9 (17.5, 22.3) 5.6 (4.4, 6.8) 8.2 (0.2) 7.9 (0.6) 1591 (1247) 10 (2) 0.27 (0.12) 94.6 1.4 1.0 3.0
* Significantly different from the metropolitan cities stratum, P⬍ 0.05. ** P⬍ 0.001.
aOverweight, BMIⱖ 25 but less than 30 kg/m2; obesity, BMIⱖ 30 kg/m2.
bOther ethnic groups, including Fukiens, Mainlanders, and others, which are all Han people.
cAverage daily dietary calories from 24-h dietary recall (adults 20 – 64 versus old only), alcoholic drinks not included. dNumerical indicator of the degree of labor intensiveness of one’s job based on occupation and job title.
eSmoking status upon being interviewed. N, never smoked; Q, already quitted; NE, current not-everyday smokers; E, everyday smokers. fProvincial cities/urbanization class I cities and townships, and urbanization class II cities and townships.
sources and store snacks at home) were then hierachically entered in Model 2, with all significant predisposing factors included in the model. In males, living in the mountainous regions remained a significant factor, and no association was found between either of the enabling factors and the risk of being overweight/obesity. In females, age, strata, and years of education remained significant factors, but the association with enabling factors became nonsignificant.
Most behavioral factors (dietary calories, dietary fat, consumption of alcoholic drinks, usual food intake habits, physical activity, smoking status, and the degree of labor intensiveness of one’s job) we studied were not significantly associated with the risk of being overweight/obesity in the age-adjusted model except frequent consumption of un-cooked meats (odds ratio⫽ 0.73, P ⬍ 0.05), past smoking (already quitted currently) (odds ratio⫽ 96.03, P ⬍ 0.05), and current everyday smoking (odds ratio⫽ 0.10, P ⬍ 0.05) in females. In Model 3, behavioral factors related to energy balance were entered after significant predisposing factors and enabling factors. Neither dietary total calories nor ca-loric intake from dietary fat, obtained using the 24 h recall method in participants between 20 and 64 years old, was significantly related to the risk of overweight in the
age-adjusted univariate analysis; therefore these two variables were not included in the multivariate modeling procedures. There were no usual intake factors, obtained from food frequency questionnaire by factorial analysis, entered into the model for males since none of the factors significantly related to the risk of overweight in the univariate analyses. After the effects of age and strata were adjusted, caloric intake from alcoholic drinks significantly associated with the risk of overweight in males, and the MET score was inversely associated with the overweight risk at a level of borderline significance (odds ratio⫽ 0.98; 95% CI ⫽ 0.95– 1.00, P ⫽ 0.07). Compared to those who never smoked, current everyday smokers seemed to be at less risk of being overweight, only the effect was not statistically significant. The labor intensiveness of one’s job had no significant effect. In females, age, strata, and education level remained significant factors, whereas frequent consumption of uncooked meats, obtained from FFQ using factorial analyses, inversely associ-ated with the risk. Caloric intake from alcoholic drinks in-creased the risk, but the effect did not reach a statistical sig-nificance. Past smokers who already quit and current not-everyday smokers were both at greater risk of being overweight/obesity, whereas current everyday smokers had a
Table 3A
Multivariate analysis on risk of overweight/obesity for adult malesa(odds ratio)
Variable Model 1 (n⫽ 1320) Model 2 (n⫽ 1432) Model 3 (n⫽ 1272) Model 4 (n⫽ 1363)
Age Stratum 1.02† 1.02* 1.02* 1.02* Metropolitan citiesb 1.00 1.00 1.00 1.00 East Coast 1.69 1.55 2.17* 2.18* Hakka 0.74 0.79 0.90 0.81 Mountainous 3.79* 3.52* 4.36* 4.94* Peng-Hu Islands 0.91 0.89 0.88 0.88 Provincial class I 1.06 1.05 1.20 1.26 Provincial class II 0.96 0.98 0.96 1.05 Years of education 0.97 0.96
Nutrition knowledge score 0.99 1.04
Nutrition information sources 0.96 0.97
Home storage of snacks 0.95 0.96
Calories from alcoholc
Heavy 1.89 2.96* 2.85* Light-Moderate 1.05 1.32 1.40* Nullb 1.00 1.00 1.00 MET score 0.98 0.98† 0.98* Smoking status Neverb 1.00 1.00 Already quit 0.94 0.89
Not every day 1.31 1.18
Every day 0.90 0.85
Laboriousness of job
Lowb 1.00 1.00
High 0.99 1.24
Variance explained by model 3.41% 2.77% 4.66% 4.78%
* P⬍ 0.05.
†0.05⬍ P ⬍ 0.1.
aResults of multivariate analysis. bReference level.
cHeavy, daily calories from alcoholic drinks greater than the 95th percentile (482.3 kcal/day); medium, daily calories from alcoholic drinks between zero
lower risk, but these effects of smoking on the overweight/ obesity risk were not statistically significant. Both physical activity and the labor intensiveness of one’s job were not associated with the risk of overweight/obesity in females.
Factors with statistical significance or borderline signif-icance were entered into the final models (Model 4). In males, living in the east coast areas and mountainous re-gions, older age, and higher caloric intake from alcoholic drinks increased the risk, whereas a higher a MET score provides some protection. In females, strata and age signif-icantly associated with the risk, whereas more years of education appeared to be protective. The inverse association between frequent consumption of uncooked meats and the risk was not significant (odds ratio ⫽ 0.79, 95% CI ⫽ 0.60 –1.05, P⫽ 0.10) in the final model.
Discussion
According to the WHO definition, the prevalence rate of overweight in Taiwanese adults aged 20 – 64 years (22.3%
in males, 18.3% in females) was similar to that of Malaysia metropolitans (23.9% in males, 17.5% in females) and mid-dle-aged Japanese (24.3% in males, 20.2% in females) (Ta-ble 4). The people in Taiwan and the Chinese in Hong Kong were comparable in the prevalence of obesity (2.3% and 2.2% in males, 5.0% and 4.8% in females), which was slightly higher than that in Japan (1.9% in males, 2.9 in females) and the Philippines (1.7% in males, 3.4% in fe-males) and of 20 to 45-year-old rural (0.5% in males, 0.7% in females) or metropolitan (1.0% in males, 1.7% in fe-males) Mainland Chinese [5] (Table 4). This may reflect a closer resemblance to Chinese in Hong Kong but greater differences from those in the rural areas of Mainland China in lifestyles, types of occupation, economic development, degree of modernization, and other social factors such as education. It is also not clear whether the difference among these Asian countries is due to an environmental difference, an ethnic effect, or a combined effect.
Our data reveal that there are regional differences in the risk of being overweight and obesity in Taiwan, with the
Table 3B
Multivariate analysis on risk of overweight obesity for adult femalesa(odds ratio)
Variable Model 1 (n⫽ 1417) Model 2 (n⫽ 1541) Model 3 (n⫽ 1364) Model 4 (n⫽ 1505)
Age 1.05* 1.02* 1.03* 1.02* Stratum Metropolitan cities 1.00 1.00 1.00 1.00 East Coast 2.11* 1.66* 1.56† 1.63* Hakka 1.33 1.24 1.01 1.19 Mountainous 4.56 4.74* 3.62* 4.50* Peng-Hu Islands 1.74 1.18 0.97 1.12 Provincial class I 1.61 1.31 1.08 1.28 Provincial class II 1.28 0.97 0.83 0.94 Years of education 0.89* 0.90* 0.90* 0.90* 0.89*
Nutrition knowledge score 0.86* 0.93
Nutrition information sources 0.85* 0.94
Home storage of snacks 0.93* 0.96
Dietary intake by FFQb
Uncooked meats 0.73* 0.64* 0.79†
Calories from alcoholc
Heavy 1.96 1.77 Light–Moderate 1.09 1.33 Nulld 1.00 1.00 MET score 1.01 1.00 Smoking status Neverd 1.00 1.00 Already quit 96.03* 1.39
Not every day 3.97 3.08
Every day 0.10* 0.40
Laboriousness of job
Lowd 1.00 1.00
High 1.80 1.36
Variance explained by model 13.0% 12.2% 13.4% 11.9%
* P⬍ 0.05.
†0.05⬍ P ⬍ 0.1.
aResults of multivariate analysis.
bVariables are selected from the results of factorial analysis; FFQ, food frequency questionnaire.
cHeavy, daily calories from alcoholic drinks greater than the 95th percentile (28.7 kcal/day); medium, daily calories from alcoholic drinks between zero
and the 95th percentile; null, no calories from alcoholic drinks.
highest prevalence observed in the mountainous areas, where most of the aborigines reside (Table 2). It has been demonstrated that a lower level of education is a potential risk factor for obesity [19,20], and regular physical activity is protective by increasing energy expenditure, reducing fat mass, and increasing lean muscle mass [21]. In our national survey data, people in the mountainous areas and east coast regions appeared to have higher MET scores, higher intake of alcoholic drinks, and lower education level, thus the phenomenon of regional variation in the prevalence of obe-sity cannot be completely explained by the variation in education level and physical activity between the mountain-ous areas and other regions, as these two variables only explain 3.07% of the variance in the risk of being over-weight/obesity in males.
The association between physical activity and the risk of being overweight/obesity (BMIⱖ 25 kg/m2) was significant in males but not in females. It is possible that the range of MET is too small in women for physical activity to exhibit a sizable effect. On the other hand, it has been suggested by Farmer et al. that there may be a gender difference in reporting physical activity because of cultural expectations and habits [22]. In epidemiological studies, the development and validation of many physical activity questionnaires mainly focus on men, thus the use of such questionnaires may not adequately reflect certain type of activities that women primarily engaged in, such as housework [23].
The mean caloric intake from alcoholic beverages was highest in the mountainous regions and the east coast areas. The effect of alcohol consumption on the development of overweight/obesity was independent of age and geographi-cal location in Taiwanese males. A similar trend was also observed in females, but it was less influential and was not statistically significant. In our female subjects, more than 85% reported themselves as nondrinkers, and the 95th per-centile value of caloric intake of alcoholic drinks was only
28.7 kcal/day (4.1 g/day of alcohol). This insignificant ef-fect of alcohol consumption may be due to the very small number of female drinkers compared to the majority of nondrinkers.
In our analysis, the nutrition-health related factors, in-cluding nutrition knowledge, number of nutrition/health-related information sources, and storage of snacks at home, adjusted for age, were all inversely associated with the risk of being overweight in females. The significance no longer existed in the multivariate analysis when strata and years of education were also included, which suggested that the effects of these nutrition/health-related behaviors were par-tially explained by where the participant lived (availability and accessibility of knowledge/information and foods) and education level.
It is recognized that obesity is the result of accumulation of excessive energy storage due to long-term imbalance between calories intake and energy expenditure. In this national survey, dietary intake was evaluated by the 24-h dietary recall method, which may not reflect the usual intake level of the individuals. The mean caloric intake from foods did not vary across strata [11]. In addition, the dietary intakes of total energy and other macronutrients did not significantly associate with overweight risk in our regres-sion models and this may be due to their huge day-to-day variations (data not shown). The effects of usual dietary intake patterns, obtained from dietary FFQ, on the risk of overweight were also examined. The results of univariate analyses showed no relationship between risk of being over-weight and any usual intake patterns in males, whereas in females frequent consumption of uncooked meats, adjusted for age, was the only factor inversely associated with the risk. The significance remained when the predisposing fac-tors and other behavioral facfac-tors were all included in the multivariate model, but disappeared in the final model in which only age, strata, and education level were also
con-Table 4
Prevalence of overweight/obesity in Asia
Country Age group (years) N Overweight (BMI 25–30) (%) Obesity (BMI⬎ 30) (%) Reference
Male Female Male Female
Taiwan 20–64 (Overall) M 1112 22.3 18.3 2.3 5.0 Current study
F 1298
20–64 (Metro cities) M 167 22.3 17.4 2.2 1.2 Current study
F 180
(Mountainous area) M 171 44.6 34.8 11.7 25.7
F 193
China 20–45 Metro 12.3 Metro 14.4 Metro 1.0 Metro 1.7 5
Rural 5.3 Rural 9.8 Rural 0.5 Rural 0.7
Japan 35–64 12926 24.3 20.2 1.9 2.9 9
Malaysia 18–60 Metro 23.9 Metro 17.5 Metro 5.6 Metro 8.8 8
Rural 12.9 Rural 19.6 Rural 1.8 Rural 2.6
ⱖ18 31097 16.6 4.4 17
Philippine ⱖ20 M 4588 12.7 15.2 1.7 3.4 18
F 4997
Thailand ⱖ20 13300 12.0 19.5 1.7 5.6 7
sidered. Further comparison had been made to examine if the females who consumed uncooked meats differ from those who did not in several factors we studied. It appeared that women who consumed uncooked meats had a border-line significantly higher intake of alcoholic drinks per day
(P⫽ 0.08) and 2.14 more years of education (P ⫽ 0.0004)
than those who did not eat uncooked meats. Whether the consumption of uncooked meats was a surrogate of a spe-cific type of lifestyle that might protect from weight gain and the types and sources of the uncooked meats need to be further investigated.
Smoking is a known factor inversely associated with weight gain, but did not significantly explain the risk of being overweight in our study. Although there was a 15 and 60% decrease in the risk of being overweight in males and females who were current everyday smokers compared to those who never smoked, this negative effect of current smoking on overweight risk was not statistically significant. The results of age-adjusted univariate analyses showed that past smokers were at remarkably increased risk of being overweight, whereas current everyday smoking exhibited an inverse relation with the obesity risk. Current but not ev-eryday smoking also increased the risk of being overweight, although not in a statistically significant way. No effect of current smoking status on the overweight risk was observed when strata, education level, and other behavioral factors were all considered in the multivariate model. In the female participants more than 94% claimed they never smoked. The nonsignificance of the smoking effects on the over-weight risk may be due to the small numbers of female participants with smoking experience in our study.
The higher prevalence of overweight and obesity among the aboriginal people are consistent with findings of minor-ities in other countries [10]. In Taiwan the aboriginal pop-ulation is relatively small, and it is known that genetically they are related to the Malayo-Polynesians. Recently, Chang and colleagues reported that these mountainous ab-origines have a notable higher prevalence of hyperuricemia, which cannot be completely explained by BMI, alcohol intake, and other factors [14]. The effect of mountainous stratum on overweight risk remained significant in both genders even after the effects of age and/or education, and/or other enabling or behavioral factors had been ad-justed. It is unclear if this is due to an underprivileged environment or to genetic factors.
Although BMI is a widely accepted method for over-weight and obesity screening, it may not reflect true body composition and the distribution of body fat. In our analysis, the percentage of body fat was not remarkably different across the strata except the females in the east coast areas (data not shown), thus could not explain the regional dif-ference in the prevalence of overweight/obesity. It has been suggested that the distribution of body fat may be more closely related to certain diseases than high BMI [24,25] and that it should be carefully evaluated when studying obesity-related disorders.
In summary, our current analysis showed a high preva-lence of overweight and obesity among people who live in the mountainous areas in Taiwan. This phenomenon may only be partially attributable to the effects of age and edu-cation. In males, physical activity appeared to be protective, whereas caloric intake from alcoholic drinks significantly increased the risk of being overweight. In females, higher level of education is a strong protective factor. More than one-third of the population had a BMI greater than 24 kg/m2 (the newly defined cutoff point for overweight in Taiwan). Although the overall prevalence rate of obesity in Taiwan is moderate (2.4% in males and 4% in females, respectively), based on the definition by WHO, the incidence rates of diabetes and breast cancer have elevated in recent years. Studies have suggested that the risk of obesity in Asians may be higher than that of other ethnic groups at the same BMI cutoff points [6,26]. The small percentage of variation explained by factors we studied (4.78% in males and 11.9% in females, respectively; Model 4 in Tables 3A and 3B) indicated that further studies are required to examine the causes of the high overweight/obesity prevalence in Tai-wanese aborigines, and the possibility of a differential dis-ease/obesity relationship between Asians/Chinese and other ethnic groups, focusing on the role of percentage of body fat and fat distribution in obesity-related disorders.
Acknowledgments
The authors thank Dr. Hsing-Yi Chang, Division of Health Policy Research, National Health Research Insti-tutes, Taipei, Taiwan, for her advice on statistical analyses. Appreciation also goes to all the field workers and those who helped organize and coordinate the field work in every survey site. The survey was sponsored by Department of Health in Taiwan (DOH FN8202, 84-FS-11, DOH-85-FS-11, DOH-86-FS-11).
References
[1] Kannel WB, D’Agostino RB, Cobb JL. Effect of weight on cardio-vascular disease. Am J Clin Nutr 1996;63(Suppl 4):19 –22. [2] Carroll KK. Obesity as a risk factor for certain types of cancer. Lipids
1998;33:1055–9.
[3] Alberti KG, Zimmet PZ. Definition, diagnosis and classification of diabetes mellitus and its complications. Part 1: diagnosis and classi-fication of diabetes mellitus provisional report of a WHO consulta-tion. Diabet Med 1998;15:539 –53.
[4] World Health Organization. Obesity: Preventing and managing the global epidemic. Geneva: WHO, 1998.
[5] Ge K. Body mass index in young Chinese adults. Asia Pacific J Clin Nutr 1997;6(3):175–9.
[6] Ko GT, Chan JC, Woo J, Lau E, Yeung VT, Chow CC, et al. Simple anthropometric indexes and cardiovascular risk factors in Chinese. Int J Obes 1997;21:995–1001.
[7] Chuprapavam J 1996. [First report on survey of health status in Thai populations by questionnaires and physical examination, 1991–92] (in Thai). Bangkok: Institute of Public Health.
[8] Ismail MN, Zawiah H, Chee SS, Ng KK. Prevalence of obesity and chronic energy deficiency (CED) in adult Malaysians. Mal J Nutr 1995;1:1–9.
[9] Yoshiike N, Matsumura Y, Zaman MM, Yamaguchi M. Descriptive epidemiology of body mass index in Japanese adults in a represen-tative sample from the National Nutrition Survey 1990 –94. Int J Obes 1998;22:684 –7.
[10] Kumanyika SK. Special issues regarding obesity in minority popula-tions. Ann Intern Med 1993;119:650 – 4.
[11] Pan W-H, Chang Y-H, Chen J-Y, Wu S-J, Tzeng M-S, Kao M-D. Nutrition and Health Survey in Taiwan (NAHSIT) 1993–1996: di-etary nutrient intakes assessed by 24-hour recall. Nutr Sci J 1999;24: 11–39.
[12] Department of Health. Vital statistics: mortality in Taiwan. Health and vital statistics, vol. 2. Taipei, author, 1999.
[13] Ko Y-C, Liu B-H, Hsieh S-F. Issues on aboriginal health in Taiwan. Kaohsiung J Med Sci 1994;10:337–51.
[14] Chang H-Y, Pan W-H, Yeh W-T, Tsai K-S. Hyperuricemia in Tai-wan: results from the nutritional and health survey in Taiwan (1993-1996). J Rheumatol 2001;28:1640 – 6.
[15] Ainsworth BE, Haskell WL, Whitt MC, Irwin ML, Swartz AM, Strath SJ, et al. Compendium of physical activities: an update of activity codes and MET intensities. Med Sci Sports Exerc 2000;32(9 Suppl): S498 –516.
[16] Huang Y-J. Job characteristics, job rewards, class consciousness, and job satisfaction: research report. Taipei: National Science Council, Executive Yuan, 1998.
[17] Fatimah S, Tahir A, Siti Sa’adiah HN, Maimunah H. Nutritional
status of adults aged 18 years and above. Kuala Lumpur: National Health and Morbidity Survey (NHMS), Vol. 14, 1997.
[18] International Diabetes Institute. The Asia-Pacific Perspective: rede-fining obesity and its treatment in Asian-Pacific region. London: International Obesity Task Force, 1999.
[19] Bray GA. Nutrition and obesity: prevention and treatment. Nutr Metab Cardiovasc Dis 1999;9(4 Suppl):21–32.
[20] Martinez JA, Kearney JM, Kafatos A, Paquet S, Martinze-Gonzalez MA. Variables independently associated with self-reported obesity in the European Union. Public Health Nutr 1999;2:125–33.
[21] Tremblay A. Physical activity and obesity. Baillieres Clin Endocrinol Metab 1999;13:121–9 doi:10.1053/beem.1999.0010.
[22] Farmer ME, Locke BZ, Moscicki EK, Dannenberg AL, Larson DB, Radloff LS. Physical activity and depressive symptoms: the NHANES I Epidemiologic Follow-up Study. Am J Epidemiol 1988; 128:1340 –51.
[23] Blair SN, Kohl 3rd HW, Paffenbarger Jr RS, Clark DG, Cooper KH, Gibbons LW. Physical fitness and all-cause mortality: a prospective study of healthy men and women. J Am Med Assoc 1989;262:2395– 401.
[24] Blaauw R, Albertse EC, Hough S. Body fat distribution as a risk factor for osteoporosis. South Afr. Med. J. 1996;86:1081– 4. [25] Bjo¨rntorp P. The association between obesity, adipose tissue
distri-bution and disease. Acta Med Scand 1988;723:121–34.
[26] Deurenberg-Yap M, Yian TB, Kai CS, Deurenberg P, van Staveren WA. Manifestation of cardiovascular risk factors at low levels of body mass index and waist-to-hip ratio in Singaporean Chinese. Asia Pacific J Clin Nutr 1999;8:177– 83.