ANALYTICA
CHIMICA
ACTA
Analytica Chimica Acta 351 (1997) 49-55ELSEVIER
Determination
of puerarin, daidzein, paeoniflorin, cinnamic acid,
glycyrrhizin, ephedrine, and [6]-ginger01 in Ge-gen-tang by
micellar electrokinetic
chromatography
Hsi-Ya Huang, You-Zung Hsieh*
Department of Applied Chemistry, National Chiao Tung University, Hsinchu, Taiwan, ROC Received 23 December 1996; received in revised form 26 March 1997; accepted 6 May 1997
Abstract
This paper presents a micellar electrokinetic chromatography (MEKC) method with diode-array detection to analyze for seven major components in the traditional Chinese medicinal preparation of Ge-gen-tang. Those analytes were successfully separated within 9 min using a pH 9.0 borate buffer containing 20 mM Sodium dodecyl sulfate at 30°C. Experimental results indicated that the relative standard deviations of the analytes’ migration times were ~0.43% and the correlation coefficients of the analytes’ linear calibration graphs exceeded 0.996. The quantities of the seven components in four different Ge-gen-tang samples were determined by the MEKC method coupled with a relatively simple extraction method. 8 1997 Elsevier Science
B.V.
1. Introduction
Ge-gen-tang (Pueraria Combination) is a traditional Chinese medicinal preparation of Puerariae radix (named as ‘Ge-gen’ in Chinese) combined with other crude herbs. Among those herbs include Paeoniae radix, Cinnamomi ram&us, Glycyrrhizae radix, Ephe- drae herba, Zingiberis rhizoma, and Zizyphi fructus [ 11. The medicine is frequently used to treat diseases such as the common cold, influenza, neuralgia, and shoulder stiffness. Traditional Chinese medicine has become increasingly popular in recent years owing to the advantages of low toxicity and rare complications. Moreover, the extracted medicine powder from crude
*Corresponding author. Tel.: +886-3-5712121 ext 56532; fax: +886-3-5723764; e-mail: [email protected].
herb preparations makes Chinese medicine taking much more convenient than with the traditional time-consuming preparation process of Chinese med- icine. However, knowledge regarding the composition of bioactive ingredients in Chinese medicinal prepara- tions is limited. Therefore, establishing an appropriate analytical method is necessary to investigate the active ingredients and quality of complicated Chinese medicinal preparations.
Seven major components of those crude herbs constituting Ge-gen-tang were selected as the target analytes. Puerarin and daidzein are isoflavonoid com- pounds of Puerariae radix. Their pharmaceutical effects on biological action have been examined [2,3]. Paeoniflorin, cinnamic acid, glycyrrhizin, ephe- drine, and [6]-ginger01 are the major components in Paeoniae radix, Cinnamomi ramulus, Glycyrrhizae 0003-2670/97/$17.00 0 1997 Elsevier Science B.V. All rights reserved.
50 H.-K Huang, K-Z. HsiehIAnalytica Chimica Acta 351 (1997) 49-55
radix, Ephedrae herba, and Zingiberis rhizoma,
respectively [2]. Those compounds have been studied for their potential pharmaceutical activities, Pre- viously, liquid chromatography (LC) was employed to determine puerarin and daidzein in various samples containing Puerariae radix [3-6]. The separation
usually lasted more than 30 min.
Micellar electrokinetic chromatography (MEKC), a modified capillary electrophoresis (CE) technique, has been extensively applied to separate various com- pounds including neutral and hydrophobic compounds [7-lo]. Among the advantages of MEKC technique are high resolution, high separation efficiency, rapid analysis, and a minute sample requirement. A few Chinese crude drug and medicinal preparations have been analyzed by MEKC methods [ll-141. Buffers employed in those studies contained either sodium dodecyl sulfate (SDS) or bile salts to form micelles. Cyclodextrins or organic solvents were found to effec- tively improve the separation efficiency for these relatively hydrophobic Chinese medicine [ 13,141. However, those studies only focused on analyzing for compounds from one or two crude herbs [l l-141. Because Chinese medicinal preparations are fre- quently composed of several crude herbs, a compre- hensive analysis of marker analytes for each crude herb is necessary to study complicated Chinese med- icinal preparations.
In this study, we employed a MEKC method to simultaneously determine seven analytes in the Chi- nese medicinal preparation of Ge-gen-tang. The effects of buffer pH values and SDS concentrations on the analytes’ migration behavior were examined. Moreover, the extraction efficiencies of different extraction solutions were discussed. Four concen- trated commercial Ge-gen-tang preparations were analyzed under the optimized MEKC conditions.
2.
Experimental
2.1.
ApparatusAll experiments were performed on a Beckman P/ ACE 5500 capillary electrophoresis system (Fullerton, CA). The diode-array detector can scan wavelengths from 190 to 600 nm. In addition, the detection wave- length can be programmed to alter during the separa-
tion process. Separation was performed in a 47 cm (40 cm to detector) x 50 pm id. fused silica capillary tube (Polymicro Technologies, Phoenix, AZ). The capillary column was assembled in a cartridge format and the temperature was maintained by a thermostated system. Samples were pressure injected at 0.5 p.s.i. (0.034 bar). The voltage of the electrophoresis separa- tion was 20 kV. A personal computer was used to control the P/ACE instrument and to perform data analysis using System Gold software (Beckman). 2.2. Chemicals
Sodium dodecyl sulfate (SDS), borax (sodium borate), boric acid, and (-)-ephedrine hydrochloride were purchased from Sigma (St. Louis, MO). Cin- namic acid and glycyrrhizin were bought from Nacalai Tesque (Kyoto, Japan). Puerarin, [6]-gingerol, and paeoniflorin were obtained from Yoneyama (Osaka, Japan). Daidzein was purchased from Extrasynthese (Genay, France). Methanol was bought from Merck (Darmstadt, Germany). Four concentrated Ge-gen- tang samples manufactured by different GMP medic- inal companies were purchased from local drug stores in Taiwan. All other chemicals were of analytical grade and were purchased from Merck. All of the chemicals were used as received. Water was purified by a Mini-Q water system (Millipore, Bedford, MA) and filtered through a 0.22 urn filter.
2.3. Procedure
Standard solutions (5 mg ml-‘) of seven analytes were prepared in methanol. Sample solutions with various concentrations were prepared by diluting the standard solution with 40% (v/v) methanol aqu- eous solution. Electrophoresis borate buffers were prepared by mixing appropriate amounts of 0.1 M borax with 0.1 M sodium hydroxide or with 0.1 M boric acid in deionized water. A 2.0 g sample of each concentrated commercial medicinal preparations was accurately weighed. The concentrated samples were mixed and extracted with 20 ml of solution (50%, 70% or 100% methanol aqueous solution) for 15 min in an ultrasonic bath. The sample was then filtered through a filter paper. The extracting and filtering procedure was repeated three times. A total of 60 ml extracted sample solution was evaporated to dryness. Then a methanol
H.-Z Huang, Z-Z. Hsieh/Analytica Chimica Acta 351 (1997) 49-55 51 OH R Puerarin Glc Daidzein H COOH Cinnamic acid Glycyrrhizin [6]-Ginger01
Fig. 1. Molecular structures of the seven analytes.
aqueous solution was added to the dry sample to make it up to a final volume of 4.0 ml. The extracted sample was ready for analysis by MEKC.
The recovery study followed the same extraction procedure to prepare the sample for direct injection.
3. Results and discussion
Fig. 1 depicts the molecular structures of the seven target analytes in this study, i.e., paeoniflorin, puer- arm, daidzein, cinnamic acid, glycyrrhizin, ephedrine, and [6]-gingerol. Their structures significantly differ except for puerarin and daidzein. Four analytes, i.e. puerarin, daidzein, cinnamic acid, and glycyrrhizin, had maximum absorbances around 270 nm, also had absorbances at 200 nm. The maximum absorbances of other three analytes were at 200 nm. Consequently, the detection wavelength was set at 200 nm to search for the optimum separation conditions. While quantita-
5 6 7 8 9 10 1,
pH Value
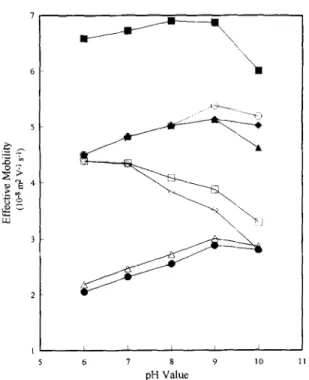
Fig. 2. Effect of buffer pH on effective mobility. Conditions: capillary, 47 cm (40 cm to detector) x50 urn Ld.; applied voltage, 20 kV; detecting wavelength, 200 nm; column temperature, 25°C. Key: 0, EOF; +, paeoniflorin; 0, puerarin; 0. daidzein; A, cinnamic acid, 0, glycyrrhizin; n , ephedrine; A, [6]-gingerol.
tively analyzing actual samples, the detecting wave- length was altered between 200 and 270 nm during the separation process to produce better signals for all analytes in one electropherogram.
Phosphate and borate buffers with various pH values ranging from 6.0 to 10.0 were initially used to separate the seven analytes. Variation of pH affected analytes’ resolutions and migration times. Fig. 2 sum- marizes the effects of buffer pH on the separation. At pH 6.0, cinnamic acid and glycyrrhizin dissociated, thereby causing their effective mobilities to be slower than the electroosmotic flow (EOF). Ephedrine, carry- ing a positive charge, migrated faster than the EOF. The other four analytes had the same effective mobi- lity as the EOF at pH 6.0. In pH 7.0 buffer, puerarin and daidzein migrated at an identical effective mobi- lity which was slower than the neutral compounds (i.e., paeoniflorin and [6]-gingerol). The peaks of puerarin and daidzein could be adequately resolved at pH 8.0. The other analytes’ migration order in pH
52 H.-k: Huang, K-Z. Hsieh/Analytica Chimica Acta 351 (1997) 49-5.5
8.0 buffer was identical with those in previous buffers. The separation results in pH 9.0 buffer and in pH 8.0 buffer were similar except that paeoniflorin and [6]-ginger01 separated from the EOF in pH 9.0 buffer. At pH 10.0, paeoniflorin and [6]-ginger01 peaks were fully resolved. However, daidzein and glycyr- rhizin migrated together. According to those results, the optimum separating resolutions for the analytes were achieved at pH 9.0. Nevertheless, further improvement was necessary to sufficiently separate all analytes.
3.1. Optimum MEKC conditions
Sodium dodecyl sulfate (SDS) surfactant was added to the pH 9.0 borate buffer to enhance the separation efficiency. Fig. 3 presents the effects of different SDS concentrations on the analytes’ migration behaviors. As those results indicate, the effective mobilities of ephedrine and [6]-ginger01 were significantly altered, implying that both analytes strongly interacted with SDS micelles. Although carrying one positive charge,
1 I / I
0 10 20 30 40 50
SDS Concentration (mM)
Fig. 3. Effects of SDS concentration on the effective mobility. Conditions: separation solution, SDS in 50 mM borate buffer (pH 9.0). Other conditions as in Fig. 2.
ephedrine could interact with SDS through electro- static and hydrophobic interactions. The effective mobilities of daidzein and paeoniflorin were influ- enced in the presence of SDS. More specifically, their mobilities were decreased with an increase in SDS concentration. Nevertheless, the other three analytes’ effective mobilities were barely affected by adding SDS in the buffer because of their polar properties. Experimental results indicated that adding SDS in the borate buffer indeed improved the separation effi- ciency. The separation resolution was satisfactory in the buffer containing 20 or 40 mM SDS. Since the analytes’ effective mobilities were greater in the 20 mM SDS buffer than in the 40 mM SDS buffer, the former was selected for subsequent use.
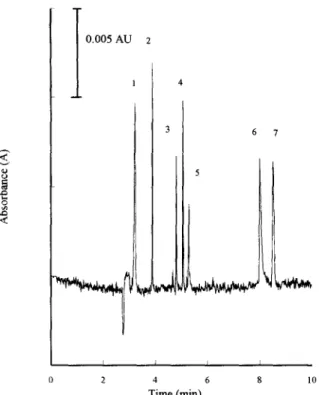
The optimum separation efficiency was achieved using pH 9.0 borate buffer containing 20 mM SDS. Under this circumstance, the seven analytes could be sufficiently separated within 10 min. However, when this buffer was applied to analyze concentrated Ge-gen-tang samples, ephedrine was interfered by an unknown compound despite the fact that all other analytes could be adequately resolved. To enhance the resolution of ephedrine, the temperature of the separa- tion capillary was increased to 30°C. Fig. 4 depicts the electropherogram of seven analytes under these con- ditions. The satisfactory separation was completed within 9 min. Thus, increasing the temperature not only enhanced the exchange rate between SDS micelles and SDS monomer thereby yielding a better resolution, but also shortened the separation time.
Table 1 lists the average migration times, reproduc- ibilities, correlation coefficients of calibration graphs, limits of detection, and separation efficiencies for those analytes. The relative standard deviations (RSDs) of the migration times were < 0.43%. The highest separation efficiency for the analytes was 4.67x lo5 for puerarin. The absorption wavelengths used for quantitative analysis were 200 nm for paeo- niflorin, ephedrine, and [6]-gingerol, and 270 nm for puerarin, daidzein, cinnamic acid, and glycyrrhizin. The correlation coefficients of those linear calibration graphs exceeded 0.996 in the ranges of 60- 480 pg ml-’ for paeoniflorin, 26-210 pg ml-’ for puerarin, 5-45 pg ml-’ for daidzein, 15-120 pg ml-’ for cinnamic acid, 112-900 ug ml-’ for glycyrrhizin, 25-200 pg ml-’ for ephedrine, and 13-110 pg ml-’ for [6]-gingerol. For those analytes, the detection
H.-Y Huang, Z-Z. Hsieh/Analytica Chimica Acta 351 (1997) 49-5.5 53
tions were satisfactory for the standard analytes and
0.005 AU 2 Ge-gen-tang samples. Therefore, the optimized con-
ditions were adopted herein to determine the seven markers in actual samples.
5 6 7
L
L 0 2 4 6 8 10 Time (mm)Fig. 4. Separation of the seven analytes by MEKC. Conditions: separation solution, 50 mM borate buffer containing 20 mM SDS (pH 9.0); column temperature, 30°C. Other conditions as in Fig. 2. Peaks: 1, paeoniflorin; 2, puerarin; 3, daidzein; 4, cinnamic acid; 5, glycyrrhizin; 6, ephedrine; 7, [6]-gingerol. An= absorbance.
limits ranged from 1.3 pg ml-’ for cinnamic acid to 57 pg ml-’ for glycyrrhizin. Under the optimum con- ditions, the separation efficiencies and peak resolu-
Table 1
3.2. The extraction and analysis of real samples
The extraction efficiencies for the seven compounds were examined with three extraction solutions (50%, 70%, and 100% methanol). 50% methanol aqueous solution led to the lowest extraction efficiencies for all of the analytes. The highest extraction efficiencies for ephedrine, puerarin, and daidzein were achieved by pure methanol. However, glycyrrhizin could not be adequately extracted into pure methanol. Thus, 70% methanol aqueous solution was selected to extract Ge-gen-tang samples.
The extraction recoveries for the seven analytes in real samples were examined by spiking the standards into concentrated medicinal preparations. The recov- eries for triplet extractions were 85.1% (RSD=4.11%) for paeoniflorin, 94.8% (RSD=2.37%) for cinnamic acid, 80.2% (RSD=3.77%) for puerarin, 89.2% (RSD=3.08%) for glycyrrhizin, 84.6% (RSD=0.66%) for daidzein, 81.2% (RSD=2.53%) for ephedrine, and 99.1% (RSD=3.56%) for [6]-gingerol.
The concentrated Ge-gen-tang samples were extracted according to the experimental procedure and were analyzed by MEKC. Fig. 5 depicts the separation of seven marker analytes in a Ge-gen-tang sample. The detection wavelength was changed from
Average migration times, relative standard deviations, correlation coefficients of calibration graphs, limits of detection, and peak efficiencies for the analytes
Migration time RSD Correlation coefficient Limit of detection Peak efficiency
(min)a,b (%)“.b of calibration graphC (pg ml-l)d (N)
Paeoniflorin 3.00f0.010 0.34 0.998 19.5 19000 Puerarin 3.89f0.012 0.30 0.999 3.2 467 000 Daidzein 4.8110.019 0.39 0.998 1.4 456 000 Cinnamic acid 5.07~0.015 0.30 0.998 1.3 365 000 Glycyrrhizin 5.29f0.018 0.34 0.997 57.3 344000 Ephedrine 8.011hO.034 0.43 0.996 9.3 132 000 [6]-Ginger01 8.5210.026 0.30 0.999 2.8 191000 “n=12.
’ The concentrations of the analytes were 300 pm ml-’ for paeoniflorin, 60 pm ml-’ for puerarin, 15 pg ml-’ for diadzein, 20 pg ml--’ for cimmanic acid, 500 pg ml-’ for glycrrhizic acid, 100 pg ml-’ for ephedrine, and 30 pg ml-’ for [6]-gingerol.
‘Triplicate results for each of five different analyte concentrations. dSlN=3.
H.-K Huang, L-Z. Hsieh/Analytica Chimica Acta 351 (1997) 49-55
7
4
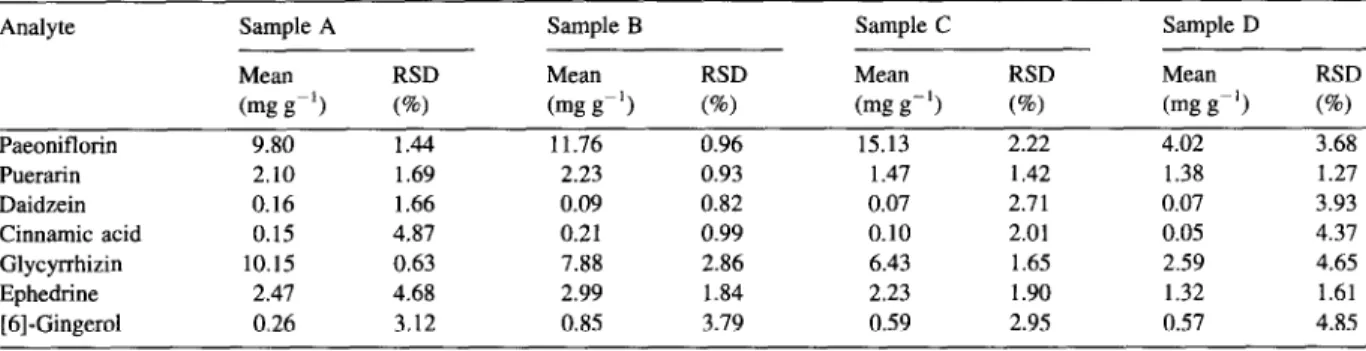
Table 2 lists the contents of Ge-gen-tang samples manufactured by four different companies, with cor- relation coefficients of UV spectra for the identifica- tion of analytes all above 0.97. As shown in Table 2, the contents of each analyte were markedly different in those samples, which is probably due to different sources of herbs, different manufacturing processes, or different composition formulas. Thus, quality con- trol is critical for concentrated Chinese medicines. For the seven analytes, their RSD ranges for the samples varied from 0.63% (for glycyrrhizin, sample A) to 4.85% (for [6]-gingerol, sample D). Such variations in RSD can probably be attributed to the heterogeneity of the sample powder or different matrixes of those samples. Nevertheless, the electropherograms of those samples were similar to one another. Thus the results presented herein demonstrate that the MEKC method can serve as a quick and adequate method to analyze complicated Chinese medicinal preparations.
0 2 4 6 8 10
Time (mm)
Fig. 5. Separation of Ge-gen-tang sample under the optimum MEKC conditions. Conditions: detecting wavelength, 200 nm (before 3.7 min and after 7.0 min), 270 nm (between 3.7 min and 7.0 min). Other conditions as in Fig. 4.
200 nm to 270 nm at 3.7 min, then was changed back to 200 nm at 7 min. The seven analytes were clearly identified by comparing each peak migration time and UV spectrum with those of the standard. Moreover, spiked standards in actual samples were employed to further confirm the identities of those analytes.
4. Conclusions
This study has successfully developed a high pre- cision, high resolution, and rapid MEKC technique to analyze for seven marker components in Ge-gen-tang. Those analytes were completely separated within 9 min using a pH 9.0 borate buffer containing 20 mM SDS at 30°C. The sample extraction method for Ge-gen-tang was relatively simple and efficient. Therefore, the MEKC method is also a promising alternative to analyze other complicated Chinese med- icinal preparations.
Table 2
Contents of paeoniflorin, puerarin, daidzein, cinnamic acid, glycyrrhizin, ephedrine, and [6]-ginger01 in four different Ge-gen-tang samples’
Analyte Sample A Paeoniflorin Puerarin Daidzein Cinnamic acid Glycyrrhizin Ephedrine [6]-Ginger01 Mean RSD (mg gg’) W) 9.80 1.44 2.10 1.69 0.16 1.66 0.15 4.87 10.15 0.63 2.47 4.68 0.26 3.12 Sample B Sample C Mean RSD (mg gg’) (%) 11.76 0.96 2.23 0.93 0.09 0.82 0.21 0.99 7.88 2.86 2.99 1.84 0.85 3.79 Mean (mg 8-l) 15.13 2.22 1.47 1.42 0.07 2.71 0.10 2.01 6.43 1.65 2.23 1.90 0.59 2.95 RSD W) Sample D Mean RSD (mg gg’) (%) 4.02 3.68 1.38 1.27 0.07 3.93 0.05 4.37 2.59 4.65 1.32 1.61 0.57 4.85 “n=3.
H.-Z Huang, E-Z. Hsieh/Analytica Chimica Acta 351 (1997) 49-55 55
Acknowledgements
This research was supported by Grant NSC 86- 2113-M-009-01 6 from the National Science Council of the Republic of China, Taiwan.
References
[l] H.-Y. Hsu, C.-S. Hsu, Commonly Used Chinese Herb Formulas with Illustrations, Oriental Healing Arts Institute,
[2] H.Y. Hsu, Y.P. Chen, S.J. Sheu, C.S. Hsu, C.C. Chen, H.C. Long Beach, CA, 1990.
Chang, Chinese Material Medica - A Concise Guide, Modem Drug Press, Taipei, 1985.
[3] Y. Kitada, M. Mizobuchi, Y. Ueda, H. Nakazawa, J. Chromatogr. 347 (1985) 438.
141 Y. Ohshima, T. Okuyama, K. Takahashi, T. Takizawa, S. Shibata, Planta Med. 54 (1988) 250.
[5] T. Takaaki, N. Momma, K. Ohsawa, Yakugaku Zasshi 113 (1993) 881.
[6] K-C. Wen, C-Y. Huang, F-L. Lu, J. Chromatogr. 631 (1993) 241.
[7] F. Foret, L. Krivankova, P. Bocek, in: B.J. Radola (Ed.), Capillary Zone Electrophoresis, Cambridge University Press, New York, 1993.
[8] N.A. Guzman (Ed.), Capillary Electrophoresis Technology, Marcel Dekker, New York, 1993.
[9] M. Novotny. H. Soini, M. Stefansson. Anal. Chem. 66 (1994) 646A.
[lo] H. Nishi, S. Terabe, J. Chromatogr. A 735 (1996) 3. [l l] Z. Iwagami. Y. Sawabe, I. Nakagawa, Shoyakugaku Zasshi 45
(1991) 232.
[12] S-J. Sheu, H.-R. Chen, Anal. Chim. Acta 309 (1995) 361. [13] Y.-Z. Hsieh, H.-Y. Huang, J. Chromatogr. A 759 (1997)
193.
[14] S-J. Sheu, C.-F. Lu, J. High Resolut. Chromatogr. 18 ( 1995) 269.