ECG Patterns Recognition using Multilayer Perceptron and Classification Tree
以多層感知機與分類樹進行心電圖模樣辨識
Lin, Yu-Jen
林堉仁
Dept. of Elect. Eng., ISU
[email protected]
Yang, Jing-Xiong
楊景雄
Dept. of Elect. Eng., ISU
[email protected]
摘要 本文使用多層感知機(MLP)、分類樹(CT)、以及兩者的 結合,來進行心電圖訊號四種模樣之辨識,包括:正 常(Normal)、左側束傳導阻滯(LBBB)、右側束傳導阻 滯(RBBB)、單純性心室早期收縮(PVC)。我們先使用 多層感知機及分類樹來診斷這四種模樣。再來把之前 在執行分類樹的過程中,所得到用來分裂節點的輸入 屬性,做為多層感知機的輸入。如此可以減少多層感 知機輸入向量的維度,也可以得知有哪些特徵訊號輸 入對於心電圖模樣的辨識較具影響。經過多次的電腦 程式模擬,最後證實了我們所提出的方法之可行性。 關鍵字:心電圖、模樣辨識、多層感知機、分類樹、 主成份分析。 AbstractThis paper utilises multilayer perceptrons (MLP), classification tree (CT), and their combinations to recognise 4 ECG patterns: normal, left bundle branch block (LBBB), right bundle branch block (LBBB) and premature ventricular contraction (PVC). We first employ MLP and CT to recognise ECG pattern, and then we use features obtained from CT for MLPs to recognise ECG patterns. Benefits of such arrangement are twofold: reducing the input attributes for MLPs and finding what input attributes are crucial in ECG pattern recognition. Comprehensive computer simulations in the end of this paper will justify the feasibility of our proposal.
Keywords: ECG, Pattern Recognition, Multilayer Perceptron, Classification Tree, Principal Component
1. Introduction
Recently novel electronics, computer and information engineering achievements have been successfully applied to healthcare systems. In hardware prospect, exquisite electronic instruments, such as wearable ECG measuring system and stethoscope system, can record our biomedical signals at any time and any where. In software prospect, data mining and knowledge discovery algorithms facilitate the intelligent analysis of healthcare information system. This is particular true for ECG pattern recognition. Thank to the open MIT/BIH ECG arrhythmia database which made it an easy way for scientists all over the world to freely access various abnormal heart beating signals, a large number of researches focused on this issue have been significantly promoted in 1980s [1]. Since then, ECG pattern recognition using various knowledge-based algorithms has become a rather popular research field in both biomedical and information discipline [2]. Prominent veins in this field include fuzzy logic approach [3-4], neuro-fuzzy networks [5-7], and artificial neural networks (ANN) [8-14]. The great amount of extracted ECG data is bound to increase the ANN computation burden. In [10], PCA skill was utilised to reduce input variables from 180 to 14. Another similar dimensionality reduction technique, linear discriminant analysis (LDA) was proposed in [12] where input features of ECG signals were reduced from 275 to 6.
This paper proposes an ECG pattern recognition scheme which combines classification tree (CT) and MLP. CTs
2.2 Extract ECG Features refer to the decision trees that are specially dealing with
classification problems. A grown CT for the training data actually results from a succession of node splits. Any split occurred in the CT depends on a specific input attribute of the training data and a specific value of the input attribute that can significantly reduce the impurity of whole tree. If we apply CT algorithm to ECG pattern recognition, what we can learn from the CT is not just the inferred ECG pattern, we can also find out some input attributes that the CT considered during splitting process.
Next, we extracted ECG signal features. We employed the features containing 2 categories: the R-R interval and ECG morphology. For the first category, we had two features, RR1 which was defined the interval between current R peak and the previous one R peak, and RR2 which was defined as the interval between current R peak and next R peak. For the second category, ECG morphology, we selected the ECG signal magnitude measured 50 ms before and 100 ms after the R peak, as the remaining features. We took 27 samples in this 150 ms interval. In summary, we would have 29 input features in this study.
2. Methodology
The sequential steps in this paper are: collect ECG data, extract ECG features, organise ECG features, and finally
recognise ECG patterns. 2.3 Organise ECG Features 2.1 Collect ECG Data
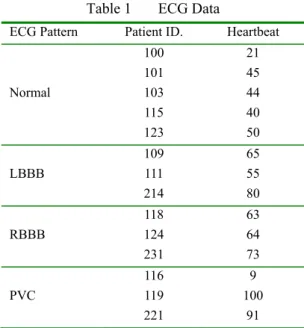
First we collected ECG data from the MIT/BIH database [1]. We focused on four ECG patterns: normal, LBBB, RBBB and PVC. The patients and the heart beats, were listed in Table 1. For each ECG pattern we collected 200 heartbeats. Thus we had in total 800 heartbeats. The training data comprised of 600 heartbeats and the testing data comprised of 200 heartbeats. Each ECG pattern shall make up a quarter part of whole training and whole testing data.
Table 1 ECG Data
ECG Pattern Patient ID. Heartbeat
100 21 101 45 Normal 103 44 115 40 123 50 109 65 LBBB 111 55 214 80 118 63 RBBB 124 64 231 73 116 9 PVC 119 100 221 91
ECG signals always accompany low frequency nois. Figure 1 illustrates a disturbed ECG signal in which a low frequency at 0.17 Hz sinusoidal wave can be vaguely identified in the interval of first 5 seconds. This phenomenon would advise us that if one use the ECG signals from MIT/BIH database directly without any further modification, it is very likely to obtain low frequency interfaced ECG signal rather than the really one. Thus, before normalisation process for MLP training and testing, we have to remove low frequency noises adhered in those ECG signals. Once we obtain the 150 ms ECG signals for each heartbeat, we let the R-peak as the reference point and compute ECG signal’s magnitude with respect to this reference point (R-peak).
Next, we normalised the extracted features, including 2 RR intervals and 27 ECG morphology amplitudes, of 800 training and testing data.
2.4 Recognise ECG pattern Figure 4 Illustration of Task 1 In the last step we recognised ECG pattern using MLP,
CT and their combinations.
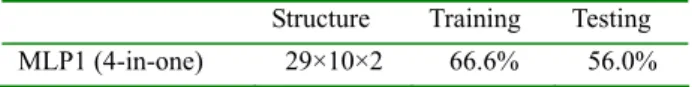
Notice that MLP is not actually a determined artificial intelligence technique. Sometimes it does have very high prediction performance but sometimes it does not. In the remaining part of paper, we applied multiple runs at the MLP testing stage, and computed the average performance of all tests. Here six MLP testing runs were executed, and the results were summarised in Table 3. 3 Results and Discussion
We carried out 7 different tasks summarised in Table 2. Task 1 used a single MLP to recognise 4 ECG patterns simultaneously. Task 2 considered 4 independent MLPs for 4 ECG patterns recognition. Task 3 followed the idea of Task 2, but CT replaced MLP as the pattern recognition tool. In Task 4, we selected the splitting input attributes obtained in Task 3 and fed those selected input attributes into another 4 independent MLPs. This task could be considered as the combination of Task 2 and 3. Task 5 followed the similar idea of Task 4. However, in Task 5 we used only one single MLP to recognise 4 ECG patterns simultaneously. It could be considered as the combination of Task 1 and Task 3. Task 6 followed the idea of Task 4 but was aided with PCA for selecting input attributes. So did Task 7 in which followed the idea of Task 5 but was aided with PCA.
Table 3 Results of Task 1
Table 2 Summary of All Tasks
No. Task Content
1 Recognise by a single MLP
2 Recognise by 4 MLPs
3 Recognise by 4 CTs
4 Recognise by 4 MLPs aided by CT
5 Recognise by a single MLP aided by CT
6 Recognise by 4 MLPs aided by PCA
7 Recognise by a single MLP aided by PCA
Structure Training Testing
MLP1 (4-in-one) 29×10×2 66.6% 56.0%
3.2 Task 2
Figure 3 illustrates the idea of Task 2 in which 4 independent MLPs would recognise 4 ECG patterns respectively. The input neuron, hidden layer neuron and output layer neuron number was set to 29, 10 and 1. Because each MLP in this task identified a specific ECG pattern, only 1 output neuron would be ample.
Figure 3 Illustration of Task 2 3.1 Task 1
We carried out 10 runs for each MLP in this task. For each run the training performance goal was required to go beyond 99%. Table 4 records the structure, average training and testing performance of each MLP. All of MLP2 series outperformed MLP1.
Figure 2 illustrates the procedures of Task 1. There were 29 input neurons, 10 hidden neurons and 2 output neurons in this MLP1. The output neuron number, 2, was big enough to present 4 ECG patterns (00, 01, 10 and 11).
3.4 Task 4 Table 4 Results of Task 2
Structure Training Testing
MLP2_1 (Normal) 29×10×1 100% 100%
MLP2_2 (LBBB) 29×10×1 88.8% 73.1%
MLP2_3 (RBBB) 29×10×1 100% 95.5%
MLP2_4 (PVC) 29×10×1 91.7% 75.0%
In this task, we used the splitting input attributes obtained in Task 3 and fed them into 4 different MLPs. Figure 5 conceptually illustrates this task.
3.3 Task 3
Task 3 was the counterpart of Task 2 because we employed 4 CTs in stead of MLPs. Figure 4 illustrates the idea of this task. Once a CT is established, the testing performance will always be all the same. Table 5 lists the results. Notice that in the third column of Table 4 the sequence for splitting attributes presented the order during CT construction process.
Figure 5 Illustration of Task 4
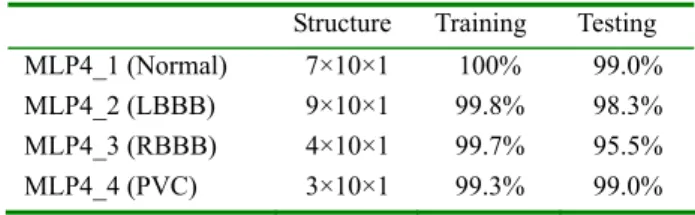
Table 6 summarises this task. The input neuron numbers of MLP4 series were quite different from MLP2 series. The input neuron number of each MLP was shrunk from 29 to 7, 9, 4, and 3, respectively. In this task, since each MLP identified a specific ECG pattern, only 1 output neuron should be ample. The training in each MLP was beyond 95%, which was better than Task 3.
Table 6 Results of Task 4 Figure 4 Illustration of Task 3
This seems that CT was rather good approach to recognising ECG patterns. In addition, we could obtain a series of splitting attributes from CT, and those splitting attributes implied that they were important than any other attributes. We will utilise those splitting attributes in following tasks.
Table 5 Results of Task 3
Training Splitting Attributes Testing
CT3_1 (Normal) 100% 9,20,9,3,1,19, 11,8,1,1 93.0% CT3_2 (LBBB) 100% 2,7,4,2,28,7,5,20, 22,1,16,7 91.0% CT3_3 (RBBB) 100% 19,3,1,1,2,1,19,3 94.0% CT3_4 (PVC) 100% 1,2,25 100%
Structure Training Testing
MLP4_1 (Normal) 7×10×1 100% 99.0%
MLP4_2 (LBBB) 9×10×1 99.8% 98.3%
MLP4_3 (RBBB) 4×10×1 99.7% 95.5%
MLP4_4 (PVC) 3×10×1 99.3% 99.0%
3.5 Task 5
In this task, we collected the splitting input attributes selected by CT in Task 3, unified them, and fed into a single MLP. Figure 6 shows the procedures performed in Task 5. The selected input attributes were came from the union of 4 CTs splitting attributes which were obtained in Task 3, the CT3 series.
This task is a comparative work with respective to Task 4, where CT was used for input dimension reduction. This task would provide us an idea of that which algorithm, CT or PCA, can outperform the other. Using PCA, the results were ranging from 76.9% to 93.8%, as listed in Table 8. The results implied PCA did not outperform CT shown in Task 4.
Table 8 Results of Task 6 Figure 6 Illustration of Task 5
Fifteen unrepeated input attributes were chosen from Task 3 constituted the inputs for MLP5. It recognised 4 ECG patterns simultaneously so the output neuron number was 2. There were 15, 10, and 2 neurons in input, hidden and output layer respectively. Table 7 summarised the result. The average performance of Task 5 was 96.4% which appears better than Task 1. We have reduced the input dimension from 29 to 15 but this is not our only one reward. We also learn which input attributes are worth investigating further.
Table 7 Results of Task 5
Structure Training Testing
MLP5 (4-in-one) 15×10×2 99.9% 96.4%
Structure Training Testing
MLP6_1 (Normal) 7×10×1 100% 93.8%
MLP6_2 (LBBB) 9×10×1 99.8% 87.2%
MLP6_3 (RBBB) 4×10×1 100% 73.9%
MLP6_4 (PVC) 3×10×1 99.7% 76.9%
3.7 Task 7
In this task, we also used PCA to shrink MLP’s input dimension but we only used a single MLP for ECG pattern recognition. Schematic concept of this Task is illustrated in following Figure 8.
Figure 8 Illustration of Task 7 3.6 Task 6
Note that this task is a comparative test with respective to Task 5. This task would provide us an idea of that which algorithm, CT or PCA, can outperform the other. Using PCA, the average testing performance was 87.9%, as listed in Table 9.
In this task, we used PCA to shrink MLP’s input dimension. We first carried out 4 different PCA operations and then applied to 4 independent MLPs, as illustrated in following Figure 7.
Table 9 Results of Task 7
Structure Training Testing
MLP7 15×10×2 99.8% 87.9%
4. Conclusions
In this paper we proposes a pattern recognition methodology for four ECG pattern recognition (Normal, LBBB, RBBB and PVC) using MLP, CT, and their combination. Extensive computer simulations have approved the proposed method. Not only can we Figure 7 Illustration of Task 6
deteriorating recognition performance, but we are also able to understand what ECG features are significant in arrhythmia recognition. Moreover, several ECG pattern recognition results that were using PCA for input dimension reduction have been carried out. They have justified the superiority of our approach.
References
[1] G. B. Moody, R. G. Mark, “The impact of the MIT-BIH Arrhythmia Database,” IEEE
Engineering in Medicine and Biology, May/June
2001, pp. 45-50.
[2] M. Knudu, M. Nasipuri, D. K. Basu, “Knowledge-based ECG interpretation: a critical review,” Pattern Recognition, Vol. 33, pp. 351-373, 2000.
[3] W. Zong, D. Jiang, “Automated ECG Rhythm Analysis using Fuzzy Reasoning,” IEEE Computers
in Cardiology, pp. 69-72, 1998.
[4] A. M. Bensaid, N. Bouhouch, R. Bouhouch, R. Fellat, R. Amri, “Classification of ECG Patterns Using Fuzzy Rules Derived from ID3-Induced Decision Trees,”Proceeding of Conference on the North American Fuzzy Information processing Society, pp. 34-38, 1998.
[5] S. Osowski, T. H. Linh, “ECG Beat Recognition using Fuzzy Hybrid Neural Network,” IEEE Trans.
On Biomedical Engineering, Vol. 48, No. 1, pp.
1265-1271, 2001.
[6] M. Engin, “ECG beat classification using neuro-fuzzy network,” Pattern Recognition Letters, Vol. 25, pp. 1715-1722, 2004.
[7] Y. Özbay, R. Ceylan, B. Karlik, “A fuzzy clustering neural network architecture for classification of ECG arrhythmias,” Computer in Biology and
Medicine, Vol. 36, pp. 376-388, 2006.
[8] G. Braccini, L. Ednbrandt, M. Lagerholm, C. Peterson, O. Rauer, R. Rittner, L. Sörnmo, “Self-Organizing Maps and Hermite Functions for Classification of ECG Complexes,” IEEE
Computer in Cardiology, Vol. 24, pp. 425-428,
1997.
[9] S. Y. Foo, G. Stuart, B. Harvey, A. Meyer-Baese, “Neural network-based EKG pattern recognition,”
Engineering Applications of Artificial Intelligence,
Vol. 15, pp. 253-260, 2002.
[10] F. Vargas, D. Lettnin, M. C. F. Castro, M. Macarthy, “Electrocardiogram pattern recognition by means of MLP network and PCA: A case study on equal amount of input signal types”,
Proceedings of IEEE 7th Brazilian Symposium on
Neural Networks, CD-ROM, 2002.
[11] İ. Güler, E. D. Übeyli, “ECG beat classifier designed by combined neural network model,”
Pattern Recognition, Vol. 38, pp. 199-208, 2005.
[12] M. H. Song, J. Lee, H. D. Park, K. J. Lee, “Classification of heartbeats based on linear discriminant analysis and artificial neural network,”
Proceeding of IEEE 27th Annual Conference on
Engineering in Medicine and Biology, pp.
1151-1153, 2005.
[13] H. G. Hosseini, D. Luo, K. J. Reynolds, “The comparison of different feed forward neural network architectures for ECG signals diagnosis,”
Medical Engineering & Physics, vol. 28, pp.
372-378, 2006.
[14] L. He, W. S. Hou, X. L. Zhen, and C. L. Peng, “Recognition of ECG patterns using artificial neural network,”, Proceeding of the 6th
International Conference on Intelligent Systems Design and Applications, 2006.