行政院國家科學委員會專題研究計畫 成果報告
嵌入式網路通訊裝置評比技術與工具之研發(中心分項)--子計畫二:嵌入式網路通訊裝置耗能評比基準與工具之研發
研究成果報告(精簡版)
計 畫 類 別 : 整合型 計 畫 編 號 : NSC 97-2218-E-009-033- 執 行 期 間 : 97 年 08 月 01 日至 98 年 07 月 31 日 執 行 單 位 : 國立交通大學資訊工程學系(所) 計 畫 主 持 人 : 曹孝櫟 計畫參與人員: 碩士班研究生-兼任助理人員:陳建臻 碩士班研究生-兼任助理人員:游政錕 碩士班研究生-兼任助理人員:楊弘偉 碩士班研究生-兼任助理人員:Ilter Suat 博士班研究生-兼任助理人員:黃承威 報 告 附 件 : 出席國際會議研究心得報告及發表論文 處 理 方 式 : 本計畫可公開查詢中 華 民 國 98 年 11 月 01 日
嵌入式網路通訊裝置耗能評比基準與工具之研發
Power Consumption Benchmarking and Evaluation Tools for Embedded
Network and Communication Devices
摘要 嵌入式網路通訊裝置例如手機等對於系統耗電相當重視,然而在過去開放原始碼的計畫中較缺乏對耗 電測試與評比工具的支援,本計畫的主要目的在於建立一套完整的嵌入式網路通訊裝置耗電量測環 境,蒐集並建立耗電模型以利進行系統層級的耗電評估與改善。在本年度的計畫中,我們建立了嵌入 式網路通訊裝置耗電量測環境,同時設計開發了配合量測環境使用的相關工具程式。本計畫所設計開 發的量測環境,除了可以即時地量測與記錄嵌入式網路通訊裝置的耗電,更進一步可提供測試者設定 各種無線網路的環境與嵌入式網路通訊裝置在無線網路上移動與停留的情形,同時也可以設定裝置在 每一個時間點所執行的程式與動作,用以評估嵌入式網路通訊裝置在實際環境(field trial)中各種應用 程式服務等的真實的耗電行為。建立在此一平台與工具之上,本計畫已陸續完成多款小筆電(Netbook) 以及 Android 手機在不同應用服務與程式和工作模式的耗能量測,目前正進行量測數據的分析並進行 嵌入式網路通訊裝置耗電的改善。除此之外,利用量測數據所建立嵌入式網路通訊裝置各元件的耗電 模型,本計畫同時完成嵌入式系統耗電剖析工具,協助嵌入式開發者在無須硬體耗電設備的環境下, 進行嵌入式系統耗電之高階耗能分析、評估與改善。
1. Introduction
Recently, energy-efficiency has become an important focus in the design of embedded systems in order to handle the growing complexity of embedded software while minimizing the energy consumption of embedded systems. However, there is a lack in support of power measurement platform and evaluation tools in the open source community. Hence the main goal of this project is to build an integrated power measurement environment and analyzing tools for the embedded networking devices, to collect and establish relevant power consumption models in order to evaluate and improve system-level power consumption behaviors. There are several challenges in building such a power consumption evaluation platform for embedded networking devices effectively and efficiently. In this project, we focus on the following two subjects:
1) Power Consumption Measurement Environment for Mobile Devices (PowerMeMo)
It is difficult to capture the system’s power consumption behavior in the real usage scenario without involving massive and labor-intensive field trials. In addition, to be able to analyze the captured data effectively, it is often needed to replay the exact context of the data capturing scenario which is commonly not available. As we know the battery life time is very sensitive to the signal strength of the situated wireless network and the specific user usage, but this detail is often not listed in the specification of the embedded networking devices which makes comparisons relatively difficult. Thus to be able to evaluate the effectiveness of a proposed power saving strategy, it is vital to include the relevant wireless network deployment information together with user mobility patterns and the specific software application usage within a controllable and reproducible environment to measure the power consumption of the embedded
networking devices.
In this project, we have built the measurement environment and related software toolkits. In this measurement environment, we can measure the power consumption of embedded networking device in real time as well as providing user the freedom of configuring numerous wireless network environment settings and mobility patterns. Using the measurement environment, user can also configure the sequence of actions and executing software applications at any point of time to better emulate the power consumption behavior of embedded networking device in the physical field trials.
2) Advanced High-Level Software Energy Profiling Toolkit (SEProf)
In energy-efficiency research, energy estimation of embedded software is very critical in examining the effectiveness of energy-efficiency strategies and in analyzing the effects of power management, e.g. DVFS [1], on the execution time and energy consumption of embedded software. Prior works on energy estimation of embedded software could be classified into two categories, measurement-based [2] and modeling-based, according to the way that they estimate the power consumption of embedded processors. Some modeling-based approaches model the power consumption of embedded processors at lower level, such as architecture-level [3] and instruction-level [4], based on power measurement or low-level, e.g. circuit-level and gate-level, power estimation. Although most of them are able to produce accurate energy estimation results by performing detailed analysis on hardware events and software behaviors, they usually need to spend a lot of time to perform detailed energy analysis of larger systems. Since most embedded software remains the same in the design phase of energy-efficiency strategies, a detailed energy analysis for all embedded software may not be necessary every time the strategies are slightly modified. Therefore, estimating the energy consumption of embedded software at higher level may be an attractive option. In high-level modeling-based approaches, the power consumption of embedded processors is modeled at software level, such as basic-block-level [4] and function-level [5][6], based on measurement-based approaches or lower level modeling-based approaches. They are usually coupled with performance analysis tools which are executed on the target system to collect execution information. With proper design of power models, high-level modeling-based tools could estimate the energy consumption of embedded software more quickly while maintaining reasonable accuracy. Unfortunately, most of the existing high-level modeling-based tools do not consider that the operating voltage and frequency of embedded processors which support power management features may be dynamically changed. Without noticing the power levels of embedded processors, the accuracy of software energy estimation results could be significantly degraded.
Thus in this project, a high-level modeling-based software energy profiling tool, SEProf, is presented. It is aware of the changes in the operating voltage and frequency of embedded processors at runtime, and supports software energy estimation on OS-based embedded systems. Besides, an extensible software design is proposed and adopted in SEProf to meet different requirements of accuracy and efficiency.
2. Methodology and Design
1) Power Consumption Measurement Environment for Mobile Devices (PowerMeMo)
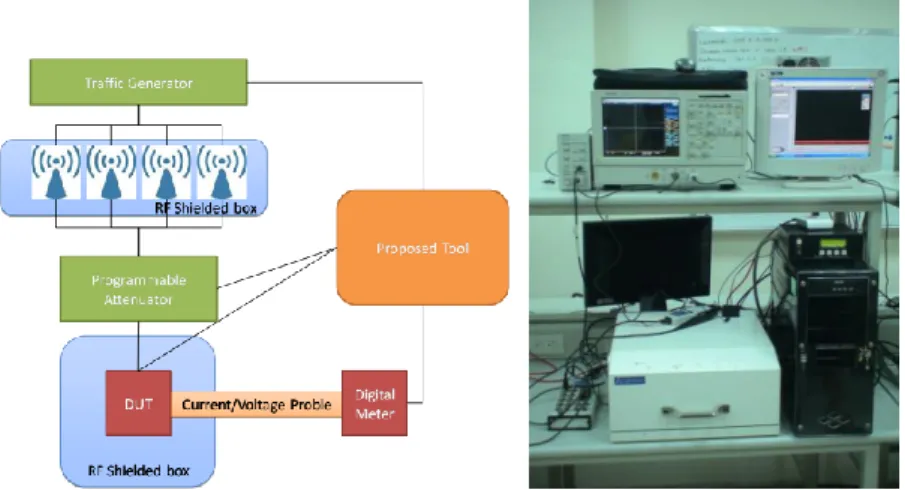
In this section, we describe the design architecture of the proposed measurement platform—PowerMeMo. The following graph shows the measurement platform, that can enable the users to
evaluate and diagnose power consumption issue in a mobile wireless network environment in the lab without the cumbersome field trial. And it also can help the users to reproduce the testing scenarios encountered in field trial to better analyze the problems.
Using adjustable wireless network deployment settings and suitable channel models, user can easily (re-)produce the desired measurment infrastructure. By specifying the mobility pattern and activating any installed software application on the embedded networking device, user can have detail measurement data corresponding to each interested actions. In this measurement platform, we also aim at providing a source level power consumption debugging feature which can provide the user with a good insight about the power consumption behavior of their program.
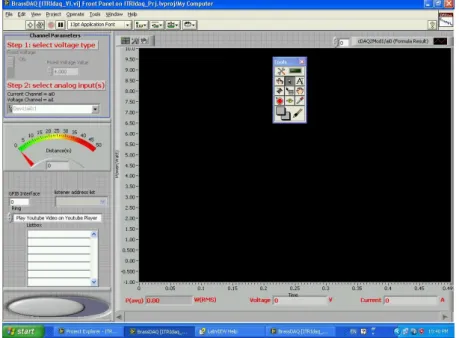
Figure 1 demonstrates the system architecture and its major software/hardware components. This is a fully automatic power evaluation platform for the embedded networking devices. It includes a portable DAQ card, attenuator, shielded box, host PC and control software. Through the programmable attenuator, it can be used to emulate different network environment and channel conditions. By using the digital meter and probes, it can be used to measure and analyze power consumption. With add-on software, it can supports source code level tracing, supports user defined scenarios and after the measurement it can provides a detailed power consumption report. Using Labview, we have constructed a graphical user interface for user to manipulate our platform with ease. As can be seen in the Figure 2, user can freely choose the measurement source and specify the mobility pattern with channel models to simulate his or her interested testing scenario. When the user starts the experiment, the panel at the right will show the measured power related information. At present, we have incorporated one simple WLAN model, namely one slope (log-distance model) which models the signal strength in relation to the distance between the mobile device and the access point as a demonstration.
Figure 2. Graphical user interface of the proposed PowerMeMo
2) Advanced High-Level Software Energy Profiling Toolkit, SEProf:
First, a brief description on the architecture of SEProf is described. The proposed high-level software energy profiling tool, SEProf, consists of two software components, (1) power table registrations and (2) a kernel patch, see Figure 3.
Figure 3. Overview of SEProf
Before using SEProf, the power consumption of the processor executing the embedded software has been measured by using our measurement platform and suitable high-level power libraries is established. These power libraries have to be inserted into embedded software, and registered through system calls provided by SEProf for energy estimation at runtime. In SEProf, the energy consumption of embedded software is calculated and maintained in kernel space, thus the OS kernel has to be patched before
compilation. When the patched kernel and user-level programs are compiled and executed, SEProf estimates the energy consumption for each thread at runtime and stores the estimated results in kernel space. Users can access the results through system calls provided by SEProf. The two software components are described in more detail in the following sections.
a) Power Table Registration
By using high-level power modeling techniques, users of SEProf have to build power libraries for embedded software as a reference of the average power consumption of the executing embedded software. A power library is consisted of one or more power tables, and each power table records a number of average power consumptions of an embedded processor executing a specific sequence of instructions, e.g. a basic-block, a function, or a program. The number of average power consumptions recorded in a power table is determined by the number of configurable power levels supported by the embedded processor. After building power libraries, users have to register and unregister power tables in embedded software through a system call provided by SEProf.
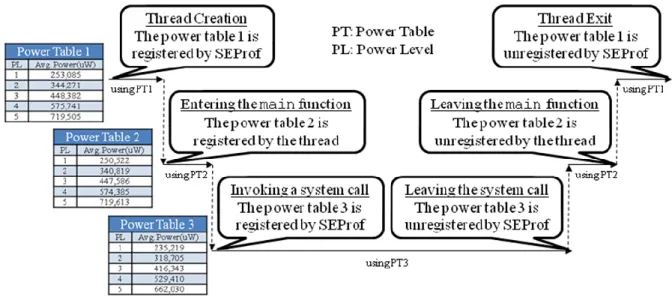
Figure 4. An example of using power tables
An example of using power tables is depicted in Figure 4. Assuming the embedded processor supports up to five different power levels. Each power table records five average power consumptions of the embedded processor operating at different power levels. In this example, three power tables are built by users, and described as follows. The power table 1 records the average power of all programs on the system. It is registered when a thread is created, and unregistered when a thread is terminated. The power table 2 records the average power of the example program. It is registered at the beginning of the main function in the example program, and unregistered at the end of it. The power table 3 records the average power of all system calls. It is registered at the beginning of the system call handler in OS kernel, and unregistered at the end of it. SEProf uses the currently registered power table to calculate the power consumption as execution goes.
b) Energy Estimation
When the OS kernel and user-level programs with power table registered are executing, SEProf calculates the energy consumption of each thread by the following formula
N i i i i thread T PT PL CID E 1 )] ( [ (1)where Ethread is the energy consumption of a thread, N is the number of runtime periods of a thread, Ti is the execution time of the thread in the ith runtime period, CIDi is the identification (ID) of the embedded processor core executing the thread in the ith runtime period, PL(CIDi) is the power level of the processor core whose ID is CIDi, PTi is the power table used in the ith runtime period, and PTi[PL(CIDi)] is the average power in the ith runtime period. A runtime period used in formula (1) is a period of time in the execution time of a thread. A runtime period of a thread is divided and used to estimate the energy consumption of the thread when one of the following four events occurs.
A thread registers or unregisters a power table. It means that the average power consumption of the embedded processor is changed. Therefore, the previous power table is used to estimate the energy consumption during the former runtime period, and the new power table is applied during the latter ones.
When the power level of the embedded processor which executes a thread is changed, the power consumption of the processor executing the thread is also changed. Hence, the previous power level is used to estimate the energy consumption during the former runtime period, and the new power level is applied in the following ones.
The total energy consumption of a thread is retrieved while the thread is running. Before returning the total energy consumption of the thread to users, SEProf adds the energy consumption of the thread since it was last calculated to the total energy consumption of the thread.
When a thread is dead, the energy consumption of the thread since it was last calculated is added to the total energy consumption of the thread.
3. Experiments
1) Power Consumption Measurement Environment for Mobile Devices (PowerMeMo)
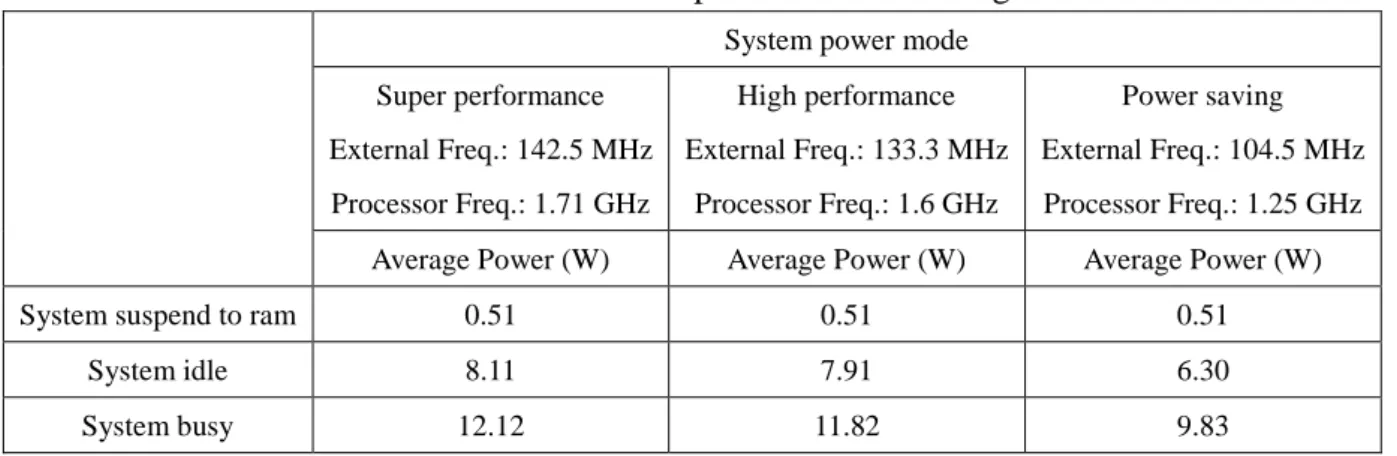
To demonstrate the effectiveness of our measurement environment, we have conducted several power measurements for netbooks and Android phones based on the measurement environment that was built. The first experiment measured the power consumption of Asus EeePC 1000 in combinations of different working mode and utilization rate.
Table 1. Power consumption of each working mode
System power mode Super performance External Freq.: 142.5 MHz Processor Freq.: 1.71 GHz High performance External Freq.: 133.3 MHz Processor Freq.: 1.6 GHz Power saving External Freq.: 104.5 MHz Processor Freq.: 1.25 GHz Average Power (W) Average Power (W) Average Power (W) System suspend to ram 0.51 0.51 0.51
System idle 8.11 7.91 6.30 System busy 12.12 11.82 9.83
turned off, there are no difference in power consumptions for different working mode. 2) But when the system is idle, that is CPU and LCD is on but there is no work to do, we can see the advantage of lowering the processor frequency can bring down the average power consumption from 8.11W to 6.30W which is about 20% saving. 3) Similar effect is observed when system is busy with 100% utilization, if we can withstand the performance loss, about 20% power saving can be enjoyed by lowering the processor frequency.
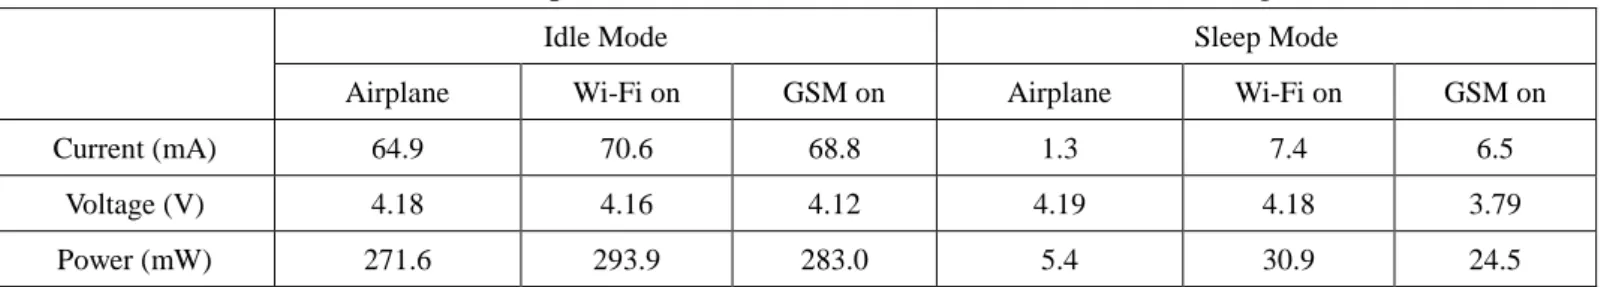
The second experiment conducted was to measure the power consumption of HTC G1. From Table 2, we can see that the power consumption in idle mode is far greater than in Sleep mode, because processor and LCD are the major sources of power consumption. This can also be confirmed by observing the small differences in power consumption in idle mode with or without communication devices turn on. When we turn off both processor and LCD, the power consumption of communication device, Wi-Fi and GSM, can be seen in clearer view.
Table 2. Power consumption of HTC Android G1 under different working modes
Idle Mode Sleep Mode
Airplane Wi-Fi on GSM on Airplane Wi-Fi on GSM on Current (mA) 64.9 70.6 68.8 1.3 7.4 6.5
Voltage (V) 4.18 4.16 4.12 4.19 4.18 3.79 Power (mW) 271.6 293.9 283.0 5.4 30.9 24.5
2) Advanced High-Level Software Energy Profiling Toolkit, SEProf:
To demonstrate the feasibility of SEPorf, SEProf was adopted to estimate the energy consumption of embedded software executing on an ARM11 MPCore processor [7]. The experimental platform is a Core Tile, CT11MPCore, which has an ARM11 MPCore test chip that implements the ARM11 MPCore processor stacked on the top of a RealView Emulation Baseboard. ARM11 MPCore processor is a multi-core processor which supports up to four MP11 central processing units (CPUs). On this platform, all MP11 CPUs on the ARM11 MPCore processor has the same power supply and clock source. The voltage level of the ARM11 MPCore processor could be changed by writing values to a digital to analog converter (DAC) on the CT11MPCore, and the voltage and current values of the processor are able to be obtained from an analog to digital converter (ADC). In the experiments, SEProf was integrated into Linux kernel 2.6.19, and a patched OProfile [8] was adopted to build power libraries and verify the accuracy of the power estimation results. OProfile is a system-wide profiler for Linux systems using statistical sampling. It could be used to profile Linux kernel, shared libraries, and applications. Originally, OProfile samples the context and program counter (PC) value of the running task on each sampling interrupt, but we extended it to sample the power consumption of the processor as well. We set the sampling rate of OProfile to 1 kHz, and assumed that a power sample could represent the average power consumption during the last sampling period.
There are four testing programs used in out experiments. Three of them are CG, IS, and DC applications from the OpenMP Implementation of NAS Parallel Benchmarks (NPB) (Version 3.3) [9]. Basically, they represent computation intensive applications. The last one testing program is an I/O intensive application named FileRW which is written by us. It is a simple application which just writes and reads a 10 MB file on a file system mounted via network file system (NFS).
Since we have not successfully scaled the frequency of the ARM11 MPCore processor without resetting it, the experiments are divided into two parts. One is voltage and frequency scaling (VFS) experiment and the other is dynamic voltage scaling (DVS) experiment. In VFS experiment, the accuracy of the power estimation using SEProf was verified by comparing the estimated power consumption with the measured power consumption of the processor operating at different voltage and frequency levels. On the other hand, in DVS experiment, we demonstrated the power estimation results for embedded software executing on the processor with DVS enabled.
We iterate through the five power levels for the ARM11 MPCore processor during the experiment. Each power level represents a combination of the voltage and frequency levels of the processor. In the power analysis stage, only one MP11 CPU was active during the experiment, because it was easier to map the measured power consumption back to the embedded software. The other three CPUs were in wait for interrupt (WFI) mode which means that their clocks were stopped and only the logics required for wake-up were powered. After analyzing the power consumption of the embedded software using the patched OProfile, we built seven power libraries for six applications and the Linux kernel, since they took almost all CPU time during the experiment.
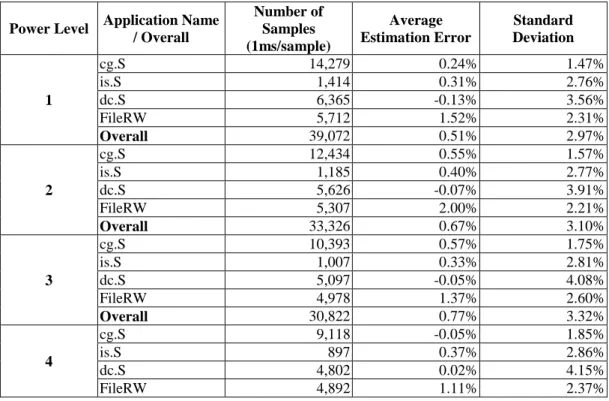
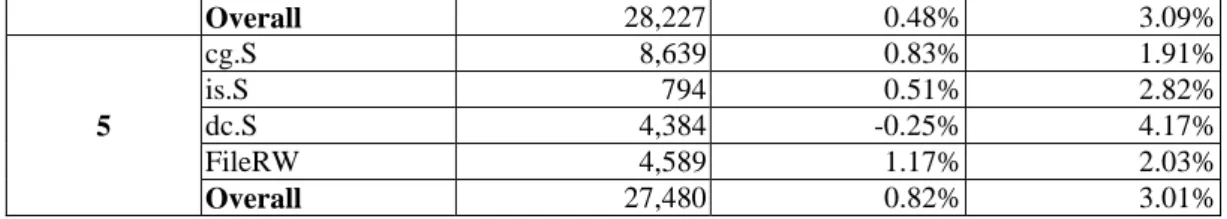
For simplicity, each power library only contains one power table, and each power table is consisted of five average power consumptions. The user-level power tables of the six applications are registered to SEProf at the beginning of the applications, and unregistered at the end of it. A kernel-level power table for the Linux kernel, ―vmlinux,‖ is registered to SEProf when each thread on the system is created, and unregistered when the thread is dead. It is also registered when a thread calls a system call, and unregistered when the thread returns from the system call. After building and registering power tables, the applications and the Linux kernel have to be re-compiled. While they are in execution, SEProf uses the registered power tables to estimate their energy consumption. The accuracy of the power estimation results show in Table 3. In most cases, the average estimation error is less than 2% and the standard deviation of the estimation error is less than 5%.
Table 3. Power estimation error in VFS experiment Power Level Application Name
/ Overall Number of Samples (1ms/sample) Average Estimation Error Standard Deviation 1 cg.S 14,279 0.24% 1.47% is.S 1,414 0.31% 2.76% dc.S 6,365 -0.13% 3.56% FileRW 5,712 1.52% 2.31% Overall 39,072 0.51% 2.97% 2 cg.S 12,434 0.55% 1.57% is.S 1,185 0.40% 2.77% dc.S 5,626 -0.07% 3.91% FileRW 5,307 2.00% 2.21% Overall 33,326 0.67% 3.10% 3 cg.S 10,393 0.57% 1.75% is.S 1,007 0.33% 2.81% dc.S 5,097 -0.05% 4.08% FileRW 4,978 1.37% 2.60% Overall 30,822 0.77% 3.32% 4 cg.S 9,118 -0.05% 1.85% is.S 897 0.37% 2.86% dc.S 4,802 0.02% 4.15% FileRW 4,892 1.11% 2.37%
Overall 28,227 0.48% 3.09% 5 cg.S 8,639 0.83% 1.91% is.S 794 0.51% 2.82% dc.S 4,384 -0.25% 4.17% FileRW 4,589 1.17% 2.03% Overall 27,480 0.82% 3.01%
In DVS experiment using ARM MPCore, the clock frequency of the processor operating at each power level is the same, since we have not successfully scaled the frequency of the processor without resetting it. Nevertheless, it does not prevent us from examining that SEProf supports the above mentioned feature, because the power consumption of the processor is also changed dynamically by scaling the voltage of the processor at runtime. In DVS experiment, as in VFS experiment, only one MP11 CPU was active, and seven power tables were built for six applications and the Linux kernel.
In DVS experiment, the voltage of the processor was periodically scaled at three different time intervals, 100 ms, 1 s, and 10 s. At each time interval, the power level of the processor was incremented by one. If the power level of the processor reached to five, then it was set to one at the next time interval. It can be seen from Table 4 that the estimated power consumption is usually very close to the measured one. The power estimation error in DVS experiment is shown in Table 4. It can be seen that in most cases, the average estimation error is still within 2%.
Table 4. Power estimation error in DVS experiment DVS Interval Application Name / Overall Number of Samples (1ms/sample) Average Estimation Error Standard Deviation 100 ms cg.S 14,059 -0.41% 4.80% is.S 1,411 -0.54% 5.33% dc.S 6,347 -0.92% 5.90% FileRW 5,729 0.54% 4.97% Overall 38,149 -0.34% 5.37% 1 s cg.S 14,105 1.15% 2.08% is.S 1,428 0.88% 2.72% dc.S 6,347 0.61% 3.98% FileRW 5,755 2.01% 2.79% Overall 38,231 1.18% 3.26% 10 s cg.S 14,150 -0.32% 1.53% is.S 1,431 -0.91% 2.63% dc.S 6,395 -1.27% 3.66% FileRW 5,748 0.68% 2.24% Overall 38,060 -0.39% 2.78%
4. Conclusions
In this year, we have established a power consumption measurement environment, called PowerMeMo, together with a high-level modeling-based software energy profiling tool, SEProf. PowerMeMo evaluates the power consumption of mobile applications and services in a wireless emulation and mobile environment with user adjustable choices of channel model, mobility pattern and application usage. Which can help the user to understand and diagnose the power consumption behavior of mobile applications/services before field trial/deployment. Some measurements of netbooks and Android phone have be conducted using PowerMeMo, in one of the experiment also shows the importance of incorporating wireless network
configuration into battery life experiment. SEProf estimates the energy consumption of each thread by maintaining a power table list for each thread and tracking the power levels of embedded processors at runtime which makes SEProf more suitable for energy estimation on larger systems with power management enabled. We have implemented SEProf in Linux kernel 2.6.19, and conducted a number of experiments on an ARM11 MPCore processor. Experimental results show that the average power estimation error using SEProf is within 2-4%.
5. Project Self-Assessment
We have released the beta version of the SEProf tool on Open Foundry [10]. The beta version of the PowerMeMo will be released very soon. Also, we have one conference paper which has been accepted [11] and two journal papers [12][13] which are under preparation based on the results of this project.
References
[1] K. Choi, R. Soma, and M. Pedram, "Fine-Grained Dynamic Voltage and Frequency Scaling for Precise Energy and Performance Tradeoff Based on the Ratio of Off-Chip Access to On-Chip Computation Times," IEEE Transactions on Computer-Aided Design of Integrated Circuits and Systems, vol. 24, NO. 1, January 2005.
[2] J. Flinn and M. Satyanarayanan, "PowerScope: A Tool for Profiling the Energy Usage of Mobile Applications," in Proceedings of the Second IEEE Workshop on Mobile Computer Systems and Applications (WMCSA), 1999.
[3] M. Monchiero, R. Canal, and A. Gonzalez, "Power/Performance/Thermal Design-Space Exploration for Multicore Architectures," IEEE Transactions on Parallel and Distributed Systems, Vol. 19, No. 5, May 2008.
[4] V. Tiwari, S. Malik, and A. Wolfe, "Power analysis of embedded software: A first step towards software power minimization," IEEE Transactions on Very Large Scale Integration (VLSI) Systems, Vol. 2, Issue 4, pp. 437-445, Dec. 1994. [5] G. Qu, N. Kawabe, K. Usami, and M. Potkonjak, ―Function-level power estimation methodology for microprocessors,‖in
Proceedings of Design Automation Conference (DAC), pp. 810–813, 2000.
[6] C.-H. Hsu, J.-J. Chen, and S.-L. Tsao, "Evaluation and Modeling of Power Consumption of a Heterogeneous Dual-Core Processor," in the 13th International Conference on Parallel and Distributed Systems (ICPADS), Hsinchu, Taiwan, Dec. 2007.
[7] "ARM11 MPCore Processor Revision r1p0 Technical Reference Manual," ARM, Feb. 2008. [8] J. Levon, "OProfile Internals," http://oprofile.sourceforge.net/doc/internals/index.html, 2003.
[9] H. Jin, M. Frumkin, and J. Yan, "The OpenMP Implementation of NAS Parallel Benchmarks and Its Performance," NAS Technical Report NAS-99-011, NASA Ames Research Center, Oct. 1999.
[10] http://of.openfoundry.org/projects/1398
[11] Jian-Jhen Chen, Shiao-Li Tsao, and Meng-Ru Lin, ―A High-Level Software Energy Profiling Tool for Embedded Processors,‖ The Third Asia Pacific Embedded Systems Education and Research Conference, Singapore, Dec 2009.
[12] Jian-Jhen Chen, Shiao-Li Tsao, and Meng-Ru Lin, ―SEProf: A High-Level Software Energy Profiling Tool for an Embedded System with Dynamic Power Management Functions,‖ in preparation, 2009.
[13] Jyun-Wei Lin and Shiao-Li Tsao, ―Hardware-Assisted Performance/Energy Evaluation Tool for Multi-core Embedded System,‖ in preparation, 2009.
出席國際學術會議心得報告
計畫編號 97-2218-E-009-033- 計畫名稱 嵌入式網路通訊裝置評比技術與工具之研發(中心分項)-子計畫二:嵌入式 網路通訊裝置耗能評比基準與工具之研發 出國人員姓名 服務機關及職稱 曹孝櫟 交通大學資訊工程系助理教授 會議時間地點 澳洲墨爾本 2008/12/08-2008/12/10會議名稱 14th Intl Conference on Parallel and Distributed Systems/Second Asia Pacific Workshop on Embedded Systems Education and Research (APESER 2008) 發表論文題目 A Practical Implementation Course of Operating Systems: Curriculum Design
and Teaching Experiences
一、參加會議經過
本次參加 14th Intl Conference on Parallel and Distributed Systems/Second Asia Pacific Workshop on Embedded Systems Education and Research (APESER 2008)於 2008/12/05 前往澳洲墨爾本, 於 12/08 至 12/10 為期三天參加會議,於 12/11 返國。本次除擔任 Second Asia Pacific Workshop on Embedded Systems Education and Research (APESER 2008)之會議共同主席外,並發表論文” A Practical Implementation Course of Operating Systems: Curriculum Design and Teaching Experiences”。本次會議除參加 Second Asia Pacific Workshop on Embedded Systems Education and Research (APESER 2008),主持會議,參與討論外,另外參加會議第一天以及第二天之 Keynote,分別為 Professor Hamid R. Arabnia, University of Georgia, USA 之” A Scalable and Reconfigurable Network Topology for Medical Imaging”演講以及 Professor Lionel M. Ni, The Hong Kong University of Science and Technology, Hong Kong 之”Digital City Monitoring and Emergency Management”兩場演講皆以應用為主,介紹相當多先進的技術。其中 Professor Lionel M. Ni 近幾年在香港大陸上實際應用視訊圖像處理以及 Sensor Network 的經驗與發現十 分有趣,值得更進一步研究在真實環境中相關技術所遭遇的實際問題。
二、與會心得
本次參與之 Second Asia Pacific Workshop on Embedded Systems Education and Research (APESER 2008)為國內發起專門討論嵌入式系統教學與研究之會議,2007 第一屆亞太地區嵌 入式系統教學與研究會議(The 1st Asia-Pacific Workshop on Embedded System Education and Research, APESER 2007)於新竹舉辦,獲得國際學者肯定,今年繼續在澳洲墨爾本舉辦第二次 會議,亦有相當多亞太學者的參加,會中與來自日本九州大學的 Koji Nakano 教授,來自新加 坡南洋大學的 Ian Vince McLoughlin、Nicholas Vun 教授,以及大陸浙江大學 Wei Hu 博士等針 對近幾年在各國嵌入式研究與教學上遇到的挑戰與研究課題進行討論,有相當不錯的成果。 預計在今年 2009 年繼續舉辦第三屆會議,會議地點將於新加坡或大陸廣東做一選擇,本人亦 會繼續擔任大會共同主席,並繼續在國內以及亞大地區推廣嵌入式教學與研究之活動,促進