Unique approach to measuring temperature variation of surface tension in smectic
liquid crystals
M. Veum, P. Messman, Z. Q. Liu, C. C. Huang, N. Janarthanan, and C. S. Hsu
Citation: Review of Scientific Instruments 74, 5151 (2003); doi: 10.1063/1.1623629
View online: http://dx.doi.org/10.1063/1.1623629
View Table of Contents: http://scitation.aip.org/content/aip/journal/rsi/74/12?ver=pdfcov
Published by the AIP Publishing
Articles you may be interested in
Surface tension and disjoining pressure of free-standing smectic films above the bulk smectic-A-isotropic transition temperature
J. Chem. Phys. 140, 124705 (2014); 10.1063/1.4869197
Colloidal gold nanosphere dispersions in smectic liquid crystals and thin nanoparticle-decorated smectic films
J. Appl. Phys. 107, 063511 (2010); 10.1063/1.3330678
A novel method for measuring the surface tension of free standing smectic films
Rev. Sci. Instrum. 73, 114 (2002); 10.1063/1.1419223
Optical unwinding and reentrance phenomena in chiral smectic-C liquid crystals
Appl. Phys. Lett. 72, 1975 (1998); 10.1063/1.121264
Fluorescent imaging system for global measurement of liquid film thickness and dynamic contact angle in free surface flows
Rev. Sci. Instrum. 68, 4097 (1997); 10.1063/1.1148352
We have measured the temperature variation of surface tension, , in freestanding films of three liquid-crystal compounds. To do so, we have constructed a curvature-pressure tensiometer that uses a feedback loop to hold constant the curvature of a film while the temperature of the system is smoothly ramped. The apparatus enables us to obtain the temperature variation ofin a continuous manner with resolution inof ⬃0.2%. We interpret reproducible features of our data in terms of phase transitions. © 2003 American Institute of Physics. 关DOI: 10.1063/1.1623629兴
I. INTRODUCTION
The study of surface tension is fundamental to the un-derstanding of adhesion, detergency, wetting, etc. The re-markably high surface area to volume ratios of freestanding liquid-crystal films allow unique opportunities to probe the surface properties of these materials. In recent years, a vari-ety of tensiometers have been developed in order to measure the surface tension of freestanding liquid-crystal films.1–5 These efforts have provided a wealth of information, such as the role of molecular and physical structure in determining the value of surface tension.6,7 Studying the temperature variation of surface tension is also of great interest because it allows the investigation of surface ordering as the free sur-face undergoes a phase transition from one molecular ar-rangement to another. Unfortunately, obtaining high-resolution data has proven to be a difficult task. There are two recurring problems that can arise in the techniques ref-erenced above. First, the scatter in data for a given tempera-ture is greater than 1% in most cases. Second, obtaining a single data point is too time consuming to allow for high-resolution measurements with respect to temperature. The techniques referenced have at least one of these problems if not both. One notable success in dealing with both compli-cations simultaneously was our construction of a vibrating drumhead tensiometer.8In this apparatus, the film is vibrated using electric fields. A phase-locked feedback loop ensures that the film vibrates at resonance while the temperature is ramped. Recording the resonance frequency and temperature provides a relative measure of surface tension versus tem-perature. The data scatter with respect to surface tension was reduced to roughly 0.2%. The temperature resolution was practically continuous. Despite the elegance of the experi-ment and the lovely data it can produce, this technique has
complications making interpretation of data less than straightforward. For instance, since the entire film vibrates and the mass per area of the film is one determining factor in the resonant frequency, the meniscus can easily play an im-portant role in determining the resonant frequency. Further-more, any changes in the meniscus during data collection can then introduce shifts in the resonant frequency causing com-plications in data analysis. In addition, such an experiment is dynamic by design. As the film oscillates, material must flow in and out of the film if the film is to maintain a constant density. How the flow rates of a material affect the resonant frequency of vibration is not clear and may not be a simple issue. At a technical level, this experiment is extremely sen-sitive to acoustical vibrations because the resonant frequen-cies tend to be on the order of 1 kHz. Thus, data collection is easily interrupted by very ordinary events such as the sound of a person’s voice. As a result, obtaining the desired tem-perature scans has proven much more elusive than our pre-liminary studies indicated.
We have constructed a new tensiometer to address the shortcomings of the drumhead experiment. Our new tensi-ometer has comparable data scatter and temperature resolu-tion as the drumhead experiment. We have measured the temperature variation of surface tension for three liquid-crystal compounds to demonstrate the effectiveness of this new experimental setup.
II. THEORY BEHIND THE EXPERIMENT
Consider a freestanding film with a surface tension that varies with temperature, (T). It has been established by Stannarius et al.4 that a pressure difference between two sides of a smectic film will induce spherical curvature in a freestanding film共like blowing up a soap bubble on a ring兲.
a兲Electronic mail: [email protected]
5151
0034-6748/2003/74(12)/5151/5/$20.00 © 2003 American Institute of Physics This article is copyrighted as indicated in the article. Reuse of AIP content is subject to the terms at: http://scitationnew.aip.org/termsconditions. Downloaded to IP:
The pressure difference in the radial direction across the film, ⌬P, and the radius of curvature, R, are simply related through the surface tension of the film.
⌬P⫽4共T兲/R. 共1兲
At a given temperature, the pressure difference required to inflate a film to a given radius of curvature is simply propor-tional to the surface tension of the film. Thus, if R is held constant while T is varied, then ⌬P will vary in direct pro-portion to . By recording the⌬P required to hold R con-stant versus T, one obtains the temperature variation of . This is precisely the idea behind our experimental apparatus.
III. EXPERIMENT
A. Making a bubble and controlling the pressure difference
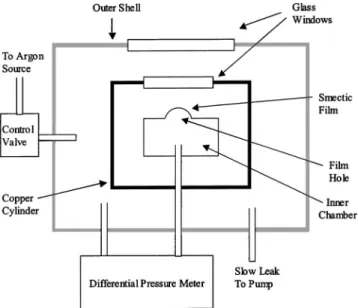
The freestanding films are prepared in a three-staged oven as depicted in Fig. 1. The outer shell is an airtight aluminum cylinder so that the film can be contained in a pressure-controlled environment of argon. With the excep-tion of a circular hole共diameter of 0.95 cm兲, the inner stage is an airtight stainless-steel chamber. The liquid-crystal films are prepared across the circular opening in the inner stage. When a film is prepared, the inner chamber becomes sealed from the outer stages. The intermediate stage is a temperature-controlled copper cylinder 共not airtight兲 allow-ing smooth rampallow-ing of the ambient temperature of the film. The oven is weakly coupled to a mechanical pump, causing a slow evacuation. The oven is also coupled to an argon source through a control valve共MKS Type-148C兲.9A pressure con-troller共MKS Type-250兲 manipulates the control valve in or-der to regulate the pressure of the outer stages. Since the inner stage is sealed by the film, the controller regulates the
pressure difference between the inner and outer stages. Our tests indicate that the permeability of argon molecules through the film is very low. An MKS Type-223b differential capacitance manometer 共0.2 Torr full scale, resolution of 2 ⫻10⫺5Torr) measures the pressure difference. The signal
from the manometer 共a voltage proportional to the pressure difference兲 provides feedback to the pressure controller. The set point of the controller is simply manipulated by an exter-nal dc voltage, referred to as the ‘‘control voltage.’’ For our setup, the radius of curvature of a bubble is roughly 1 cm and the pressure difference is stable to within ⫾3⫻10⫺5Torr. The key thing to notice is that the pressure difference is effectively manipulated and easily recorded to high resolu-tion, since it is only a matter of providing and recording a dc voltage.
B. Holding the bubble radius constant
Figure 2 shows a schematic of the system used to hold R constant. A chopped intensity-stabilized He–Ne laser beam is reflected from the bubble to a position-sensitive photodi-ode共UDT type SC-10D兲.10Since the path of the reflected ray is determined by the radius of the bubble, holding R constant is then simply a matter of keeping the reflected beam spot at the same position on the photodiode. This was accomplished by constructing a proportional-integral-differential feedback system that interfaces the signal from the photodiode with the pressure-control system. The photodiode is designed to have a null signal when the beam spot is centered on the detector. As shown in Fig. 2, the output of the photodiode is input to a lock-in amplifier that is tuned to the chopping frequency. The computer reads the signal of the lock-in am-plifier and accordingly outputs a voltage to drive the pressure controller 共i.e., the control voltage兲. If the signal of the lock-in amplifier wanders from zero 共i.e., if the beam spot moves from the center of the photodiode兲, the computer ad-justs the control voltage to bring the signal back to zero共i.e., bring the beam spot back to the center of the photodiode兲. With the feedback system operating, the computer simulta-neously records the control voltage and the film–plate tem-perature as the temtem-perature of the oven is ramped. The
con-FIG. 1. Three-staged oven that houses the smectic films. The inner and outer chambers are sealed from one another when a film is prepared in the film hole. The pressure in the outer stages is manipulated by means of a control valve. The film is inflated by slightly closing the control valve to decrease the pressure in outer stages. A differential pressure meter measures the pressure difference between the inner and outer stages. The intermediate stage is the heater.
FIG. 2. System used to hold bubble radius constant. A mechanically chopped laser beam is reflected from the film to the center of a position-sensitive detector. A lock-in amplifier reads the detector signal and is output to the computer. The computer drives the pressure controller in order to keep the laser beam centered on the detector.
5152 Rev. Sci. Instrum., Vol. 74, No. 12, December 2003 Veumet al.
trol voltage is then scaled into absolute units by measuring surface tension with our flexible-string tensiometer.2
IV. RESULTS AND DISCUSSION
We measured the temperature variation of for three compounds, HOPDOB, MHPBC, and 12CB. The chemical structures and phase sequences are shown in Fig. 3.
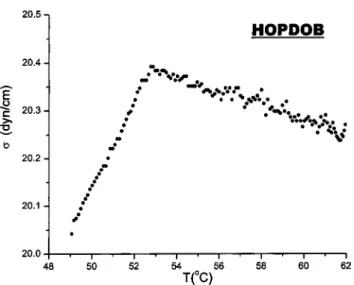
In order to give our system a critical test, we made mea-surements on the liquid-crystal compound HOPDOB. In two distinct experiments, the temperature variation ofhas been studied for this material.8,11Upon cooling, both previous ex-periments show a sharp slope change from negative to posi-tive near T⫽53 °C. This feature is explained by recalling that the temperature derivative ofis directly related to the excess surface entropy per unit area, s:
d/dT⫽⫺s. 共2兲
As the surface undergoes an ordering transition, s can change from positive to negative. A slope change as seen in the HOPDOB data is indicative of a surface ordering transition. Our system reproducibly shows the same slope change as previously seen. Figure 4 shows one such data run. First, notice that the scatter in the data is roughly 0.2%, compa-rable to the results of our drumhead experiment. Addition-ally, the temperature resolution is also practically continuous by nature of the experimental design. Analyzing a 3 K tem-perature window just below the anomalous change in slope,
our data indicate that the surface tension changes by 共0.452 ⫾0.002兲% per K over this range. Analyzing the surface ten-sion data reported in Ref. 11 within the same temperature window, we get a slope of 共0.44⫾0.09兲% per K, assuring us that the two data sets are quantitatively consistent.
We also made measurements on the compound MHPBC. In doing so, we found some surprising results. Differential optical reflectivity 共DOR兲 measurements show a surface transition from SmA to SmC*␣ near T⫽101.5 °C.12 We carefully scanned a wide temperature window共67 to 109 °C兲 but were not able to detect any anomalies in our data asso-ciated with surface or bulk phase transitions in MHPBC. Unlike with HOPDOB, it seems that the change in excess surface entropy for the 101.5 °C surface transition in MH-PBC is too small to be resolved by our probe. Understanding the reasons behind this will require further study. An unex-pected reproducible feature, however, does show up near the bulk SmA to isotropic transition near T⫽109 °C 共see Fig. 5兲. The slope, d/dT, changes from positive to negative upon cooling. It would be naı¨ve to claim that this anomalous change in the surface tension is simply due to a surface tran-sition as in HOPDOB. One problem is that the slope change is the reverse of what one expects for surface enhanced or-dering as predicted by Eq. 共2兲. Additionally, as far as we know, there is not any reason to expect a surface transition at this particular temperature. The surface layer is already in the SmA phase, so a transition to an intermediate phase before melting to isotropic is not logical. Incidentally, this feature showed up in an optically pure sample as well as in a race-mic mixture of the compound.
To understand the origin of this feature, we needed to rule out mechanisms that are not due to the surface tension itself. It is natural to speculate that as the reservoir of mate-rial on the film plate melts, the anchoring position of the bubble will shift due to the flow of material as it more fully spreads out on the plate. Such a process would be irrevers-ible. Figure 5 shows a cooling run and a subsequent heating FIG. 3. 共a兲–共d兲 The molecular structures of HOPDOB, MHPBC, 12CB, and
4M6OBF5MOP, respectively. Transition temperatures are in degrees centi-grade.
FIG. 4. Temperature variation of surface tension obtained from an HOPDOB film. The slope change in the vicinity of 53 °C suggests a surface transition. The units on the vertical axis were scaled from surface-tension
data共in Ref. 11兲.
run. As one can see in Fig. 5, the feature is reversible upon cooling and heating, ruling out this first possibility. The re-producibility shown near the SmA–isotropic transition gives assurance that once the anchoring position of a film is estab-lished, that position is robust. This important issue will be addressed again later in the article.
A second possibility is that upon approaching the isotro-pic phase, the material undergoes a change in optical prop-erties that shifts the path of the reflected ray, mimicking a change in surface tension. DOR measurements, however, show no dramatic changes in the optical properties of the material upon approaching the isotropic transition. The DOR probe is designed specifically to probe optical changes. It is highly improbable that the tensiometer is more sensitive to optical changes than the DOR experiment, particularly when considering the fact that the tensiometer shows no anomalies for the many transitions clearly observed by DOR.
Having ruled out these possibilities, we will speculate upon how the surface tension itself might be responsible. It has been definitively shown that the value of surface tension for a freestanding liquid-crystal film is determined by the molecular group exposed at the free surfaces of the film.6,7A surface composed ofuCH3 groups will have a surface
ten-sion of roughly 21 dyn/cm, whereas surface composed of uCH2u groups will have surface tension of roughly 31
dyn/cm. A surface composed partially of uCH3’s and uCH2u’s will have some weighted average of these
val-ues. The molecular structure of MHPBC is typical to many smectic liquid crystals in that it has flexible hydroalkyl tails on each end of the molecule 共see Fig. 3兲. A closely packed SmA surface layer with such a compound will yield a value of ⬃21 dyn/cm since only the uCH3 end group will be
exposed. Using our flexible-string tensiometer,2 we have measured a value of 21.4 dyn/cm at 104 °C, indicating a closely packed surface at this temperature. In contrast, it has been seen that if these flexible tails have space to conforma-tionally explore, then the surface tension will be increased
because some fraction of the tails will fold over and expose uCH2u groups at the surface. This effect has been seen in
two separate cases.6,13In the case of 12CB, the bilayer struc-ture leads to the exposure of uCH2u groups at the film surfaces and a measured surface tension of 27.1 dyn/cm共see Ref. 6 for further discussion兲.
These ideas lead to a plausible explanation for our data. As the film approaches the SmA–isotropic transition, fluc-tuations in the layer structure become more pronounced. The flexible tails then have more space to conformationally ex-plore, exposing moreuCH2u’s and increasing the average
surface tension of the film. The observed increase in surface tension above 107 °C is about the resolution of our flexible-string tensiometer. Further investigations are necessary to confirm or reject this speculation.
We also made measurements on the compound 12CB. Figure 6 shows such a run. Upon heating, the crystal–SmA transition temperature occurs at 48 °C, the bubble can be supercooled and remains stable far below this temperature. Notice that the subsequent cooling and heating runs very nearly overlap. We believe the small offset is due to slight adjustment of the anchoring position of the bubble to the meniscus during the long temperature ramp. From the repro-ducibility over such a wide temperature window, we are again assured that once the anchoring position of a bubble is established, that position is robust. Schneider used a double-ring tensiometer to measure versus T on the compound 8CB.5Although 8CB and 12CB most likely should not have exactly the same slope, we thought a comparison would give a further sense of the reliability of our data. Comparing the average slope over a 15 K window, we find that the values are within 5% of one another 共⫺0.21% per K for 12CB and ⫺0.20% per K for 8CB兲. The consistency between these two very different experimental techniques gives further evidence that our probe reliably records the relative values of surface tension as a function of temperature. Schneider’s apparatus provides significantly better resolution with respect tothan ours (2⫻10⫺5 and 2⫻10⫺3, respectively兲, but acquiring FIG. 5. Subsequent cooling共open circles兲 and heating runs, showing
tem-perature variation of surface tension obtained from an MHPBC film. The slope change in the vicinity of 107 °C is the opposite of what is expected for a surface ordering transition. The units on the vertical axis were scaled from surface tension values obtained with our flexible-string tensiometer.
FIG. 6. Subsequent cooling共open circles兲 and heating runs, showing tem-perature variation of surface tension obtained from a 12CB film. The units on the vertical axis were scaled from surface tension values obtained with our flexible-string tensiometer.
5154 Rev. Sci. Instrum., Vol. 74, No. 12, December 2003 Veumet al.
temperature data with the two-ring experiment is very cumbersome.
In addition to comparing our temperature scans to those of other research groups, we also compared recorded control voltages from compound to compound. Ideally, one can sim-ply compare the ratio of the control voltages for two com-pounds and compare this to the ratio of surface tensions mea-sured by other means. In order to make such a comparison meaningful, it is crucial that the optical components are not moved since even a slight adjustment of a single mirror, lens, or window can lead to a noticeable change in the control voltage necessary to center the laser beam on the photodiode. This is practically impossible to accomplish from sample loading to sample loading because cleaning the chamber nec-essarily means removing two of the windows through which the laser beam travels. Additionally, it is also practically im-possible to ensure that the anchoring of the bubble to the meniscus will remain the same from film to film, let alone from one compound to the next. Our studies indicate that from film to film with a single compound, there is a spread in the control voltages of roughly ⫾3%. Recall, however, that the anchoring position for any given bubble is robust, as evidenced by the reproducibility upon cooling and heating in Figs. 5 and 6. Despite these complications, we felt it impor-tant to run this additional test of our system. For three com-pounds loaded in succession共4M6OBF5MOP, MHPBC, and 12CB兲, we recorded the control voltages necessary to center
ACKNOWLEDGMENTS
The authors are grateful to A. Cady, D. A. Olson, X. F. Han, and S. T. Wang for technical help and useful discus-sions. One of the authors共M.V.兲 acknowledges financial sup-port from the University Professional Development Commit-tee at the University of Wisconsin—Stevens Point. Another author 共P.M.兲 acknowledges financial support from the Na-tional Science Foundation’s REU program. This research was supported in part by the National Science Foundation, Solid State Chemistry Program under Grant No. DMR-0106122.
1K. Miyano, Phys. Rev. A 26, 1820共1982兲.
2T. Stoebe, P. Mach, and C. C. Huang, Phys. Rev. E 49, R3587共1994兲. 3
M. Eberhardt and R. B. Meyer, Rev. Sci. Instrum. 67, 2846共1996兲.
4R. Stannarius and C. Cramer, Liq. Cryst. 23, 371共1997兲. 5F. Schneider, Rev. Sci. Instrum. 73, 114共2002兲.
6P. Mach, C. C. Huang, T. Stoebe, E. D. Wedell, T. Nguyen, W. H. de Jeu,
F. Guittard, J. Naciri, R. Shashidhar, N. Clark, I. M. Jiang, F. Kao, H. Liu, and H. Nohira, Langmuir 14, 4330共1998兲.
7P. Mach, C. C. Huang, and H. T. Nguyen, Phys. Rev. Lett. 80, 732共1998兲. 8M. Veum, C. Pettersen, P. Mach, P. A. Crowell, and C. C. Huang, Phys.
Rev. E 61, R2192共2000兲.
9
MKS Instruments, Inc., Andover, MA.
10United Detector Technology, Hawthorne, CA.
11H. Schuring, C. Thieme, and R. Stannarius, Liq. Cryst. 28, 241共2001兲. 12A. Cady, Z. Q. Liu, S. T. Wang, M. Veum, N. Janarthanan, C. S. Hsu, D.
A. Olson, and C. C. Huang, Phys. Rev. E 66, 061704共2002兲.
13
H. R. Keymeulen, W. H. de Jeu, J. T. Slattery, and M. Veum, Eur. Phys. J. E 9, 443共2002兲.