doi:10.1006/jssc.1999.8585, available online at http://www.idealibrary.com on
Systematic Tuning of the Luminescent Properties of Self-Activated
ZnGa
2O
4Phosphors by Cd Ion Substitution
Teng-Ming Chen
1 and Y.-W. Chen
Department of Applied Chemistry, National Chiao Tung University, Hsinchu 30050, Taiwan Received August 24, 1999; in revised form November 3, 1999; accepted November 22, 1999
The e4ect of host compositions on the luminescent properties of spinel-type ZnGa2O4phosphors was investigated by
system-atic substitution of Cd21for Zn21in the host lattice. A continu-ous solid solution with the composition (Zn12xCdx)Ga2O4
(04x41.0) was synthesized at 9503C as self-activated phos-phors, as indicated by X-ray di4raction (XRD) analysis. With increasing substitution of Cd21 the emission and excitation wavelengths (kem and kexc) of self-activated (Zn12xCdx)Ga2O4
were observed to exhibit a red shift, as indicated by photo-luminescence spectral analysis. Similar results were also con-5rmed by cathodoluminescence data. Our observations are attributed to the systematic narrowing of the energy gap of the host attributed to expanding lattice dimensions induced by Cd21 substitution. A CIE chromaticity diagram manifests the e4ect of Cd21doping on variation of hue for the (Zn12xCdx)Ga2O4gallate
phosphors. ( 2000 Academic Press
Key Words: (Zn12xCdx)Ga2O4 phosphor; Cd21 substitution;
self-activation; photoluminescence; chromaticity diagram.
INTRODUCTION
Identi"cation of suitable phosphors for applications in electroluminescent displays (ELDs), plasma display panels (PDPs), and "eld emission displays (FEDs) has been a great challenge to materials chemists in the area of #at panel display technology. The luminescent properties of ZnGa2O4 phosphor have been actively investigated re-cently for use in thin-"lm ELDs (1, 2) and low-voltage FEDs (3), owing to its excellent chemical and thermal stability (4) as compared with sul"de phosphors. It has been suggested that low electrical resistance, low threshold voltage, and excellent crystallinity are highly desirable for applications in low-voltage cathodoluminescence FEDs (5). Furthermore, undoped ZnGa2O4 host lattice (with bandgap ca. 4.4 eV) itself emits strong blue light which was attributed to a transition via a self-activation center under ultraviolet or 1To whom correspondence should be addressed. E-mail: tmchen@ cc.nctu.edu.tw. Fax: 886#35723764.
low-voltage electron (e.g., 30 V dc) excitation (4, 6, 7). Most importantly, high luminance multicolor emissions have been realized in thin-"lm ELDs with a Mn2`-, Cr3`-, or rare earth-activated ZnGa2O4 thin-"lm emitting layer (1). One of the e!ective alternatives to identify the possible applications of ZnGa2O4 and related phosphors for FED or thin-"lm ELD uses is to tune the luminescent properties of ZnGa2O4 by modifying the host constituents or composi-tions (i.e., substitution of Zn2` with Cd2` or Ga3` with Al3`). However, only a limited number of investigations on the host compositional dependence of photoluminescence (PL) or cathodoluminescence (CL) of ZnGa2O4 have ap-peared in the literature (8, 9). This work is essentially moti-vated by the quest to acquire a deeper insight into the materials nature of ZnGa2O4, by the possibility of identify-ing more promisidentify-ing gallate phosphors, and by the ability to tune their luminescent properties. We report the composi-tion and constituent e!ects (i.e., substitucomposi-tion of Zn2` with di!erent amounts of Cd2`) on PL and CL spectra and hue variations of self-activated ZnGa2O4 phosphors.
EXPERIMENTAL
Samples of (Zn1~xCdx)Ga2O4 (ZCGO) phases with
x"0, 0.2, 0.4, 0.6, 0.8, and 1.0 were synthesized by grinding
a mixture of stoichiometric amounts of ZnO (99.9%), CdO (99.5%), and Ga2O3 (99.99%). The mixture was placed in the furnace and heated in air at several trial temperatures of 950, 1000, and 13003C for 12 h, respectively, and then slowly cooled to ambient temperature. Sample purity was "rst checked and structure analysis was then carried out by X-ray di!raction (XRD) by using a Mac Science MXP-3 automatic di!ractometer with CuKa radiation (j" 1.5418 As ). The excitation and #uorescence emission spectra of ZCGO phases were measured at ambient temperature with a Shimadzu RF5301 PC spectro#uorophotometer equipped with a 150-W Xe lamp. The excitation spectra could be obtained by scanning the wavelength from 220 to 700 nm monitored at optimal emission wavelength (j%.) of 438 to 540 nm.j%. was scanned and recorded from 400 to 204
0022-4596/00 $35.00
Copyright( 2000 by Academic Press All rights of reproduction in any form reserved.
FIG. 1. XRD pro"les of samples with nominal (Zn1~xCdx)Ga2O4 composition prepared under di!erent synthetic conditions (asterisks indicate Ga2O3 as an impurity).
700 nm excited at 254 nm. CL spectra of ZCGO phases were measured with a Topcon DS-CL-B CL spectrometer using an electron beam with excitation voltage of 10 kV and current density of 10 mA/cm2.
RESULTS AND DISCUSSION Synthesis of (Zn1~xCdx)Ga2O4 Phases
The conditions for synthesis of (Zn1~xCdx)Ga2O4 phases are uncertain and, hence, attempts to obtain pure samples with di!erent Cd2` contents have been made by investigat-ing several trial synthesis conditions and characterizinvestigat-ing their purity by XRD pro"le analysis. The results are sum-marized in Figs. 1a to 1e and the XRD pro"le of CdGa2O4 shown in Fig. 1e was found to be essentially X-ray pure. Synthesis temperatures higher than 9503C were discovered to drastically promote the volatility of CdO, and cause loss of CdO and the pro"les for samples in Figs. 1a through 1d indicate the presence of Ga2O3 (labeled with asterisks) as an impurity phase. We found that the key to success in syn-thesizing ZCGO is to adopt a temperature of 9500C or lower so that the volatility of CdO can be e!ectively mini-mized. However, our results are apparently inconsistent with those reported by Choi et al. (9) who claimed that a solid solution of (Zn1~xCdx)Ga2O4 could only be
syn-thesized at 12003C for 4 h in the composition range 04x40.6. At the temperature adopted by Choi et al. we found that CdO is extremely volatile and stoichiometry is not conserved, as indicated by the XRD pro"les shown in Figs. 1a to 1d.
XRD Proxles and Structure Analysis
The indexed XRD pro"les of (Zn1~xCdx)Ga2O4 phases with x"0, 0.2, 0.4, 0.6, 0.8, and 1.0 are represented in Figs. 2a to 2f, respectively. All of the di!raction peaks of ZCGO phases with di!erent x values have been indexed with a cubic spinel structure. Furthermore, the lattice constants (a0) as a function of x for cubic (Zn1~xCdx)Ga2O4 phases shown in Fig. 3 were calculated by using a least-squares re"nement program based on the indexed XRD pro"les shown in Fig. 2. The magnitude of
a0 was found to increase steadily with increasing x.
Further-more, the possibility of Ga3` substitution by Cd2` ions has been ruled out due to the large di!erence in ionic radii between six-coordinated Cd2` (0.95 As) and Ga3` (0.62 As) ions (10). Hence, a complete solid solution of (Zn1~xCdx)Ga2O4 is expected to form, as revealed by the excellent linear relationship between a0 and x shown in Fig. 3.
FIG. 2. Indexed XRD pro"les for ZCGO phases synthesized at the optimal temperature of 9503C for 12 h: x"(a) 0, (b) 0.2, (c) 0.4, (d) 0.6, (e) 0.8, and (f ) 1.0.
FIG. 3. Lattice constants as a function of x for cubic (Zn1~xCdx)Ga2O4 solid solution.
FIG. 4. PL spectra for self-activated (Zn1~xCdx)Ga2O4 phases as a function of x: (A) excitation, (B) emission.
Photoluminescence and Cathodoluminescence Spectra
In an attempt to understand how host compositions or structural changes a!ect the excitation and #uorescence emission spectra of (Zn1~xCdx)Ga2O4 phases, we have measured the PL excitation and emission spectra of (Zn1~xCdx)Ga2O4 phases with a Shimadzu RF5301 PC spectro#uorophotometer and the data are summarized in
Figs. 4A and 4B, respectively. As expected, with increasing substitutional level of Cd2` from 0 to 1.0 the emission and excitation wavelengths (j%. and j%9#) of self-activated (Zn1~xCdx)Ga2O4 were observed to exhibit a continuous red shift from 438 nm (x"0) to 538.4 nm (x"1.0) and from 255 nm (x"0) to 326 nm (x"1.0), respectively, as in-dicated by PL spectral analysis. These observed red shifts of j%. and j%9# can be rationalized by the fact that the relative
TABLE 1
Comparison of Stokes Shifts for (Zn12xCdx)Ga2O4Phases with
04x41.0 x j (cm~1) 0 0.2 0.4 0.6 0.8 1.0 Excitation maximum 39,277 39,032 37,258 35,286 31,646 30,581 Emission maximum 22,831 22,769 21,786 20,747 19,135 18,574 Stokes shift 16,446 16,263 15,471 14,539 12,510 12,007
FIG. 5. CL spectra for self-activated (Zn1~xCdx)Ga2O4 phases with x"(a) 0, (b) 0.2, (c) 0.4, (d) 0.6, (e) 0.8, and (f ) 1.0.
four-coordinated (spinel A site) ionic radius of Cd2` (0.84 A_) is 28% larger than that of Zn2` (0.60 A_) (10) and the optical bandgap of (Zn1~xCdx)Ga2O4 phases tends to become narrower on increasing the substitution level of Cd2`. The latter observation can be attributed to the expansion of host lattice dimensions. Furthermore, the intensity of both exci-tation and emission peaks was found to decrease with in-creasing Cd2` content and eventually #atten out as the Cd2` content increases up to 1.0. A similar trend in the deterioration of luminescence intensity of ZnGa2O4 on ca-tion doping has also been observed and reported by Jeong
et al. in the investigation of self-activated Zn(Ga1~xAlx)2O4
phases (8). In principle, this problem can be foreseen in doped phosphors and may be solved by improving the transition probability or energy e$ciency involved in the emission process, which is beyond the scope of this work. Or otherwise, in practical applications appropriate pigments are generally coated on the particle surfaces to compensate for the deterioration in luminescence intensity of phosphor materials on cation doping.
The comparison of Stokes shifts for (Zn1~xCdx)Ga2O4 phases with 04x41.0 is also summarized in Table 1 to illustrate the e!ect of Cd2` substitution on energy e $cien-cy. Similar Stokes shifts ranging from 17,000 to 20,500 cm~1 have also been observed in oxo compounds with d10 or
d0 con"guration such as LiGaO
2(18,000 cm~1), Zn4B6O13 (18,000 cm~1), and KSbSiO5 (20,500 cm~1) (11). The ob-served intrinsic broad optical emission of gallate host lattice present in (Zn1~xCdx)Ga2O4 phases has been attributed to a self-trapped exciton (12) or a charge transfer (13)-type mechanism and is expected to shift to lower energies if the formal charge of the central cation increases (11). On the other hand, a large Stokes shift of the emission peaks is also expected in view of the considerable relaxation or mobility of the excited state after optical absorption.
In addition, the composition-dependent CL spectra of ZCGO phases were measured with a Topcon DS-CL-B CL spectrometer using an electron beam with excitation voltage of 10 kV and current density of 10 mA/cm2 and the spectra are shown in Fig. 5. Our data are again inconsistent with those reported by Choi et al. (9) in both the full width at half-maximum (FWHM) andj%. in the CL spectra which
requires further investigations. The emission peaks of ZCGO phases were also found to shift toward longer wavelength and this trend is in good agreement with that observed in the corresponding PL spectra for the ZCGO phases described previously. The electron beam heats up the (Zn1~xCdx)Ga2O4 lattice when the samples are excited. Due to the thermal e!ect, the FWHM of the CL spectrum was observed to become much wider than those observed in the corresponding PL spectra as shown in Fig. 5.
Chromaticity Diagram
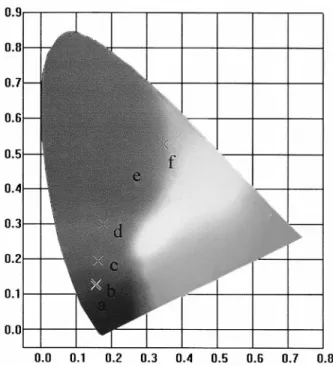
To determine the variation of hue attributed to the com-position changes in ZCGO phases, we calculated the Com-mission Internationale de l'Eclairage (CIE) chromaticity coordinates for ZCGO phases with di!erent Cd2` dopant contents from the corresponding PL spectra; a chromaticity diagram is presented in Fig. 6. We have found that the hue of (Zn1~xCdx)Ga2O4 phases under ultraviolet excitation varied from blue (x"0) with chromaticity coordinates 0.156, 0.124 to greenish blue, aqua, green, and eventually yellowish green (x"1.0) with coordinates 0.347, 0.527. These observations are consistent with the observed shifting ofj%. from 438 nm (x"0) to 538 nm (x"1.0) observed in the PL spectra shown in Fig. 4B.
CONCLUSION
We have investigated the synthesis of a series of self-activated Cd2`-doped ZnGa2O4 phosphors and studied the e!ect of host compositions and constituents on their luminescence properties. Bothj%9# and j%. measured from the PL and CL spectra of (Zn1~xCdx)Ga2O4 phases exhib-ited signi"cant red shifts when Cd2` was doped into the
FIG. 6. CIE chromaticity diagram for (Zn1~xCdx)Ga2O4 phases with x"(a) 0, (b) 0.2, (c) 0.4, (d) 0.6, (e) 0.8, and (f ) 1.0.
host lattice and replaced tetrahedrally coordinated Zn2` cations. This work has demonstrated an innovative method of systematically tuning emissive hues through the formation of a series of (Zn1~xCdx)Ga2O4 solid solutions.
ACKNOWLEDGMENT
We are grateful to the National Science Council of Taiwan, R.O.C., for generous "nancial support under Contracts NSC88-2113-M-009-013 and NSC89-2113-M-009-014.
REFERENCES
1. T. Minami, Y. Kuroi, T. Miyata, H. Yamada, and S. Tanaka, J. ¸uminescence 72+74, 997 (1997).
2. T. Minami, T. Maeno, Y. Kuroi, and S. Tanaka, J. <ac. Sci. ¹echnol. A 14, 1736 (1996).
3. L. E. Shea, R. K. Datta, and J. J. Brown, Jr., J. Electrochem. Soc. 141, 2198 (1994).
4. S. Itoh, H. Toki, Y. Sato, K. Morimoto, and T. Kishino, J. Electrochem. Soc. 138, 1509 (1991); S. Itoh, T. Kimizuka, and T. Tonegawa, J. Electrochem. Soc. 136, 1819 (1989).
5. S.-H. Yang and M. Yokoyama, Jpn. J. Appl. Phys. 36, 5145 (1997). 6. I. J. Hsieh, K. T. Chu, C. F. Yu, and M. S. Feng, J. Appl. Phys. 76, 3735
(1994).
7. T. Omata, N. Ueda, N. Hikuma, K. Ueda, H. Mizoguchi, T. Hashi-moto, and H. Kawazoe, Appl. Phys. ¸ett. 62, 499 (1993).
8. I.-K. Jeong, H. L. Park, and S. -I. Mho, Solid State Commun. 105, 179 (1998).
9. S. K. Choi, H. S. Moon, S.-I. Mho, T. W. Kim, and H. L. Park, Mater. Res. Bull. 33, 693 (1998).
10. R. D. Shannon and C. T. Prewitt, Acta Crystallogr. B 25, 925 (1969). 11. T. M. J. de Bruin, M. Wiegel, G. J. Dirksen, and G. Blasse, J. Solid State
Chem. 108, 397 (1993).
12. G. J. Dirksen, A. N. J. Ho!man, T. P. van de Bout, M. P. G. Laudy, and G. Blasse, J. Mater. Chem. 1, 1001 (1991); T. Harwig, F. Kellendonk, and S. Slappendel, J. Phys. Chem. Solids 39, 675 (1978).