PII: S0301-5629(02)00528-8
●
Original Contribution
USE OF THE BOOTSTRAP TECHNIQUE WITH SMALL TRAINING SETS
FOR COMPUTER-AIDED DIAGNOSIS IN BREAST ULTRASOUND
D
AR-R
ENC
HEN,* W
EN-J
IAK
UO,
‡R
UEY-F
ENGC
HANG,
‡W
OOK
YUNGM
OON§and
C
HENGC
HUNL
EE†*Departments of GENERALSURGERY; and†Medical Research, China Medical College & Hospital, Taichung, Taiwan;
‡
Department of Computer Science and Information Engineering, National Chung Cheng University, Chiayi, Taiwan; and§
Department of Diagnostic Radiology, Seoul National University Hospital, Seoul, South Korea
(Received 5 October 2001; in final form 3 April 2002)
Abstract—The purpose of this study was to test the efficacy of using small training sets in computer-aided diagnostic systems (CAD) and to increase the capabilities of ultrasound (US) technology in the differential diagnosis of solid breast tumors. A total of 263 sonographic images of solid breast nodules, including 129 malignancies and 134 benign nodules, were evaluated by using a bootstrap technique with 10 original training samples. Texture parameters of a region-of-interest (ROI) were resampled with a bootstrap technique and a decision-tree model was used to classify the tumor as benign or malignant. The accuracy was 87.07% (229 of 263 tumors), the sensitivity was 95.35% (123 of 129), the specificity was 79.10% (106 of 134), the positive predictive value was 81.46% (123 of 151), and the negative predictive value was 94.64% (106 of 112). This analysis method provides a second opinion for physicians with high accuracy. The new method shows a potential to be useful in future application of CAD, especially when a large database cannot be obtained for training or a newly developed ultrasonic system has smaller sets of samples. (E-mail: [email protected]) © 2002 World Federation for Ultrasound in Medicine & Biology.
Key Words: Ultrasound, Bootstrap, Decision-tree model.
INTRODUCTION
Ultrasound (US) and mammography have been widely accepted imaging modalities used for the classification of breast lesions. The goal of breast imaging is normally to detect and characterize breast masses and microcalcifi-cations. The major goal of US breast imaging is normally to look at lesions. Mammography has proven to be the most sensitive technique for breast imaging; sonography has been used as an adjunct to mammography. Breast US has proven useful primarily for differentiating cysts from solid tumors and in the initial evaluation of symptomatic young or pregnant women (Stavros et al. 1995; Jackson et al. 1996; Bassett et al. 1997; Arger et al. 2001; Giger et al. 1999). However, the sonographic technique de-scribed by Stavros and colleagues required an extensive real-time evaluation by an experienced interpreter. Clin-ically, physicians sometimes did not feel comfortable basing decisions on sonographic characteristics, and
thorough knowledge of clinical risk factors can lead to the categorization of patients into groups with relatively high rates of indeterminate or malignancy warranting biopsy. Subsequently, parenchyma deformity following excision biopsy may confound future mammograms and sonograms. To increase the physician’s diagnostic con-fidence is the way to decrease unnecessary biopsies. Previous authors have attempted to use sonography as an adjunct to mammography to increase the positive predic-tive value of breast biopsies, to the proposed goal of 41% to 51% set by Hall et al. (1988) and Ciatto et al. (1987). Raza and Baum (1997) indicated that sensitivity and negative predictive value could be achieved in 100% while maintaining the PPV at 50% by adding power Doppler in addition to grey-scale US findings.
Recent progress in computer-aided diagnosis (CADx) systems demonstrated that the application of a CADx system could increase the diagnostic confidence for a physician and provide one possible solution to improve the PPV of breast biopsy. In our previous stud-ies (Chen et al. 1999, 2000a, 2000b), we showed that a CAD system can enhance the diagnostic performance of
Address correspondence to: Dar-Ren Chen, M.D., Department of General Surgery, China Medical College & Hospital, 2 Yer-Der Rd, Taichung, Taiwan. E-mail: [email protected]
Printed in the USA. All rights reserved 0301-5629/02/$–see front matter
radiologists, if it is used as a second opinion. However, the main disadvantage of these methodologies is that a large number of samples would have to be collected to construct the models or rules adopted for the CADx system in advance. In this study, we propose a novel diagnosis system with a bootstrap technique that requires only very few original samples to construct the diagnosis model. It is of great use, especially for the situation when a database has few historical cases, or initially for a new US system while collecting the historical cases.
For most currently available US machines, all that would be required for the CAD system is a personal computer with the proposed CAD software. However, it is a challenge to automatically segment a tumor from a digitized image by using a computer. In this work, a physician first extracted a region-of-interest (ROI), and then the computer analyzed the subimage, using intensity variation and texture information. In regard to ROI se-lection for texture analysis, making a rectangular shape outside the tumor is the easier way for computer appli-cations. Although the previous study (Chen et al. 2000a) showed that combining multiple views in ROI selection may provide better results than using a single view, this is time-consuming.
Image texture analysis plays an important role in CADx systems. The co-occurrence matrix is a popular second order statistical feature used to represent texture information (Roux et al. 1997; Valckx et al. 1997). Although it characterizes the spatial interrelationship in a texture pattern, the evaluation cost of a co-occurrence matrix is high. Thus, statistical parameter matrices de-fined in the Materials and Methods section, including contrast, covariance and dissimilarity reserving texture properties were used instead of a co-occurrence matrix. Most techniques assume that the size of the available set of sample values is sufficiently large, so that “asymp-totic” results can be applied. However, this assumption cannot be made, either because of time constraints or because the process is nonstationary and only small portions of stationary data are considered in most cases. The bootstrap method was introduced by Efron (1979a, 1979b, 1981, 1982) (Efron and Tibshirani 1993) as an approach to calculate confidence intervals for parameters in circumstances where standard methods cannot be ap-plied. The bootstrap method has subsequently been used to solve many other problems that would be too compli-cated for traditional statistical analysis. The bootstrap method is an extremely attractive tool, in that it requires very little in the way of modeling, assumptions or anal-ysis, and it can be applied in an automatic way.
In this study, we propose a novel diagnosis system with the bootstrap technique, in which inter-pixel corre-lation on the US images was used to differentiate benign and malignant tumors. Only very few original samples
are needed to resample the data for constructing a diag-nosis model.
MATERIALS AND METHODS
Data acquisition
The ultrasonic image database contained 263 sono-graphic images of pathologically proven (either by fine needle cytology, core-needle biopsy or open biopsy) benign breast tumors from 134 patients and carcinomas from 129 patients (tumor size⬎ 0.8 cm in all cases). The database contained only one image from each patient. The ultrasonic images were captured at the largest diam-eter of the tumor. The images were collected from June 1, 1999 to May 31, 2000; the patients’ ages ranged from 18 to 64 years. Sonography was performed using an HDI 3000 system and an L10-5 38-mm linear transducer with freeze-frame capability. Dynamic range and mapping were set at 55 dB and 6 separately. No acoustic stand-off pad was used in any of the cases. The sonographic gain setting remained unchanged throughout the entire period of study, except for small changes made to obtain a better view in a few cases.
The monochrome ultrasonic image was quantized into 8 bits (i.e., 256 grey levels), and was stored on the magneto-optical disks in the US scan machine. The en-tire databases were supplied by W. K. Moon. Data were collected consecutively and all cases were used for anal-ysis without selection. The subimage of an ROI was manually selected using the ProImage package by a breast surgeon who was familiar with breast US inter-pretations and unfamiliar with the tissue diagnosis and cell type before ROI selections. The ROI was made by extending beyond the lesion margins by 1 to 2 mm in all directions (shown in Fig. 1); it was then saved as a file for later analysis. Figure 1 illustrates a digital image of
Fig. 1. A 640 ⫻ 480 digital image captured from the US scanner. In a 1-cm⫻ 1-cm rectangle, there are 94 ⫻ 94 ⫽ 8836 pixels. The ROI rectangle is 1.65 cm⫻ 0.96 cm and 155 ⫻ 90
an ultrasonic monochrome malignant tumor of 155⫻ 90 pixels in a rectangle 1.65 cm ⫻ 0.96 cm. ROI images were used in our breast image database to further inves-tigate the texture characteristics of benign and malignant tumors.
Image analysis
Currently, the co-occurrence matrices of the image have been used as features for representing the texture information. A co-occurrence matrix P,d(i, j) is a matrix
in which the (i, j)th element represents the frequency of occurrence of two pixels, with grey levels i and j, which are separated by distance d in the direction. The texture variations in a region can be captured by the co-occur-rence matrix with a different direction and distance d. In general, several co-occurrence matrices with dif-ferent and d are required to catch the texture informa-tion. The size of the matrix depends on the number of grey levels in an image; therefore, it would be prohibi-tively expensive to evaluate a matrix for each pixel in a general 8-bit image (i.e., 256⫻ 256 elements in a co-occurrence matrix. Hence, the statistical parameter ma-trices (contrast, covariance, dissimilarity) (Layer et al. 1991) with the same texture reservation properties de-fined in the next section were used in this study instead of the co-occurrence matrix.
We used the statistical method including contrast, covariance and dissimilarity that can directly evaluate the texture parameters for pixels with several distances. Its main advantage is that the evaluation cost depends only on the image size and not on the number of grey levels. Moreover, the statistical method can also extract visually perceptible physical parameters, such as con-trast, granularity, regularity, periodicity, finesse or coarseness of the texture. Let S denote a region of an image, g (i, j) denote the intensity value at the position (i,
j) of S, ␦ ⫽ (⌬i, ⌬j) denote the distance between two
pixels, and denote the grey level average of the region S. For a value of␦, the contrast, covariance and dissim-ilarity parameters are calculated as follows.
Contrast:
Con共␦兲 ⫽ E兵 g共i, j兲 䡠 g共i ⫹ ⌬i, j ⫹ ⌬j兲其 (1) Covariance:
Cov共␦兲 ⫽ E兵关 g共i, j兲 ⫺ 兴 䡠 关 g共i ⫹ ⌬i, j ⫹ ⌬j兲 ⫺ 兴其 (2) Dissimilarity:
Diss共␦兲 ⫽ E兵 g共i, j兲 ⫺ g共i ⫹ ⌬i, j ⫹ ⌬j兲其 (3)
In this study, texture correlation between neighboring pixels within the US images was used to classify the tumors. Table 1 shows the performance of three texture parameters. We found that the covariance parameter performed better than the other two texture parameters. Thus, the covariance parameter was adopted as our texture feature.
Note that several covariance parameters with differ-ent⌬i and ⌬j are needed to represent the texture infor-mation. These several covariance parameters can be rep-resented in a⌬m ⫻ ⌬n matrix form to record the prop-erties between pixel (x, y) and pixel (x⫹ ⌬iˆ, y ⫹ ⌬jˆ), where⌬iˆ ⫽ 1, . . . , ⌬m and ⌬jˆ ⫽ 1, . . . , ⌬n.
Bootstrap technique
In many signal-processing applications, one is in-terested in forming estimates of a certain number of unknown parameters of a random process, using a set of sample values. Further, one is interested in finding the sampling distribution of the estimators so that the respec-tive means, variances and cumulants can be evaluated, or in making some kind of probability statements with respect to the unknown true values of the parameters.
A bootstrap sample is obtained by sampling with replacement from the empirical distribution function for the training set. Each sample is independently drawn from the n training vectors with each vector having a probability 1/n of benign drawn on any trail. With the bootstrap method, the observations are randomly reas-signed and recomputed. The assignments and recompu-tations are treated as repeated experiments.
Bootstrapping is similar to other resampling schemes, such as cross-validation and jackknifing. There could be many possible ways to generate bootstrap sam-ples. We now consider the bootstrap techniques of gen-erating a bootstrap set used in this study.
Let XN⫽ {x1, x2, . . . , xN} be an original training
set. We now consider the bootstrap technique of gener-ating a bootstrap set XN⫽ {x1b, x2b, . . . , sNb} of size N. The
bootstrap steps are as follows:
1. Select a sample xk0from XNrandomly.
2. Find the r nearest neighbor samples xk1, xk2. . . , xkrof
xk0, using the Euclidean distance. If the Euclidean
distance between xk0and the selected sample is larger
than a threshold, the sample is not used for evaluating the bootstrap sample.
Table 1. The performance for different texture parameters, contrast, covariance and dissimilarity
Item Contrast Covariance Dissimilarity
3. Compute the bootstrap sample: x1 b ⫽r⫹ 11
冘
j⫽0 r xkj. (4)4. Repeat steps 1, 2 and 3 N times.
In this bootstrap technique, bootstrap samples are generated by locally combining original training sam-ples.
Data mining with decision-tree model
Recently, data mining has become widely recog-nized as a critical field and a popular technology for many applications in research. It attempts to nontrivially extract implicit, previously unknown, and potentially valuable information from vast amounts of data with low value in their raw form. Data mining can extract the useful hidden information from the voluminous detailed data for many areas, such as decision support, prediction, forecasting and estimation. In fact, data mining consists of several different technical approaches, such as clus-tering, data summarization, learning classification rules, finding dependency networks, analyzing changes and detecting anomalies, and so on (Shankar et al. 1993; Chen et al. 1996; Mullich et al. 1997; Anand et al. 1997; Cios et al. 1998).
The greatest chance of success in data mining comes from combining the expert’s knowledge with the advanced analysis techniques that can be implemented by the computer to identify the underlying relationships and valuable features in the data. Data mining can gen-erate models from historical data, and these models can be used for later prediction. It is possible to develop accurate prediction applications using a suitable learning method. The techniques for building these models are often referred to as machine learning or modeling. There are many machine learning and modeling technologies, such as rule induction, neural networks, association rule discovery, clustering, and so on (Weiss and Kapouleas 1989).
Decision-tree models are usually used in data min-ing to examine the data and induce the tree and its rules that will be used to make predictions. Decision trees are a way of representing a series of rules that lead to a class or value. In the decision tree is contained the decision node, branches and leaves. Depending on the algorithm, each node may have two or more branches. Each branch will lead either to another decision node or to the bottom of the tree, called a leaf node. Decision trees are grown through an iterative splitting of data into discrete groups to maximize the distance between groups at each split. Decision trees used to predict categorical variables are called classification trees because they place instances
into categories or classes. Decision trees make few passes through the data, no more than one pass for each level of the tree, and they work well with many predictor variables. As a consequence, models can be built very quickly, making decision trees suitable for large sets. Decision trees are most commonly used for classification to predict what group a case belongs to. Consequently, the decision tree has become a very popular data-mining technique in many current applications. In this study, the decision-tree model is used for mining the information we need for diagnosis.
A number of specific algorithms for the decision-tree model such as chi-squared automatic interaction detection (CHAID), classification and regression trees (CART), C4.5 (Quinlan 1992) and C5.0, an improved commercial version of C4.5 (RuleQuest Research Pty Ltd, NSW, St. Ives, Australia) are proposed. The algo-rithm C4.5, which is originally proposed by J. Quinlan, is one of the most popular inductive learning algorithms, and constructs the classification rules as a decision tree by some features. The speed and quality of rule genera-tion of the C5.0 algorithm are improved over its prede-cessor C4.5. In this study, the C5.0 algorithm and the covariance texture parameter are adopted to construct the decision-tree model and for further diagnosis.
RESULTS
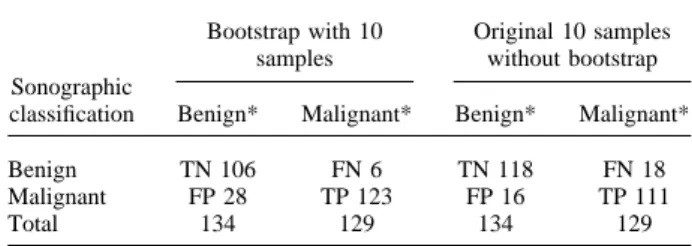
Accuracy, sensitivity, specificity, positive predictive value and negative predictive value are the five most generally used objective indices to estimate the perfor-mance of diagnosis results. In our experiment, accuracy of using the bootstrap technique for classifying malig-nancies with 10 original samples was 87.07%, the sen-sitivity was 95.35%, the specificity was 79.10%, the positive predictive value was 81.46% and negative pre-dictive value was 94.64% for the proposed CADx sys-tem. Table 2 lists the classification results of breast nodules by the proposed bootstrap scheme with 10 orig-inal samples and without bootstrap. A summary of the
Table 2. Classification of breast nodules by proposed bootstrap method with 10 original samples and without
bootstrap Sonographic classification Bootstrap with 10 samples Original 10 samples without bootstrap Benign* Malignant* Benign* Malignant*
Benign TN 106 FN 6 TN 118 FN 18
Malignant FP 28 TP 123 FP 16 TP 111
Total 134 129 134 129
TP⫽ True-positive; TN ⫽ True-negative; FP ⫽ False-positive; FN
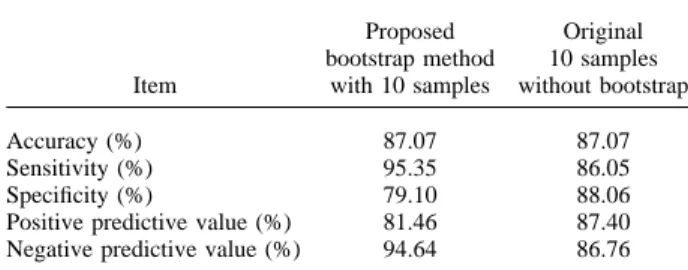
proposed diagnostic system, including the accuracy, sen-sitivity, specificity, positive predictive value and the neg-ative predictive value is given in Table 3. Table 4 shows a summary of performance for the proposed bootstrap method with different numbers of original samples and without the bootstrap.
DISCUSSION
Studies have indicated that approximately half of undetected cancers are missed due to observational over-sights by radiologists (Bird et al. 1992; Harvey et al. 1993; Schmidt et al. 1994). Although longer viewing times or double readings may improve radiologists’ per-formances, these tactics are time-consuming. The intro-duction of computer-aided detection for mammography enhances performance and improves confidence by drawing the radiologist’s attention to suspicious micro-calcifications and tumors in film screening (Freer and Ulissey 2001; Jiang et al. 2001) (e.g., Image Checker M1000; R2 Technology, Los Altos, CA) It also increases consistency as it reduces variability due to workload, fatigue or distraction.
The role of computer-aided diagnosis (CAD) for sonography was not the same as for mammography; it was used to provide the second opinion for the interpre-tation of a sonographically existing tumor and also im-prove diagnostic confidence. “Mammography gets all the
publicity, whereas breast ultrasound does its job quietly behind the scenes. If you are still using ultrasonography only for the distinction between ‘cystic’ and ‘solid’ le-sions of breast, you are missing the boat,” said Raymond (2000). In daily clinical practice, the current real-time US is more convenient than mammography in the eval-uation of a breast mass. Owing to the heterogeneous nature of a breast cancer, there is considerable overlap in the sonographic characteristics between malignant and benign lesions. This is the main reason for the contro-versy in its utility of classifying breast tumors.
CAD can be based on medically applicable research in the areas of artificial intelligence, physiologically mo-tivated image processing, genetic algorithms, pattern rec-ognition and neural networks. CAD is usually created by an extensive database of normal and biopsy-proven can-cer cases and utilizes breakthrough technology in the areas of ROI and distributed artificial intelligence. Based on this study, diagnostic performance of the proposed diagnostic system with a bootstrap technique can achieve the results of larger database.
However, using a small sample set, for example n⫽ 10 in this study, had its limitations. The training samples need to include variable cases of benign and malignant tumors to generate a good training set for classification. Despite that, it is of great use in the future applications of CAD, especially when a large database was not obtained for training. It is more cost-effective than traditional steps for constructing diagnosis models when a new ultrasonic system is used to collect the sample images at the beginning for the CAD because of fewer training cases needed. In addition, from the results of this study, we found that the diagnostic performance was improved by using the bootstrap technique in Table 3, although it is not so impressive. However, when the sample number was increased from 10 to 50 in Table 4, the diagnostic accuracy was much improved with the bootstrap tech-nique (87.07% to 95.81%) than without it (87.07% to 88.97%).
Many researchers (Garra et al. 1993; Goldberg et al. 1992; McPherson et al. 1986; Petrick et al. 1996; Valckx and Thijssen 1997; Vittitoe et al. 1997) over the last 20 years had demonstrated that image texture analysis plays an important role in computer-aided diagnosis systems. It would seem advisable to use statistical measurements to characterize those texture signals that are insufficiently described by most other approaches. Hence, this study was based on the texture features. Of course, this boot-strap method can also be applied to other features that can distinguish the tumors.
Even with all the progress in the past decade, CAD is still a long way from fulfilling our vision. CAD anal-ysis has faced skepticism and numerous criticisms in the past. Its practical utility is controversial. Regardless,
Table 3. Summary of performance for proposed bootstrap method with 10 original samples
Item Proposed bootstrap method with 10 samples Original 10 samples without bootstrap Accuracy (%) 87.07 87.07 Sensitivity (%) 95.35 86.05 Specificity (%) 79.10 88.06
Positive predictive value (%) 81.46 87.40 Negative predictive value (%) 94.64 86.76
Accuracy⫽ (TP ⫹ TN)/(TP ⫹ TN ⫹ FP ⫹ FN); Sensitivity ⫽ TP/(TP⫹ FN); Specificity ⫽ TN/(TN ⫹ FP); Positive predictive value
⫽ TP/(TP ⫹ FP); Negative predictive value ⫽ TN/(TN ⫹ FN).
Table 4. Summary of performance for proposed bootstrap method with different number of original samples
Original number of samples Accuracy (%) with bootstrap Accuracy (%) without bootstrap 10 87.07 87.07 20 89.73 87.07 30 91.25 87.45 40 94.30 87.83 50 95.81 88.97
CAD is undergoing great development and utilization within the field of medical imaging by showing its po-tential in many clinical areas (Tourassi 1999).
Acknowledgments—This work was supported by the National Science Council, Taiwan, Republic of China (grant NSC-90-2314-B-039-012).
REFERENCES
Anand SS, Scotney BW, Tan MG, Mcclean SI, Bell DA, Hughes JG, Magill IC. Designing a kernel for data mining. IEEE Expert [see also IEEE Intelligent Systems] 1997;12:65–74.
Arger PH, Sehgal CM, Conant EF, Zuckerman J, Rowling SE, Patton JA and Study P. Interreader variability and predictive value of US descriptions of solid breast masses: pilot study. Acad Radiol 2001; 8:335.
Bassett LW, Jackson VP, Jahan R, et al, eds. Diagnosis of disease of breast. Philadelphia, PA: Saunders, 1997.
Bird R, Wallace T, Yankaskas B. Analysis of cancers missed at screening mammography. Radiology 1992;184:613–617. Chen MS, Han JW, Yu PS. Data mining: an overview from a database
perspective. IEEE Trans Knowledge and Data Engineering 1996; 8:866–883.
Chen DR, Chang RF, Huang YL. Computer-aided diagnosis applied to US of solid breast nodules by using neural networks. Radiology 1999;213:407–412.
Chen DR, Chang RF, Huang YL. Breast cancer diagnosis using self-organizing map for sonography. Ultrasound Med Biol 2000a;3: 405–411.
Chen DR, Chang RF, Huang YL, et al. Texture analysis of breast tumors on sonograms. Semin Ultrasound CT MR 2000b;4(21):308– 316.
Ciatto S, Cataliotti L, Distante V. Nonpalpable lesions detected with mammography: Review of 512 consecutive cases. Radiology 1987; 165:99–102.
Cios KJ, Pedrycz W, Swiniarsk RM. Data mining methods for knowl-edge discovery. IEEE Trans Neural Networks 1998;9:1533–1534. Efron B. Bootstrap methods. Another look at the jackknife. Ann
Sta-tistics 1979a;7:1–26.
Efron B. Computers and the theory of statistics: Thinking the unthink-able. SIAM Rev 1979b;4:460–480.
Efron B. Nonparametric standard errors and confidence intervals (with discussion). Can J Statist 1981;9:1–26.
Efron B. The jackknife, the bootstrap and other resampling plans. CBMS Monograph 38. Philadelphia, PA: Society for Industrial and Applied Mathematics, 1982.
Efron B, Tibshirani B. An introduction to bootstrap. New York: Chap-man and Hall, 1993.
Freer TW, Ulissey MJ. Screening mammography with computer-aided detection: Prospective study of 12,860 patients in a community breast center. Radiology 2001;220:781–786.
Garra BS, Krasner BH, Horii SC, Ascher S, Mun SK, Zeman RK. Improving the distinction between benign and malignant breast lesions: The value of sonographic texture analysis. Ultrason Imag-ing 1993;15:267–285.
Giger ML, Hallaq HA, Huo Z, Moran C, Wolverton DE, Chan CW, Zhong WM. Computerized analysis of lesions in US images of the breast. Acad Radiol 1999;6:665–674.
Goldberg V, Maduca A, Ewert DL, Gisvold JJ, Gerrnleaf JF. Improve-ment specificity of ultrsonography for diagnosis of breast tumors by means of artificial intellengence. Med Phys 1992;19:1475–1481. Hall FM, Storella JM, Silverstone DZ, Wyshak G. Nonpalpable breast
lesions: Recommendations for biopsy based on suspicion of carci-noma at mammography. Radiology 1988;167:353–358.
Harvey J, Fajardo L, Innis C. Previous mammograms in patients with impalpable breast carcinoma: Retrospective vs blinded interpreta-tion. Am J Radiol 1993;161:1167–1172.
Jackson VP, Reynolds HE, Hawes DR. Sonography of the breast. Semin Ultrasound CT MR 1996;17:460–475.
Jiang Y, Nishikawa RM, Schmidt RA, et al. Potential of computer-aided diagnosis to reduce variability in radiologists’ interpretations of mammograms depicting microcalcifications. Radiology 2001; 220:787–794.
Layer G, Zuna I, Lorenz A, Zerban H, Haberkorn U, Bannasch P, Van Kaick G, Rath U. Computerized ultrasound B-scan texture analysis of experimental diffuse parenchymal liver disease: Correlation with histopathology and tissue composition. J Clin Ultrasound 1991;19: 193–201.
McPherson DD, Aylward PE, Knosp BM, Bean JA, Kerber RE, Collins SM, Skorton DJ. Ultrasound characterization of acute myocardial ischemia by quantitative texture analysis. Ultrason Imaging 1986; 8:227–240.
Mullich J. Data mining: making data meaningful. Computer 1997;30: 18.
Petrick N, Chan HP, Wei D, Sahiner B, Helvie MA, Adler DD. Automated detection of breast masses on mammograms using adaptive contrast enhancement and texture classification. Med Phys 1996;23:1685–1696.
Quinlan JR. C4.5 programs for machine learning. San Mateo, CA: Morgan Kaufmann, 1992.
Raymond HW. Letter from the editor. Semin Ultrasound CT MR 2000;21(4):285.
Raza S, Baum JK. Solid breast lesions: Evaluation with power Doppler US. Radiology 1997;203:164–168.
Roux C, Coatrieux JL. Contemporary perspectives in three-dimen-sional biomedical imaging. Amsterdam, The Netherlands: IOS Press, 1997 141.
Schmidt R, Nishikawa R, Schreibman K, et al. Computer detection of lesions missed by mammography. In: Gale AG, et al, eds. Digital mammography. Amsterdam: Elsevier Science B.V., 1994. Shankar PM, Reid JM, Ortega H, Piccoli CW, Goldberg BB. Use of
non-Rayleigh statistics for identification of tumors in ultrasonic B-scans of the breast. IEEE Trans Med Imag 1993;12:687–692. Stavros AT, Thickman D, Rapp CL, et al. Solid breast nodules: Use of
sonography to distinguish between benign and malignant lesions. Radiology 1995;196:123–134.
Tourassi GD. Journey toward computer-aided diagnosis: Role of image texture analysis. Radiology 1999;213:317–320.
Valckx FMJ, Thijssen JM. Characterization of echographic image texture by co-occurrence matrix parameters. Ultrasound Med Biol 1997;23:559–571.
Vittitoe NF, Baker JA, Floyd CE, Jr. Fractal texture analysis in com-puter-aided diagnosis of solitary pulmonary nodules. Acad Radiol 1997;4:96–101.
Weiss SM, Kapouleas I. An empirical comparison of pattern recogni-tion neural nets and machine learning classificarecogni-tion methods. In: Sridhavan NS, ed. Proceedings of the 11th International Joint Conference on Artificial Intelligence. Detroit: Morgan Kaufman 1989;234 –237.