Propyl Ester Phosphazene
BAR-LONG DENQ,1,* WEN-YEN CHIU,1
KING-FU LIN,1
MING-REN STEVE FUH2 1
Institute of Material Science and Engineering, National Taiwan University, Taipei, Republic of China 2
Department of Chemical, Soochow University, Taipei, Republic of China
Received 23 June 2000; accepted 3 December 2000
ABSTRACT: The study was focused on the thermal degradation behavior of epoxy resins (EP) blended with propyl ester phosphazene (FR). The analysis studied the evolved gas and the residual char yield using different techniques. The results showed that pure epoxy resin and their blends were all a one-stage thermal degradation reaction. The major degradation temperature of blends was lower than the temperature of pure epoxy resin, but the residual char yield of epoxy blends at 550°C was higher than that of pure epoxy resin. FR could accelerate the production of small molecules such as acetone, phenol, and isopropyl phenol during thermal degradation process. Honeycomb struc-ture compounds were also formed in the residual char of epoxy and its blends. Addi-tionally, elemental analysis of the residual char yield showed that phosphorus was a residual element, and other elements mostly diffused to the evolved gas.© 2001 John Wiley & Sons, Inc. J Appl Polym Sci 81: 1161–1174, 2001
Key words: blends; epoxy resin; propyl ester phosphazene; pyrolysis mechanism; thermal degradation
INTRODUCTION
Due to the excellent mechanical properties and adhesion, epoxy resins are widely used in aero-space and other fields. Although they have excel-lent chemical and mechanical properties, they are not stable at high temperatures. Many studies about thermal degradation of epoxy resin had been reported. For example, Grassie et al.1 had
used the subambient thermal volatilization anal-ysis procedure (SATVA) to examine the products
evolved during the thermal degradation of epoxy resin, and proposed the thermal degradation mechanism from the viewpoint of the bond en-ergy. They suggested that because oxygen and nitrogen atoms have greater negative inductive effect than other atoms, the scission of epoxy resin would take place at OOCH2 and CON bonds to form phenol, amine, and other small related molecules. Bellenger et al.2 had studied the thermal degradation behavior of diglycidyl ether bisphenol A (DGEBA) and tetraglycidyl methylene dianiline (TGMDA) epoxy prepolymer cured with different amines such as diethylene triamine (DETA), iso-phorone diamine (IPD), dia-mino diphenyl sulphone (DDS), and diadia-mino di-phenyl ether (DDE) under the oxidative and non-oxidative conditions. The thermal degradation mechanism was influenced by the curing agents, amine concentration, and the nitrogen atom
nu-Correspondence to: B. L. Denq ([email protected]).
* Present address: Industrial Technology Research Insti-tute, Material Research Laboratory, Chutung, Hsinchu, Tai-wan 310, R.O.C.
Contract grant sponsor: Chung Shan Institute of Science and Technology.
Journal of Applied Polymer Science, Vol. 81, 1161–1174 (2001) © 2001 John Wiley & Sons, Inc.
cleophilicity. Recently, many literatures3–5 have
reported that phosphorus-containing compounds can be used as additives to improve the thermal stability of many polymers besides epoxy resins. For example, Denq et al.5 reported propyl ester
phosphazene, used as a flame retardant with high phosphorous and nitrogen content, would react with PMMA to form an anhydride structure that could increase the major thermal degradation temperature. Other reports6,7have point out that
phosphorus-containing compounds would form phosphorus-like acid structure during the ther-mal degradation. The function of phosphorus-like acid was stated as follows:
1. Cyclic structures6were formed by
dehydra-tion, and by further degradation they could break into a variety of small molecules. 2. Free radicals6,7in the gas phase were
cap-tured by the phosphorus-like acid. Both the volatile and combustible gases on the sur-face were insulated by the formed carbona-ceous char to stop the further thermal deg-radation.
3. Epoxy resins7 blended with
organophos-phonic compounds containing phosphorus, chloride, or nitrogen would produce nonvol-atile residuals during the thermal degra-dation. These nonvolatile residuals could form thermostable structures with aro-matic COCl and PAN bonds.
In our previous study,8the curing kinetics and
physical properties of epoxy resins (DGEBA/ DETA) were deeply influenced by the FR content. The detailed studies on the thermal degradation of epoxy resins blended with FR have been not yet reported, and therefore, we investigated it using different analytical techniques in this study.
EXPERIMENTAL
Materials
The epoxy prepolymer used in this study was diglycidyl ether bisphenol A (DGEBA) (DER 331, from Dow Chemical Company) with a molecular mass of 380 g/mol (epoxide equivalent weight9of
190 g/Eq). A stoichiometeric amount of diethyl-enetriamine (DETA, from Janssen Chimica Com-pany) with a molecular mass of 103.15 g/mol (amine equivalent weight of 20.63 g/Eq) was used as a curing agent. Propyl ester phosphazene (FR) was supplied by Chung Shan Institute of Science and Technology. The chemical structure of these materials are shown below:
The formulations of epoxy blended with vari-ous amount of FR were shown in Table I and were referred as Ep0f, Ep1f, and Ep2f, respectively. The cure cycle of samples was: precure tempera-ture of 75°C for 2 h and postcure temperatempera-ture of 95°C for 1 h under atmosphere.
Table I Composition and Phosphorus Content of Blended Samples Code Weight Ratio (DGEBA/DETA/FR) P (wt %)a P (wt %)b Ep0f 89.37 : 10.63 : 0 0.00 ⬍0.01 Ep1f 82.04 : 9.75 : 8.21 1.91 1.86 Ep2f 75.82 : 9.02 : 15.16 3.50 3.47 FR 0 : 0 : 100 21.0 21.0
aPhosphorus content from composition calculation. bPhosphorus content by the colorimeter.10
Figure 1 The scheme of apparatus used to degrade and collect volatile products.
METHODS
Thermal Degradation
The thermal degradation was examined by a Per-kin-Elmer TGA-7 thermogravimetric analysis (TGA) at the heating rate of 10°C/min under a nitrogen atmosphere with a flow rate of 40 mL/ min.
Analysis of Evolved Gas Method 1: TGA/FTIR
The gas products of degraded epoxy blends were investigated using a SEIKO SSC 5000
thermo-gravimetric analysis coupled with a BIO-RAD FTS-40 Fourier transform infrared spectrometer (TGA-FTIR). Samples were heated at a heating rate of 10°C/min under a nitrogen atmosphere with a flow rate of 40 mL/min. The FTIR spectra were identified by visual analysis and by search-ing the spectral data bases.
Method 2: Pyrolysis/GC/MS
The gas products during the degradation of epoxy blends, about 600 g, at various temperatures were investigated using a pyrolyzer (Gas pyro-probe CDS-2000) coupled with a gas chromatog-raphy (Hewlett-Packard 5890 series II) equipped with a thermal conductivity detector (TCD), and a capillary column (Hewlett-Packard HP-5, 30 m long⫻ 0.25 mm i.d. coated with the crosslinking packing of 5% diphenyl and 95% diphenyl polysi-loxane). The heating rate was set to 200°C/ms in these experiments. The GC conditions were de-signed to separate the pyrolysis products based on their boiling points and was operated under the following operating parameters: the column
Table II Characteristics of Thermal Degradation of Various Blends at Heating Rate of 10°C/min
Blends T5%/°C
% Residual at 550°C
Temperature Range/°C
Stage 1 Stage 2 Stage 3
FR 224.98 37.47 140–268 271–340 340–550
Ep0f 351 14.6 — 317–550a —
Ep1f 302 23.9 — 250–550a —
Ep2f 291 24.3 — 231–550a —
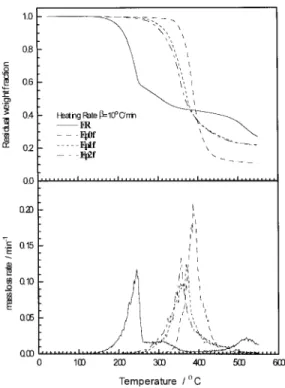
aThe major degradation temperature of epoxy or its blends is located in the second stage degradation of FR. Figure 2 TG-DTG thermograms of FR and epoxy
blends at a heating rate of 10°C/min under nitrogen atmosphere.
Figure 3 The gas discharge with time (temperature) during thermal degradation for (a) Ep0f and (b) Ep2f at a heating rate of 10°C/min.
injection temperature was set to 220°C; the col-umn operated isothermally at 40°C for 2 min and then heated to 220°C at the heating rate of 10°C/ min; the carrier gas was helium with a flow rate of 50 mL/min. The spectra of the evolved gases were identified using a mass detector (Hewlett-Pack-ard 5971) with the scanning range of m/e from 30 to 400 operated at 70 eV, and compared with the spectral databases and literature.1,11,12
Method 3: Separation/GC/MS
Thermal degradation of epoxy resins was carried out in the apparatus shown in Figure 1. The pow-dered sample, of about 8 g mass, was put in the
T-shape tube and heated to certain temperature with the heating rate of 10°C/min under vacuum. The gases, evolved during degradation, were di-vided into three types: (i) products with boiling point lower than liquid nitrogen temperature, which remained in the gas state under liquid
Figure 4 FTIR spectra of gas phase evolved at vari-ous thermal degradation time for (a) Ep0f and (b) Ep2f.
Figure 5 Various pyrolysis GC profiles at different temperature for (a) Ep0f and (b) Ep2f.
Table III Volatile Products of Thermal Degradation of Epoxy Resin and Its Blends Identified by Mass Spectra and Literature1,11,12
Evolved Time (min) m/e Value Compound Identified Methodb 5.391 79 unidentified — 6.887 93 pyridine L 7.025 105 unidentified —
8.851 108 (o, m, p)-cresol or methoxy benzene L
9 152 P
10.115 108 (o, m, p)-cresol or methoxy benzene L
10.125 108 (o, m, p)-cresol or methoxy benzene L
10.184 94 Phenol L
10.632 119 P
10.646 122 (o, m, p)-ethyl phenol or ethoxy benzene or dimethyl phenola L 11.536 122 (o, m, p)-ethyl phenol or ethoxy benzene or dimethyl phenola L
11.876 108 (o, m, p)-cresol or methoxy benzene L
12.058 136 (o, m, p)-isopropyl phenol L
12.727 132 P
13.015 136 (o, m, p)-isopropyl phenol L
13.054 146 P
14.553 136 (o, m, p)-isopropyl phenol L
15.745 134 L
16.922 183 unidentified —
23.178 196 L
nitrogen quench; (ii) products with boiling point between liquid nitrogen temperature and room temperature, which was the gas state at room temperature and the liquid state under liquid nitrogen quench; and (iii) products with boiling point higher than room temperature, which was the liquid state at room temperature and under liquid nitrogen quench.
The products type (i) and (ii) were analyzed using a gas chromatograph (GC) (Shimadzu GC-14A) equipped with a flame ionization detector (FID) and a packing column (Shimadzu, 15 m long coated with Al2O3/KCl), under the following operating parameters: the column injection tem-perature was 200°C; the column operated isother-mally at 30°C for 10 min and then heated to 180°C at the heating rate of 7.5°C/min; the carrier gas was nitrogen with a flow pressure of 2 kg/cm2.
The spectra of product type (i) and (ii) were com-pared with ref. 13.
The products type (iii) were used the similar pyrolysis/GC/MS equipment and the condition to separate and to identify them, but the equipment was without a pyrolyzer.
Analysis of Residual Char Yield
The residual char yields after TGA analysis were pressed into pellets with potassium bromide and studied using Fourier transform infrared spec-trometer. Additionally, elemental analysis of the residual char yield was also done using elemental analyzer (F002 Heraeus CHN-O Rapid Elemental Analyzer) to determine carbon, hydrogen, oxygen, and nitrogen content.
RESULTS AND DISCUSSION
Thermal Degradation of Epoxy Blends
In Figure 2 thermogravimetric (TG) curves (resid-ual weight fraction vs. temperature) and the cor-responding thermogravimetric DTG curves (mass loss rate vs. temperature) for FR and epoxy blends were shown. In Table II some characteris-tics of these curves were listed. In our previous study,3 the thermal degradation of FR could be
divided into three stages. The evolved gas in the first and second stage was predominantly pro-Table III Continued
Evolved Time (min) m/e Value Compound Identified Methodb 26.056 237 P 26.727 212 P 26.858 228 L 27.527 252 P 27.932 270 P
aRepresent the existence of various substituted position of benzene ring. bL: library searching; P: proposed by literature.
pylene. In addition, the FTIR spectra of the con-densed phase at various temperature [Fig. 4(a)] indicate an isomerization reaction that occurred during the thermal degradation forming a more thermally stable structure, in which the PAN bond changed into a PON bond.14,15
The thermal degradation behavior of epoxy and its blends are one stage reaction. The tempera-ture at which 5% mass is lost (T5%) and the peak temperature (Td,max) at maximal degradation rate on DTG curve are lower for epoxy blends than for pure epoxy (Table II). By increasing FR Figure 6 The GC profile of evolved-gases of product type (i) at different degradation
content the residual char yield of epoxy blends at 550°C increases also, but simultaneously the tem-perature (Td,max) and maximal degradation rate of blends decrease.
Analysis of Evolved Gas Analysis by TGA/FTIR
TGA/FTIR was used to characterize the pyrolysis gas of epoxy and its blends as shown in Figures 3 and 4. As shown in Figure 4(a), the FTIR spectro-grams of the gas products of Ep0f at different deg-radation times (or temperatures) were similar. The major gas product at 38.0 min [Fig. 3(a)] is bisphe-nol A. The TGA/FTIR results of Ep2f are shown in Figures 3(b) and 4(b). The major gases evolved at 34.9 min were phenol and bisphenol A, identified by the assistance of the spectral databases. Addition-ally, the different characteristics of the FTIR peaks at various times (or temperatures) between Ep0f and Ep2f were as follows: (1) the intensities of the CH3 and CH2 bond at 2940, 2900, and 2850 cm⫺1
were scattered by adding of FR, and (2) the inten-sities of the benzene bond at 1600 and 1500 cm⫺1 and the ether bond at 1250 and 1180 cm⫺1of Ep2f increased with the evolved time.
These results revealed that the addition of phosphorus compounds during the thermal deg-radation process would easily lead the scission of the COC bond of bisphenol A.
Analysis by Pyrolysis/GC/MS
The pyrolysis temperatures of epoxy and its blend were determined on the basis of the initial tem-peratures and inflection points from TG curves. Therefore, the chosen pyrolysis temperatures of Ep0f were 300, 375, 400, 475, and 800°C, and for Ep2f were 250, 300, 340, 375, 400, 475, and 800°C. Figure 5(a) and (b) shows the pyrograms of Ep0f and Ep2f at different temperatures. Table III lists the volatile product species produced dur-ing the pyrolysis of the investigated samples and identified by their mass spectra and litera-ture.1,11,12
Figure 5(a) reveals that the peaks of Ep0f py-rograms were scattered within a pyrolysis tem-perature range of 300 – 400°C and the abundance of the peaks were obvious at above 400°C. While the major peaks at 10 –16 min were assigned to higher phenol compounds such as (o, m, p)-cresols, (o, m, p)-isopropyl phenols, and (o, m,
p)-ethyl phenols, the peaks from 23 to 28 min
were assigned to bisphenol A structure com-pounds. The bisphenol A structure appeared only at high temperature because bisphenol A, with a boiling point of 360.5°C (1.033 kg/cm2),22was
ac-cumulated in the link section between pyrolyzer and GC, and could not be carried out until the higher pyrolysis temperature was reached.
Ep2f pyrograms shown in Figure 5(b) can be divided into two groups: the one with pyrolysis temperature below 400°C and the major peak at 16.9 –17 min, and the other one with the temper-ature above 400°C and the major peak at 10 –11 min. While the peaks at 10 –11 min were assigned to (o, m, p)-ethyl phenol compounds, the com-pound with the peak at 16.9 –17 min and m/e of 183 was unidentified. The peak of bisphenol A appeared at high temperature also, but much smaller than that of Ep0f. The major differences of pyrograms between Ep0f and Ep2f were listed as follow: (1) both the scission behavior of the Ep0f and Ep2f systems would be accelerated with the increasing of pyrolysis temperature; (2) the thermal degradation temperature of the epoxy blends would be lower than that of pure epoxy. On the other hand, the addition of FR would acceler-ate the scission of epoxy resin; and (3) the amount of smaller molecules of the Ep2f system was greater than that of the Ep0f system. This phe-nomenon was due to FR with the electron with-drawing of the nitrogen atom that could attack and break the bisphenol A structure.
Analysis by Separation/GC/MS
This part will be focused on the analysis of the evolved gas, especially small molecules, using the separation/GC/MS during the thermal degrada-tion process. Figure 6 shows the pyrograms for product type (i) of FR at different temperatures, while the pyrograms for product type (i) of Ep0f and Ep2f were not observed in these experiments. The spectra of the product type (i) of FR were found to contain a large amount of propylene, and this result correspond to our previous study.3
Figure 7(a) to (c) showed a series of GC traces at different temperatures representing product type (ii) gases of FR, Ep0f, and Ep2f, respectively. The product type (ii) gases of Ep0f and Ep2f con-sisted of mainly C1–C4, saturated, and unsatur-ated aliphatic hydrogen carbon compounds, and benzene. They were identified by ref. 13 and agreed with Cascaval’s study.21Additionally, the
amount of the evolved products of FR, Ep0f, and Ep2f all increased with increasing temperature.
The major difference of the evolved gases product type (ii) between Ep0f and Ep2f was that the evolved product of pure epoxy at 9.3–9.4 and 13.3–14.5 min disappeared by addition of FR, and the new product of the blends at an evolved time of 8.9 –9.0 min was produced.
Both Figure 8 and Table IV represented a GC/MS traces of the evolved gas of product type (iii) for FR, Ep0f, and Ep2f when samples were heated to a peak temperature of the DTG curve at the heating rate of 10°C/min. The evolved prod-ucts of FR at various evolved times were identi-fied to be acetone, N-propanamine (or dipropyl ether), and tributyl ester phosphoric acid by the spectra data library. The major evolved type (iii) products of Ep0f and Ep2f included acetone,
1-propanol, 2-propanol, phenol, (o, m, p)-isopro-pyl phenol, and (o, m, p)-isoprop)-isopro-pylenyl 2,4-cyclo-hexidenone.
The major differences of evolved type (iii) be-tween Ep0f and Ep2f were stated as follow: (1) The formation of 1-propanol and 2-propanol was only observed during thermal degradation of ep-oxy by adding of FR. (2) All of the amount of acetone, phenol, and isopropyl phenol produced by Ep2f were greater than those of Ep0f.
The above phenomena was due to FR released propylene during the thermal degradation pro-cess, and its residual char contained an active proton to attack the 4,4-isopropyl phenol, ether group, and CON bond. Therefore, phenol, isopro-pyl phenol, and proisopro-pyl radicals were produced. Figure 7 The GC profile of evolved gases of product type (ii) at different degradation
The propyl radical reacts then with the residual char to form 1-propanol, 2-propanol, and acetone through many complex reactions.16Additionally, the sources of a large amount of acetone, phenol, and isopropyl phenol were also due to an active
proton from FR easily attacked bisphenol A struc-ture.
From the evolved substances in the experi-ments, our previous study,16and literature,1,11,12 the pyrolysis mechanism of pure epoxy resin and Figure 7 (Continued from the previous page)
its blends were proposed to be as follows: (a) py-rolysis mechanism of epoxy resin
(b) pyrolysis mechanism of epoxy resin blended with FR.
Analysis of Residual Char Yield
The FTIR spectra of the condensed phase of epoxy and its blends at various temperatures (with a
heating rate of 10°C/min under nitrogen atmo-sphere) were shown in Figure 9(a) and (b), respec-tively. The intensities of peaks at 1600 and 1500 cm⫺1, assigned to resulting from benzene ring of Ep0f, decrease with the increase of temperature, as shown in Figure 9(a). Additionally, two of three absorption peaks, one at 1250 cm⫺1 due to the ArOO group and the other at 1040 cm⫺1 due to the COO group, disappeared at 550°C. Finally, the peaks at 2940, 2900, and 2850 cm⫺1, resulting from methyl and methylene, disappear at 550°C. But it is worth noticing that the bands at 810 cm⫺1due to the out of plane COH bending of the
p-substituted aromatic ring disappeared at 550°C, and peaks 9 and 10 due to the out-of-plane COH vibration of honeycomb compounds20,21
de-veloped.
In the FTIR spectra of Ep2f [Fig. 9(b)] it is evident that all of the signals such as ArOO, COO, benzene ring, methyl, and methylene dis-appeared at 400°C, and the out-of-plane COH vibration of honeycomb structure became evident and broad. The band broadness may be the result of phosphorus compound bonds such as POOO(C) (830–740 cm⫺1), (P)OOOC (1050–970 cm⫺1), POOH (1040–910 cm⫺1), and PON (1100 –930 cm⫺1), respectively. From the analysis of evolved gas and the increase of the residual Figure 8 The GC profile of evolved gases of product type (iii) for (a) FR, (b) Ep0f, and (c) Ep2f.
char yield, it seem that the epoxy and its blends are split off and the honeycomb structure forms with the increase of temperature. Additionally, the scission of epoxy and the formation of honey-comb structure are easier when adding the FR than without it. The phosphorus atom remains in the residual char yield of Ep2f.
Elemental Analysis
To understand the proportion of residual content of various elements relative to the initial state (25°C), the ratio, R, was defined:
R⫽
共content at any temperature for element i兲 ⴱ 共1ⴱ␣T兲
共content at 25°C for element i兲 (1) where␣Tis the weight loss fraction of sample at temperature T.
Figure 10 showed the variation of this ratio for various elements relative to the weight loss frac-tion of Ep0f and Ep2f. It could be seen that the carbon, hydrogen, oxygen, and nitrogen atoms were being lost steadily throughout the heating process, but most of the amount of phosphorus atom remained in the residual char yield. This phenomena was also observed in Weil,18 and
Li’s19studies. FTIR analysis of the residual char
in this article also showed that phosphorus could function in the condensed-phase to form char.
The Interaction between Epoxy Resin and FR During Pyrolysis Process
The above evidences revealed that addition of FR would accelerate the scission of epoxy and form new honeycomb structure compounds. To exam-ine the degree of interaction between epoxy and FR during the thermal degradation of epoxy blends, a mixing rule that assumed no interaction effect, was employed:
Wblend⫽ WEp䡠 XEp⫹ WFR䡠 XFR (2)
where Wblend is the residual weight fraction of epoxy blend at temperature, T; WEPand WFRare the residual weight fractions of pure epoxy resin and of FR at temperature, T; XEpand XFRare the weight fractions of pure epoxy resin and of FR, respectively. Figure 11 shows the comparison of the experimental TG curves and the TG curves calculated according to the mixing rule. They did not match, because the mixing rule showed a two-stage reaction while the experimental results show a one-stage reaction. In addition, the exper-imental weight loss fractions are smaller than those calculated for the first stage from the mix-ing rule, while for the second stage that is oppo-site. The experimental residual char yield at 550°C is higher than the results calculated from mixing rule. Therefore, it can be concluded that the interaction between FR and epoxy does exist Table IV Species of Product Type (iii) of Thermal Degradation of Epoxy Resin and Its Blends
Identified by Mass Spectra
Sample Code
Evolved Time
(min) Assignation m/e
FR 1.910 Acetone 58
6.344 N-propyl-1-propanamine 101
or or
Dipropyl ether 102
18.08 Tributyl ether phosphoric acid 206
Ep0f 1.941 acetone 58
11.290 phenol 94
15.691 (o, m, p)-isopropyl phenol 136
16.917 (o, m, p)-isopropylene 2,4-cyclohexidenone 134
EP2F 1.917 acetone 58
2.443 1-propanol 60
or or
2-propanol 60
11.372 phenol 98
15.734 (o, m, p)-isopropyl phenol 136
during the thermal degradation process and cor-responds with the above experiments.
CONCLUSION
From this study, several conclusions could be made:
1. The thermal degradation of epoxy resin and its blends was a one-stage reaction. 2. FR reduced the major degradation
temper-Figure 9 FTIR spectra of condensed phase in ther-mal degradation at various temperatures for (a) Ep0f and (b) Ep2f.
Figure 10 Variation of ratio R(C, H, O, N, P) with weight loss fraction (␣T) for Ep0f and Ep2f.
Figure 11 Comparison of experimental TG thermo-gram and thermothermo-gram calculated according to the mix-ing rule for Ep1f and Ep2f.
ature of the blends relative to pure epoxy resin, and also accelerated the scission of epoxy resin. There were a large amount of liquid products such as acetone, phenol, and isopropyl phenol that evolved during thermal degradation. Additionally, FR ac-celerated the formation of carbonaceous char, and thus increased the residual char at 550°C.
3. The major evolved gas of epoxy resin and its blends formed during the early thermal degradation were bisphenol A and higher phenol compounds. The bisphenol A origi-nates from the scission of the COO bond of the ether group. By increasing the temper-ature, the bisphenol A could break into a variety of small molecules such as phenol and isopropyl phenol.
4. The evidences of elemental analysis and infrared spectra of the residual char showed that phosphorus was a residual el-ement, while the other elements mostly dif-fused to the evolved gas. Additionally, the scission of epoxy and the formation of hon-eycomb structure are easier by adding the FR than without it.
The authors thank the Chung Shan Institute of Science and Technology (CSIST), Taiwan, R.O.C. for their fi-nancial support.
REFERENCES
1. Grassie, N.; Guy, M. I.; Tennent, N. H. Polym De-grad Stabil 1986, 14, 125.
2. Bellenger, V.; Fontaine, E.; Fleshmann, A.; Saporito, J.; Verdu, J. Polym Degrad Stabil 1984, 9, 195. 3. Denq, B. L.; Hu, Y. S.; Chiu, W. Y.; Chen, L. W.
Polym Degrad Stabil 1997, 57, 269.
4. Denq, B. L.; Chiu, W. Y.; Chen, L. W.; Wu, T. R. Polym Degrad Stabil 1997, 57, 261.
5. Denq, B. L.; Chiu, W. Y.; Lin, K. F. J Appl Polym Sci 1997, 66, 1855.
6. Cullis, C. F. The Combustion of Organic Polymers; Oxford: Clarendon, 1981.
7. Petreus, O.; Popescu, F. N.; Cascaval, C. N. Angew Makromol Chem 1994, 222, 13.
8. Denq, B. L.; Hu, Y. S.; Chiu, W. Y.; Chen, L. W.; Chiu, Y. S. J Appl Polym Sci 1999, 74, 229. 9. Smith, I. T. Polymer 1961, 2, 95.
10. Tomson, M. B.; Barone, J. P.; Nancollars, G. H. Atomic Absorpt Newslett 1977, 16, 117.
11. Grassie, N.; Guy, M. I.; Tennent, N. H. Polym De-grad Stabil 1985, 12, 65.
12. Grassie, N.; Guy, M. I.; Tennent, N. H. Polym De-grad Stabil 1985, 13, 11.
13. Lin, C. T. Master Thesis, National Taiwan Univer-sity, 1992.
14. Papkov, V. S.; IL’Tma, M. N.; Tur, D. R.; Slonim-skii, G. L. Polym Sci USSR 1989, 31, 2509. 15. Maynard, S. J.; Sharp, T. R.; Haw, J. F.
Macromol-ecules 1991, 24, 2794.
16. Denq, B. L. Ph. D Thesis, National Taiwan Univer-sity, 1997.
17. Cascaval, C. N. Eur Polym J 1994, 30, 969. 18. Weil, E. D. Flame Retardancy of Polymeric
Mate-rials; Kuryla, W. C.; Papa, A. V., Eds.; Marcel Dek-ker, New York, 1976, p. 123.
19. Li, J. Z.; Chen, S. Y. J Appl Polym Sci 1990, 40, 417. 20. Socrates, G. Infrared Characteristic Group
Fre-quencies; New York: Wiley, 1980.
21. Factor, A.; Carnahan, J. C.; Dorn, S. B.; Van Dort, P. C. Polym Degrad Stabil 1994, 45, 127.
22. Jordan, T. E. Vapor Pressure of Organic Com-pounds; Interscience Publishers, New York, 1954.