Other uses, including reproduction and distribution, or selling or
licensing copies, or posting to personal, institutional or third party
websites are prohibited.
In most cases authors are permitted to post their version of the
article (e.g. in Word or Tex form) to their personal website or
institutional repository. Authors requiring further information
regarding Elsevier’s archiving and manuscript policies are
encouraged to visit:
Author's personal copy
Available online at www.sciencedirect.com
Journal of Chromatography A, 1182 (2008) 93–112
Evaluation of various derivatization approaches for gas
chromatography–mass spectrometry analysis of
buprenorphine and norbuprenorphine
Chih-Hung Wu, Shu-Ching Yang, Yu-Shan Wang, Bud-Gen Chen,
Ching-Chiang Lin
∗, Ray H. Liu
∗Department of Medical Technology, Fooyin University, 151 Ching-Hsueh Road, Ta-Liao Hsiang, Kaohsiung Hsien 831-02, Taiwan Received 7 October 2007; received in revised form 18 November 2007; accepted 22 November 2007
Abstract
Various chemical derivatization approaches have been adapted for the analysis of buprenorphine and its major metabolite (norbuprenorphine) by GC–MS based methodologies. These approaches included alkylation, acylation, and silylation resulting in the formation of methyl, acetyl, trifluoroacetyl, pentafluoropropionyl, heptafluorobutyryl, and trimethylsilyl derivatives. This study conducted a comprehensive evaluation on the merits of these approaches based on the following criteria: reaction yields and ionization efficiency of the derivatization products; chromatographic characteristics; and cross-contributions to the intensities of ions designating the analytes and the internal standards. Under acidic derivatization conditions, the analytes could form three artifact products. Overall, derivatization by acetyl anhydride resulted in best performance characteristics. © 2008 Published by Elsevier B.V.
Keywords:Buprenorphine; Alkylation; Acylation; Silylation; Derivatization; GC–MS
1. Introduction
Buprenorphine (BUP) is a thebaine-derived semi-synthetic drug. With analgesic properties, BUP stimulates the same brain receptors as opiate agonists, such as heroin and mor-phine, and blocks the effects of heroin by binding to the same opiate receptors [1]. Its main metabolite is desalky-BUP or norbuprenorphine (Ndesalky-BUP). Both compounds form glucuro-conjugates extensively in biological systems[2]. We are interested in BUP and its metabolites mainly because of its use as a substitution drug for “treating” heroin addicts. The analysis of these compounds are essential to pharmacodynamic and phar-macokinetic studies and compliance monitoring, while better understanding on the mass spectrometric and chromatographic characteristics of these compounds in various derivatization forms will be helpful to their analysis.
Various gas chromatography (GC)-based methods, involv-ing alkylation, acylation, and silylation, have been applied to
∗Corresponding authors. Tel.: +886 9 3636 3732; fax: +886 7 782 7162.
E-mail addresses:[email protected](C.-C. Lin), [email protected],[email protected](R.H. Liu).
the analysis of BUP and NBUP. For example, Everhart et al.
[3]adapted heptafluorobutyric anhydride as the derivatization reagent and reported the formation of olefin and cyclic artifacts as the reaction by-products. However, adapting GC-electron capture detector as the analytical tool, they could not present mass spectrometric data to support the identities of these prod-ucts. During the same time period, a GC–mass spectrometry (MS) based study [4] reported the formation of the cyclic, but not the olefin, compound while conducting methylation under strong acidic condition. An earlier study by Cone et al.
[5]focused on the acid-catalyzed rearrangement of BUP (and related compounds) under acidic conditions, but not under chem-ical derivatization settings.
Having completed a thorough literature review (Table 1) on various derivatization approaches, we have designed this study to better understand the characteristics of the derivati-zation products under various derivatiderivati-zation conditions. The scope of this study will include all derivatization approaches that have been reported in the literature for GC–MS analy-sis of BUP and NBUP, including the following derivatization reagents: iodomethane[4]for alkylation; acetyl anhydride[6], pentafluoropropionic anhydride (PFPA) [7–11], and
heptaflu-0021-9673/$ – see front matter © 2008 Published by Elsevier B.V. doi:10.1016/j.chroma.2007.11.063
Table 1
Chemical derivatization of BUP and NBUP for chromatographic analysis
Der. group Der. reagent Sample; internal standard; finding LOD/LOQ (ng/ml) Ref.
Methyl Iodomethane 2-ml urine; BUP-d4; formation of cyclic compound under
acidic conditions
BUP: 0.2/–; NBUP: 0.2/1.0 [4]
Acetyl Acetyl anhydride 3-ml urine; BUP-d4and NBUP-d3; 4-dimethylaminopyridine
as a catalyst for high derivatization yield
BUP: 0.5/1.5; NBUP: 2/6 [6]
PFP PFPA 1-ml plasma; BUP-d4; cleanliness and silanization of the glass
liner essential to maintaining high sensitivity
BUP: 0.03/0.05; NBUP: 0.04/0.1 [7,8]
0.5-ml blood or tissue; N-propyl-NBUP BUP: –/–; NBUP: –/– [9]
1-ml oral fluid; BUP-d4; analysis of multi-drugs BUP: 0.5/1.8; NBUP: –/– [10]
2-ml plasma; BUP-d4 BUP: –/0.5; NBUP: –/– [11]
HFB HFBA 1-ml plasma; N-propyl-NBUP; unsilanized tube caused BUP, NBUP to form ester, olefin, and dimethyoxy-buprenorphine
BUP: 0.1/–; NBUP: 0.1/– [3]
1-ml plasma BUP: –/0.2; NBUP: –/0.03 [12]
TMS BSTFA Analysis of multi-drugs BUP: –/–; NBUP: –/– [13]
3-ml urine; BUP-d4 BUP: 1.0/4; NBUP: 1.0/4 [14]
1-ml urine; Nalorfina BUP: –/1; NBUP: –/– [15]
40-!l plasma; BUP-d4 BUP: –/–; NBUP: –/– [16]
TMS MSTFA 2-ml urine or 50-mg hair; BUP-d4; NBUP-d3and norcodeine
were not effective internal standards
LOQ for BUP/NBUP 0.25/0.20 for urine; 0.005/0.005 ng/mg for hair
[17]
50-mg hair; BUP-d4; analysis of multi-drugs BUP: –/–; NBUP: –/– [18]
250-!l oral fluid; BUP-d4; analysis of multi-drugs/MSTFA
was more effective than HFBA and MTBSTFA for the analysis BUP and NBUP
BUP: –/89.5; NBUP: –/28.7 [19]
PFP, pentafluoropropionyl; HFB, heptafluorobutyryl; TMS, trimethylsilyl; BUP: buprenorphine; NBUP: norbuprenorphine—these derivatization reagents have not been applied to the analysis of BUP or its metabolites; references cited here are their applications to the analysis of other categories of drugs.
orobutyric anhydride (HFBA) [3,12] for acylation; and N,O-bis(trimethylsilyl)-trifluoroacetamide (BSTFA) [13–16] and
N-methyl-N-trimethylsilyltrifluoroacetamide (MSTFA)[17–19]
for silylation. In addition, trifluoroacetic anhydride (TFAA) and
N-methyl-bis(trifluoroacetamide) (MBTFA) were also included in this study, because they were frequently used in our labora-tory and will complement the series of acylation reagents (listed above) for comparison purposes.
Data derived from this comparative study provided valuable information on the formations of derivatization artifact products and the most favorable derivatization approaches and internal standards (ISs) for GC–MS analysis of BUP and NBUP. In
addition, comprehensive and systematic presentation of mass spectra resulting from the applications of various derivatization approaches to BUP, NBUP, and related derivatization products should be of reference value to readers interested in this and related areas.
2. Experimental
2.1. Chemical, reagents, and clinical samples
Standards and ISs, BUP, NBUP, [2H4]BUP (BUP-d4), and
[2H3]NBUP (NBUP-d3) in 100 !g/ml methanol solutions were Table 2
Procedures for the derivatization of BUP and NBUP for gas chromatographic methods of analysis Der. group Procedure
Methyl To the dried sample extract or dried standard, add 100 !l freshly prepared TMAH/DMSO (1:20) solution and vortex-mixed for 2 min, followed by the addition of 100 !l iodomethane. The mixture was incubated at room temperature for 60 min, then acidified with 400 !l of 0.1-N HCl and extracted with 2-ml n-hexane. The mixture was centrifuged at 2500 rpm (r = 16.5 cm) for a minimum of 5 min. After the lower aqueous phase had been frozen in an isopropanol/dry ice bath, the organic phase was removed and evaporated to dryness under a stream of nitrogen at 50◦C. At last, the residue was reconstituted with ethyl acetate when GC/MS analysis was performed[4].
Acetyl To the dried sample extract or dried standard, add 500 !l acetic anhydride and 200 !l pyridine. Cap the tube, vortex-mix, and incubate for 30 min at 80◦C in a heating block. Evaporate the solvent to dryness at 50◦C under nitrogen. Reconstitute with ethyl acetate for GC–MS analysis[7]. TFA To the dried sample extract or dried standard, add 100 !l MBTFA. Cap the tube, vortex-mix, and incubate for 30 min at 90◦C in a heating block.
Cool the mixture for GC–MS analysis.
TFA To the dried sample extract or dried standard, add 50 !l TFAA and 50 !l ethyl acetate. Cap the tube, vortex-mix, and incubate for 60 min at 80◦C
in a heating block. Evaporate the solvent to dryness at room temperature under nitrogen. Reconstitute with ethyl acetate for GC–MS analysis. PFP To the dried sample extract or dried standard, add 50 !l PFPA and 50 !l ethyl acetate. Cap the tube, vortex-mix, and incubate for 60 min at 40◦C in
a heating block. Evaporate the solvent to dryness at room temperature under nitrogen. Reconstitute with ethyl acetate for GC–MS analysis[8–12]. HFB Same as the procedure for PFPA reagent, except the reagent (HFBA) and the incubation temperature (60◦C)[1,3].
TMS Same as the procedure for MBTFA reagent, except the reagent (MSTFA with 1% TMCS or BSTFA with 1% TMCS)[14–20]. TFA, trifluoroacetyl; PFP, pentafluoropropionyl; HFB, heptafluorobutyryl; TMS, trimethylsilyl.
Author's personal copy
C.-H. Wu et al. / J. Chromatogr. A 1182 (2008) 93–112 95
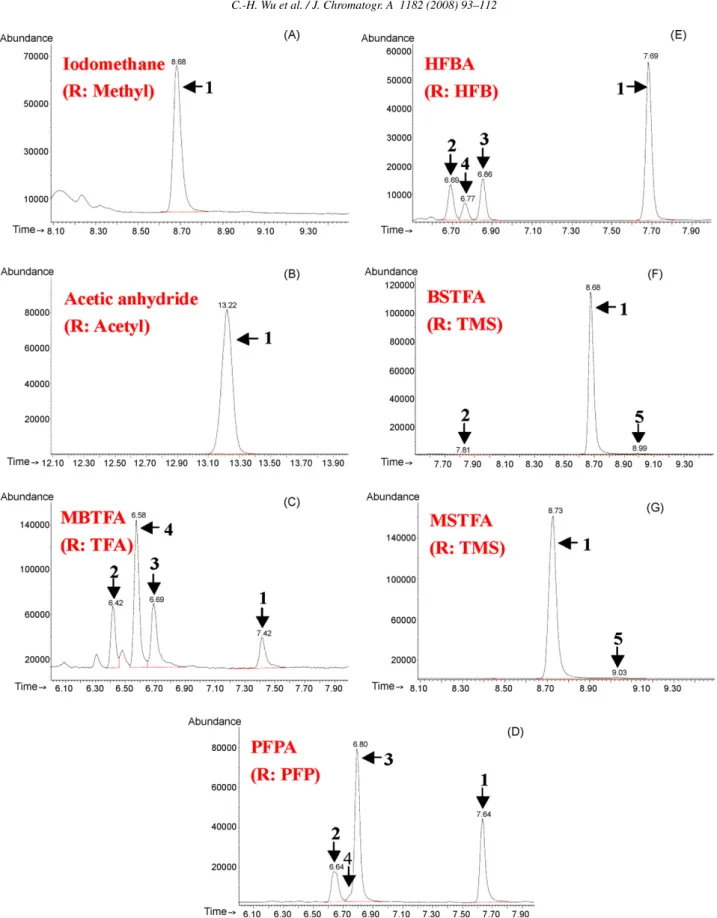
Fig. 1. Ion chromatograms of BUP resulting from its reaction with various derivatization reagents: iodomethane (A), acetic anhydride (B), MBTFA (C), PFPA (D), HFBA (E), BSTFA (F), and MSTFA (G). (The structures of compounds identified as 1–5 are further depicted inFig. 3with their mass spectra shown inFig. 4.).
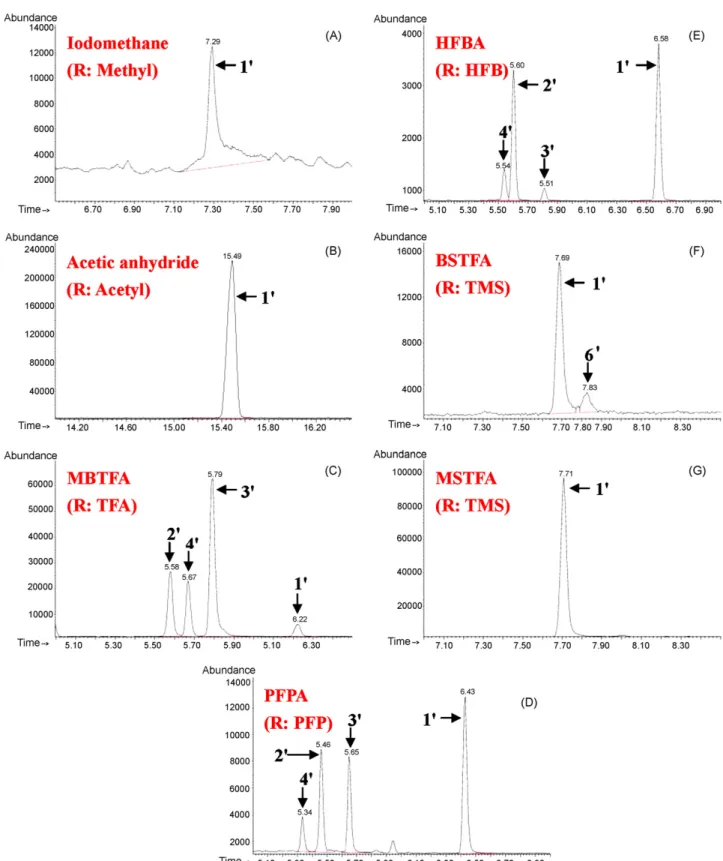
Fig. 2. Ion chromatograms of NBUP resulting from its reaction with various derivatization reagents: iodomethane (A), acetic anhydride (B), MBTFA (C), PFPA (D), HFBA (E), BSTFA (F), and MSTFA (G). (The structures of compounds identified as 1#–6#are further depicted inFig. 3with their mass spectra shown inFig. 5.).
purchased from Cerilliant (Austin, TX, USA). These stan-dards were refrigerated at 4◦C during the period of the study.
The sources of the chemical derivatization reagents are as follows: MBTFA, BSTFA, MSTFA: Pierce (Rockford, IL, USA); acetic anhydride: Finechem (Wellington, Auckland,
New Zealand); TFAA: Sigma–Aldrich (Milwaukee, WI, USA); PFPA and HFBA: Alfa-Aesar (Heysham, Lancs, Germany); iodomethane: Ferak Berlin (Berlin, Germany). Formulated liquid–liquid extraction device, Toxi-Tubes A, was purchased from Varian (Lake Forest, CA, USA). Tetramethylammonium
Author's personal copy
C.-H. Wu et al. / J. Chromatogr. A 1182 (2008) 93–112 97
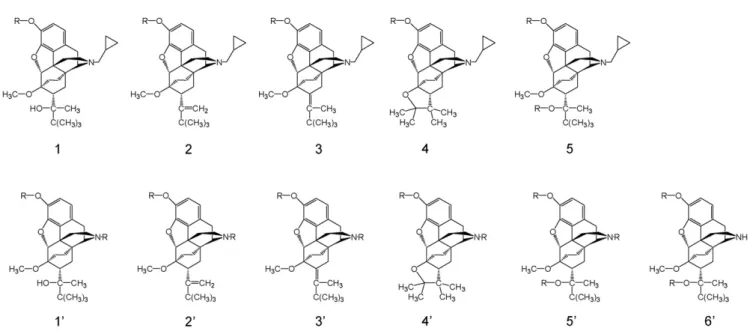
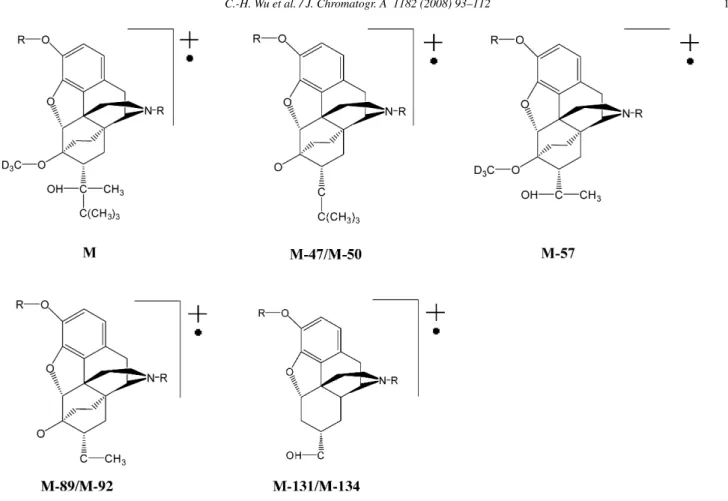
Fig. 3. Major components resulting from the reactions of BUP and NBUP with various derivatization reagents. (Compounds 1–5 were derived from buprenorphine, while compounds 1#–6# were derived from norbuprenorphine. R groups in these compounds are: for compounds 1–4 and 1#–4#, R CH3–, CH3CO–, CF3CO–,
C2F5CO–, C3F7CO–, or (CH3)3Si–, pending on the derivatization reagents; for compounds 5, 5#, and 6#, R (CH3)3Si–.
hydroxide (TMAH) was from Acros Organics (Fairlawn, NJ, USA) and n-hexane and ethyl acetate were purchased from Mallinokrodt Bakers (Phillipsburg, NJ, USA). All solvents and chemicals were analytical or HPLC grades.
Urine samples of heroin addicts under BUP treatment were provided by Clinical Service and Hospitalization for Drug/Alcohol Addicts, Taipei City Hospital Songde Branch (Taipei, Taiwan). These samples were collected following the institution’s IRB protocols.
2.2. Derivatization and sample preparation procedures for the determination of limits of detection and quantitation
Derivatization reactions were carried out on analytes and ISs separately to obtain full-scan mass spectra and ion inten-sity cross-contribution (CC) data (see further description in Section3). When the analytes and ISs were derivatized, 10 !l (100 !g/ml) individual analyte and IS was transferred into indi-vidual 16 × 100-mm glass tubes and evaporated to dryness under a stream of nitrogen at 50◦C. The same procedures described
inTable 2were used to derivatize the dried standards or sample extracts.
For determining the limits of detection and quantitation for (LOD/LOQ) NBUP and BUP in urine, a series of standard urine solutions containing 50 ng/ml of NBUP-d3or BUP-d4and the
following concentrations of NBUP and BUP (separately) were prepared: 0.5, 1.5, 2.5, 5.0, 10, 25, and 50 ng/ml. For the anal-ysis of free NBUP and BUP in urine samples collected from heroin addicts under BUP treatment, calibration standards were prepared in drug-free urine that include the following concen-trations of NBUP/BUP: 0/0, 2/4, 20/10, 60/30, 150/80, 300/150, 600/300, 1000/500 ng/ml.
The analyte/IS in these samples were extracted by Toxi-Tubes A following the procedures provided by the manufacturer.
Specifically, 2 ml of the samples were added to the tube, fol-lowed by the addition of distilled water to bring the total volume to 5 ml. The mixture was mixed for 10 min, then centrifuged at 2500 rpm for 10 min. The organic phase was removed and dried under a stream of nitrogen. The dried residue was derivatized using the procedure shown inTable 2.
2.3. GC–MS analysis
An Agilent 6890N gas chromatograph/5975 mass-selective detector system operating at 70 eV with ion source temperature set at 230◦C was used for this study. The gas chromatograph was
equipped with a 12-m HP-5 (Wilmington, DE, USA) crosslinked 5% phenyl methyl siloxane capillary column (12 m length, 200 !m I.D. and 0.33 !m film thicknesses). The injector tem-perature and GC–MS interface temtem-perature were maintained at 260 and 280◦C, respectively. The sample was introduced into
the gas chromatograph in splitless mode and the helium carrier gas flow rate was set at 1.0 ml/min. The initial oven temperature was set at 120◦C for 0.5 min; raised to 250◦C at 40◦C/min, and
held for 0.5 min; then raised to 300◦C at 10◦C/min, and held
for 3 min to clean up the column before returning to 120◦C for
the next injection.
2.4. Collection and evaluation of mass spectra and ion-pair intensity cross-contribution data
Typically, full-scan mass spectra of the analytes of interest were obtained by injecting individual derivatization products into the GC–MS system. With a few exceptions, full-scan mass spectra were collected starting at m/z 50 and ended at a mass higher than the molecular weights of the derivatized products, rounded to the next 50, i.e., 350, 400, 450, etc. A separate run was repeated for each isotopic analog of each analyte.
Reten-tion time and mass spectrometric data derived from these runs were used to characterize the analytes and their isotopic analogs. Full-scan mass spectrometric data were stored as digital files that were then converted into mass spectra of a more desirable format for systematic presentation as shown in Section3. This conver-sion was carried out using the DeltaGraph software (DeltaPoint: Seattle, WA, USA) on an Apple iMac G5 computer (Cupertino, CA, USA).
Full-scan mass spectrometric data obtained from these runs were reviewed to select ions that may potentially be used for
designating the analytes and their ISs in quantitative GC–MS protocols. These derivatization products were injected sep-arately into the GC–MS system again under selected ion monitoring (SIM) mode, including ions selected from the full-scan mass spectrometric data. General criteria adapted for SIM ion selection were (a) the ion’s relative intensity in the full-scan mass spectrum was ≥10%; and (b) the full-scan intensity data indicated less than 10% CC. Ions with lower intensity would have been included if there were less than three pairs of ions that met the above criteria. The resulting SIM data were
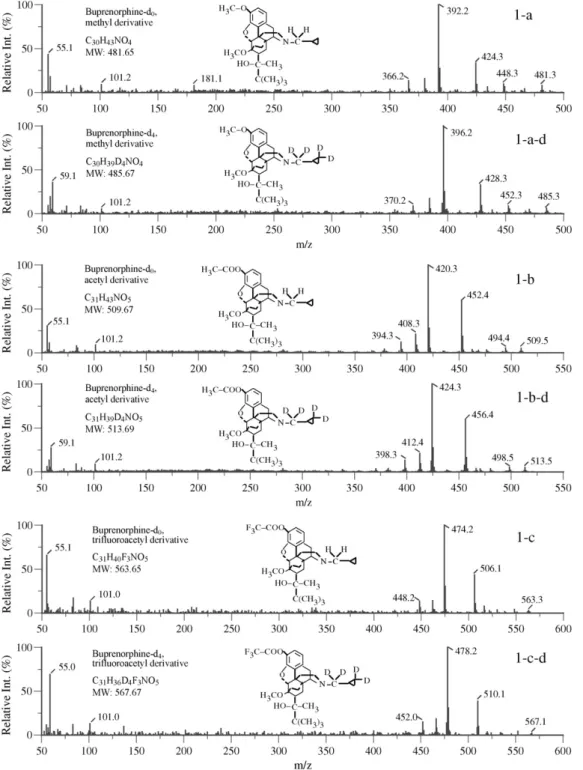
exam-Fig. 4. Mass spectra of buprenorphine and derivatization artifact products (and their isotopically labeled analog) resulting from various derivatization groups: buprenorphine (1), derivatization artifact product-I (2), derivatization artifact product-II (3), derivatization artifact product-III (4).
Author's personal copy
C.-H. Wu et al. / J. Chromatogr. A 1182 (2008) 93–112 99
Fig. 4. (Continued )
ined to obtain more accurate CC data of these selected ion-pairs. Details of the methodology have been described in our earlier publications[20].
3. Results and discussion
Literature review summarized in Section1(Table 1) indicates that all three major derivatization categories (alkylation, acyla-tion, and silylation) have been applied to the analysis of BUP and NBUP. Concerned with the formation of olefin and cyclic
compounds reported under various conditions[3–5], we have conducted a systematic study to better understand: (a) the con-ditions under which these unintended by-products were formed; and (b) which derivatization approaches would produce the most desirable products for the analysis of the two analytes of interest. This “systematic” study included the following steps: (a) derivatization of BUP and NBUP and their deuterated analogs (BUP-d4, and NBUP-d3) standards by all derivatization reagents
mentioned earlier; (b) GC–MS analysis of the resulting prod-ucts to identify major derivatization prodprod-ucts and to obtain the
full-scan mass spectra of these compounds; (c) evaluating the full-scan mass spectra to identify ion-pairs (generated by these derivatization products) with potential for designating the ana-lytes and their respective ISs for qualitative and quantitative analyses; and (d) collecting intensity data of the selected ion-pairs, under SIM mode, for the calculation of ion CC data (the contribution of IS to the intensity of ions designating the analyte, and vice versa). Ion intensity CC data obtained in step (d) and the derivatization products’ abundances observed in step (a) were used as the criteria to select the most favorable derivatization approach for the analysis.
3.1. Derivatization products and their mass spectrometric data—derivation products, peak intensity, and ion intensity cross-contribution
The first part of this study involved the identification of analyte-related products resulting from the use of various deriva-tization reagents. Typical ion chromatograms derived from the use of various reagents are shown inFig. 1(for BUP) andFig. 2
(for NBUP). Based on literature information and the mass spec-tra observed from BUP, NBUP, and their deuterated analogs experiments, analyte-related products are identified as
Author's personal copy
C.-H. Wu et al. / J. Chromatogr. A 1182 (2008) 93–112 101
Fig. 4. (Continued )
pounds 1–5 (for BUP) and 1#–6#(for NBUP) with their chemical
structures illustrated inFig. 3. The mass spectra of these series of compounds, including the deuterated analogs, are shown in
Fig. 4(for BUP) andFig. 5(for NBUP).
In reference to certain literature information and with the benefits of comparing the mass spectrometric and chromato-graphic data derived from structural (BUP vs. NBUP) and isotopic (analytes vs. their deuterated counterparts) analogs, we are comfortable with the structural assignments as shown in
Fig. 3. However, since authentic compounds have not been used
in parallel experiments, these assignments are not considered definitive.
3.1.1. Abundance of the derivatization product
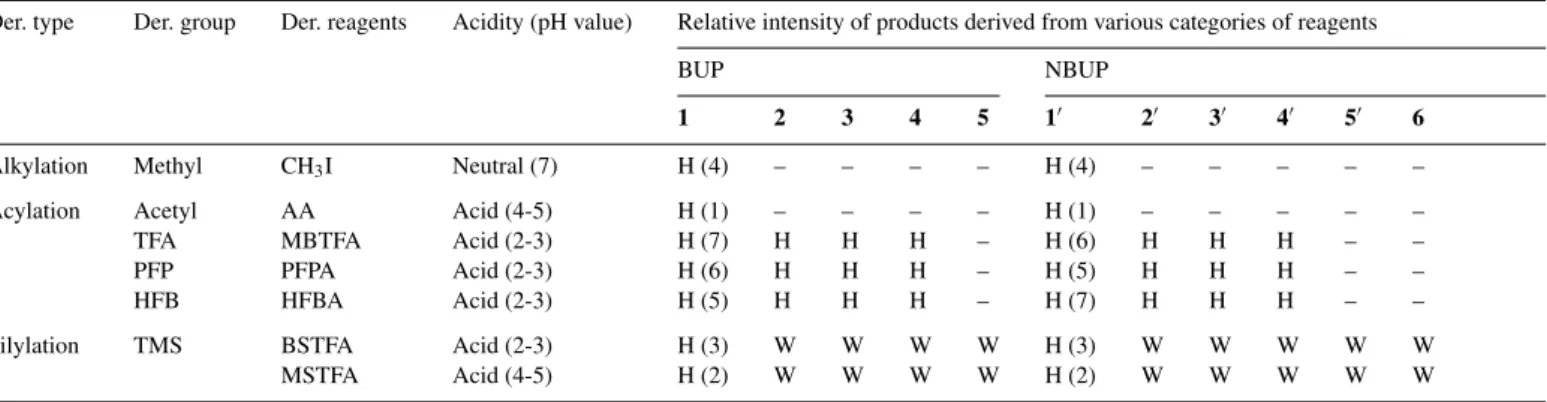
Based on the ion chromatograms shown inFigs. 1 and 2, inter-and intra-run relative peak intensities of these compounds are summarized inTable 3. The high acidity (pH 2–3) of the fluori-nated acylation reagents (MBTFA, PFPA, and HFBA) resulted in the formation of olefin and cyclic compounds. These com-pounds were also observed, but to a lesser extent, when the
silylation reagents (BSTFA and MSTFA) were applied. Com-pounds 1 and 1#retain the structural features of the analytes and
were the most abundant components among the derivatization products in most cases. They are undoubtedly the most suitable derivatization products to be used for designating the analytes in the analytical process. Using peak intensity of the primary product and cleanness of the chromatogram as the evaluation criteria, AA is the preferred reagent. Silylation with MSTFA is the second choice.
While various categories of derivatization procedures adapted from literature reports have been optimized for their
applications to the derivatization of BUP and NBUP, poten-tial optimization steps have obviously not been exhausted. It is thus possible to find other derivatization reagents or condi-tions that may alter the peak intensity rankings as shown in
Table 3.
3.1.2. Ion-pairs for designating the analyte and the IS
The second part of this study involved the identification of ion-pairs with potential for designating the analytes and their isotopically labeled analogs, followed by the evaluation of these ion-pairs’ CC characteristics. Cross contribution is
Author's personal copy
C.-H. Wu et al. / J. Chromatogr. A 1182 (2008) 93–112 103
Fig. 4. (Continued ).
defined as the contribution of the IS to the intensities of the ions designating the analyte and vice versa. Since the mea-sured ion intensities are used for the quantitation of the analyte, adapting an ion-pair with significant CC will result in a nar-rower linearity range of the calibration curve and generate apparent higher (or lower) analyte concentrations. If the contri-bution of the IS to the analyte is more significant, the observed apparent analyte concentration will be higher than its true value. The error will become more significant as the analyte’s concentration is lowered. On the other hand, the observed appar-ent analyte concappar-entration will be lower than its true value when the analyte’s contribution is more significant. This error will become more significant as the analyte’s concentration is increased[21].
The observed CC data are shown inTable 4(for BUP) and
Table 5(for NBUP). These data are extremely helpful to the selection of internal standards and derivatization methods for qualitative and quantitative analysis of BUP and NBUP. Ion-pairs included in the tables are limited to those showing ≤5% of CC. We have demonstrated[22]that adapting ion-pairs with 5% CC (or higher) for quantitation will result in a very limited linear range.
Data summarized inTable 4indicate that several ion-pairs can be used for designating the analyte/IS in the
BUP/BUP-d4system—i.e., the contributions of BUP-d4to the intensities
of ions designating BUP (and vice versa) are generally low for several high intensity ion-pairs. This is especially true for the methyl- and acetyl-derivatives. On the other hand, parallel data shown in Table 5for NBUP/NBUP-d3 are not as
favor-able. Specifically, with the exception of the acetyl-derivatives, derivatization products failed to produce three ion-pairs with ≤5% CC for the NBUP/NBUP-d3 system. Furthermore,
ion-pairs with lower CC are minor fragments in their respective mass spectra.
3.2. Fragmentation patterns and the selection of ion-pairs from the analyte/IS for quantitation
Lacks of suitable high intensity ion-pairs for designat-ing the analyte/IS in the NBUP/NBUP-d3 system call for
closer examinations into the fragmentation pathways of this series of compounds. With the availability of mass spec-trometric data derived from compounds that are analogous structurally (BUP/NBUP pair) and isotopically (BUP/BUP-d4
Table 3
Relative SIM ion chromatogram intensity of BUP and NBUP resulting from various chemical derivatization reagents
Der. type Der. group Der. reagents Acidity (pH value) Relative intensity of products derived from various categories of reagents
BUP NBUP
1 2 3 4 5 1# 2# 3# 4# 5# 6
Alkylation Methyl CH3I Neutral (7) H (4) – – – – H (4) – – – – –
Acylation Acetyl AA Acid (4-5) H (1) – – – – H (1) – – – – –
TFA MBTFA Acid (2-3) H (7) H H H – H (6) H H H – –
PFP PFPA Acid (2-3) H (6) H H H – H (5) H H H – –
HFB HFBA Acid (2-3) H (5) H H H – H (7) H H H – –
Silylation TMS BSTFA Acid (2-3) H (3) W W W W H (3) W W W W W
MSTFA Acid (4-5) H (2) W W W W H (2) W W W W W
The relative intensities of products derived from various reagents are designated as H (high) or W (weak). Those designated as “H” for compounds 1 and 1#are
Fig. 5. Mass spectra of NBUP and derivatization artifact products (and their isotopically labeled analog) resulting from various derivatization groups: NBUP (1#), derivatization artifact product-I (2#), derivatization artifact product-II (3#), derivatization artifact product-III (4#).
and NBUP/NBUP-d3pairs), elucidating the major
fragmenta-tion pathways was relatively easy.
Table 6summarizes the major ions observed in the mass spec-tra of these two analytes and their isotopic analogs. Shown in
Fig. 6are major fragments derived from BUP-d4, illustrating the
same fragmentation pattern for both BUP and BUP-d4that are
derivatized with various derivatization groups. Since these ions all retain the structural framework in where the labeling deu-terium atoms are positioned, the masses of these ions derived
from the analyte and the IS all differ by 4; thus, they are all potential candidates for designating BUP and BUP-d4 in the
analytical process.
On the other hand, the mass spectrometric data derived from the NBUP/NBUP-d3system show variations among
differ-ent derivatization products. Structural information for the ions included in the lower section ofTable 6are shown inFig. 7. Most significantly, the most abundant ions derived from the methyl-and TMS-derivatives are [M-89]+ for NBUP and [M-92]+ for
Author's personal copy
C.-H. Wu et al. / J. Chromatogr. A 1182 (2008) 93–112 105
Fig. 5. (Continued )
NBUP-d3. Thus, the most abundant ions derived from the
ana-lyte and the IS have the same mass and cannot be adapted for designating the analyte and the IS. For acyl-derivatives, the most abundant ions derived from the analyte and the IS are both [M-57]+, resulting in a mass difference of 3 and can potentially be
used for designating the analyte and the IS. Information shown inTable 5also indicate favorable ion intensity CC data for this ion pair. However, other high intensity ions do not retain the structural framework in where the labeling deuterium atoms are positioned; thus, cannot be used for designating NBUP and NBUP-d3.
3.3. Linearity study
Having concluded that acetyl-derivatization is the most effec-tive approach and NBUP-d3 contributes significantly to the
ion designating NBUP (1.20% as shown in Table 5 for ion
m/z 440), we have conducted linearity studies in two aspects. First, calibration characteristics of the BUP/BUP-d4 and the
NBUP/NBUP-d3 systems as applied to the analysis of urine
samples collected from heroin addicts under BUP treatment were examined. Furthermore, the effectiveness of NBUP-d3and
Fig. 5. (Continued )
compared. This study was studied by spiking the analytes into drug-free urine.
3.3.1. Calibration characteristics in the analysis of clinical samples
The effectiveness of BUP-d4 and NBUP-d3 in serving as
the ISs for the quantitation of BUP and NBUP in urine sam-ples collected from heroin addicts under BUP treatment was studied with focus on the analysis of free BUP and NBUP in these samples. Since the concentrations of NBUP in these
sam-ples are normally higher than BUP, the highest concentration of NBUP in the calibration standards was higher than that for BUP. Using standards ranging from 2–1000 ng/ml for NBUP and 4–500 ng/ml for BUP, the ranges of the correlation coefficients achieved for the NBUP/NBUP-d3and the BUP/BUP-d4systems
were 0.9970–0.9998 and 0.9920–0.9990, respectively. The low-est and highlow-est concentrations in these standards were found to be the LOD and the upper limit of linearity for respective ana-lytes, i.e., 4 and 500 ng/ml for BUP and 2 and 1000 ng/ml for NBUP. However, the LOQs achieved for BUP and NBUP were
Author's personal copy
C.-H. Wu et al. / J. Chromatogr. A 1182 (2008) 93–112 107
Fig. 5. (Continued )
10 and 20 ng/ml, respectively. Thus, to achieve lower LOQs for the quantitation of BUP and NBUP, especially the latter, it is necessary to prepare another set of calibration standards at a lower concentration range or explore the use of an alternative IS, especially for NBUP.
3.3.2. NBUP-d3versus BUP-d4as the IS for the quantitation of NBUP
Possessing practically the identical chemical properties, an isotopically labeled analog of the analyte is generally consid-ered the most suitable IS in a quantitation protocol. However,
if the positions of the deuterium atoms in the molecular framework are not properly selected, the ion fragmentation process may not generate suitable ion-pairs (with high inten-sity and low CC) for designating the analyte and the IS. Mass spectra shown inFig. 5indicate, with the exception of the acetyl-derivatives, the most abundant ions do not include the three deuterium atoms that were used as the labels in NBUP-d3. Data shown in Table 5 further indicate that the
number of ion-pairs with ≤5% CC is very limited and these ion-pairs are not the most abundant ions in their respective mass spectra. These observations raise the question
concern-Fig. 5. (Continued ).
Author's personal copy
C.-H. Wu et al. / J. Chromatogr. A 1182 (2008) 93–112 109 Table 4
Relative intensity and CC data of ions with potential for designating the analyte and the adapted internal standard—BUP-d0/BUP-d4
Derivatization group Buprenorphine-d0 Buprenorphine-d4
Ion (m/z) Rel. int. Analog’s cont. Ion (m/z) Rel. int. Analog’s cont.
Methyl 366 8.99 2.88 370 10.8 0.10 392 100 0.19 396 100 0.01 424 32.4 1.89 428 37.8 0.01 434 5.32 0.03 438 8.70 0.60 448 9.02 0.89 452 8.15 0.02 481 6.09 0.39 485 8.02 0.03 Acetyl 394 12.1 2.37 398 13.1 0.64 408 21.1 1.37 412 20.9 0.71 420 100 0.40 424 100 0.33 421 27.9 0.76 425 27.6 0.41 452 58.5 2.61 456 59.8 0.10 TFA (MBTFA) 474 100 0.09 478 100 3.15 506 43.3 0.36 510 38.6 1.20 516 7.46 0.51 520 3.38 2.26 PFP 498 9.85 1.51 602 3.52 4.89 512 20.2 0.01 516 20.0 0.02 524 100 0.29 528 100 0.78 556 32.1 1.04 560 28.6 0.35 HFB 562 15.6 4.42 566 19.8 1.08 574 100 2.65 578 100 0.91 606 41.7 4.75 610 31.2 1.32 TMS (MSTFA) 424 9.86 2.24 428 10.2 3.23 438 13.3 3.27 442 13.1 4.65 450 100 0.48 454 100 1.26 482 32.6 1.48 486 33.0 0.91 492 15.6 0.18 496 16.3 1.48 506 25.2 0.03 510 23.6 1.47 524 8.46 4.78 528 7.29 1.11 539 6.68 0.08 543 6.20 0.69 [TMS]2 438 30.8 3.50 442 14.4 2.50 506 41.5 1.70 510 26.3 0.95 554 48.3 0.00 558 35.4 1.46 555 52.1 2.25 559 14.6 0.00 611 11.7 0.00 615 2.23 0.00
Relative intensity are based on full-scan data and expressed in percentage, while analog’s contribution (CC) are derived from selected ion monitoring data and expressed in percentage.
ing whether NBUP-d3is an effective IS for the quantitation of
NBUP.
Thus, a study was conducted to compare the effectiveness of BUP-d4 and NBUP-d3 in serving as the IS for the
quan-titation of NBUP. This study was carried out adapting the most favorable acetyl- and TMS-derivatization approaches as concluded in previous discussion. Following the procedure described in Section 2, series of urine standards containing 0.5–50 ng/ml of BUP and NBUP were evaluated to deter-mine the achievable LOD/LOQ with BUP-d4 and NBUP-d3
serving as the ISs. For this purpose, LOD is defined as the lowest concentration at which the two independent ion inten-sity ratios of the three ions monitored are within ±20% of that observed in the calibration standard. LOQ is defined as the lowest concentration that meets the LOD requirement and the observed concentration is also within ±20% of the expected value. The resulting data shown inTable 7indicate
that: (a) for the analysis of BUP and NBUP, the acetyl- is better than the TMS-derivatization in achieving more favor-able LOD/LOQ values; and (b) for the analysis of NBUP, BUP-d4 is a better IS than NBUP-d3. Specifically, for the
analysis of NBUP using BUP-d4 as the IS, the LOD/LOQ
values achieved by acetyl- and TMS-derivatizations are 2.5 and 5.0 ng/ml, respectively. The corresponding LOD/LOQ val-ues achieved using NBUP-d3 as the IS are 10 and 50 ng/ml,
respectively. For the analysis of BUP, the LOD/LOQ values achieved by acetyl- and TMS-derivatizations are 5 and 10 ng/ml, respectively.
These empirical findings, illustrated in the last paragraph, are consistent with (a) the ion CC data shown in Table 5, i.e., 1.20% of m/z 440 designating the analyte is contributed by NBUP-d3; and (b) the close similarity of the structural
features between BUP-d4 and NBUP. The conclusion is that,
Table 5
Relative intensity and CC data of ions with potential for designating the analyte and the adapted internal standard—NBUP-d0/NBUP-d3
Derivatization group Norbuprenorphine-d0 Norbuprenorphine-d3
Ion (m/z) Rel. int. Analog’s cont. Ion (m/z) Rel. int. Analog’s cont.
[Methyl]2 384 72.5 4.38 387 51.2 1.37 [Acetyl]2 422 10.6 2.66 425 9.53 1.84 440 100 1.20 443 100 0.68 441 27.6 1.79 444 26.6 0.23 482 2.65 0.07 485 1.85 0.90 [TFA]2(MBTFA) 548 100 0.77 551 100 3.31 530 5.87 0.92 533 15.4 4.68 [PFP]2 648 54.1 2.63 651 91.3 0.24 630 9.19 0.59 633 6.80 0.00 [HFB]2 748 41.0 0.17 751 47.6 1.02 730 3.72 1.49 733 4.02 2.17 [TMS]2(MSTFA) 500 31.5 1.24 503 30.4 3.60 557 6.33 2.71 560 5.29 3.45
[TMS]3 None (No ion pair meets the selection criteria)
Relative intensity are based on full-scan data and expressed in percentage, while analog’s contribution (CC) are derived from selected ion monitoring data and expressed in percentage.
Table 6
Characteristic ions of BUP/BUP-d4and NBUP/NBUP-d3with various derivatization groups
Der. group (mass) Significant ions and their relative intensities (BUP/BUP-d4)
M M-57 M-89 M-101 M-115 Methyl (15) 481 (7.88) 424 (33.3) 392 (100) 380 (15.8) 366 (13.4) 485 (6.38) 428 (32.9) 396 (100) 384 (17.5) 370 (8.91) Acetyl (43) 509 (3.40) 452 (51.6) 420 (100) 408 (18.8) 394 (15.3) 513 (5.03) 456 (61.1) 424 (100) 412 (25.7) 398 (17.1) TFA (97) 563 (3.07) 506 (43.3) 474 (100) 462 (14.1) 448 (13.2) 567 (2.12) 510 (38.6) 478 (100) 466 (18.3) 452 (15.1) PFP (147) 613 (2.21) 556 (34.6) 524 (100) 512 (18.8) 498 (12.4) 617 (2.38) 560 (29.2) 528 (100) 516 (18.4) 502 (13.1) HFB (197) 663 (4.49) 606 (42.5) 574 (100) 562 (15.4) 548 (17.9) 667 (1.86) 610 (36.4) 578 (100) 566 (21.6) 552 (12.8) TMS (73) 539 (6.65) 482 (34.7) 450 (100) 438 (14.6) 424 (10.7) 543 (5.86) 486 (33.2) 454 (100) 442 (15.7) 428 (9.87)
Der. group (mass) Significant ions and their relative intensities (NBUP/NBUP-d3)
M M-33 M-47/M-50 M-57 M-89/M-92 M-131/M-134 Methyl (15) 441 (5.39) 408 (12.8) – 384 (72.5) 352 (100) – 444 (5.66) 411 (19.8) – 387 (51.2) 352 (100) – Acetyl (43) 497 (0.00) – – 440 (100) 408 (38.2) 366 (18.5) 500 (0.00) – – 443 (100) 408 (38.4) 366 (22.9) TFA (97) 605 (0.00) – – 548 (100) 516 (89.1) 474 (41.7) 608 (0.00) – – 551 (100) 516 (74.0) 474 (34.1) PFP (147) 705 (0.00) – – 648 (100) 616 (94.3) 574 (30.7) 708 (0.00) – – 651 (100) 616 (88.9) 574 (29.5) HFB (197) 805 (0.00) – – 748((83.8) 716 (82.2) 674 (26.8) 808 (0.00) – – 751((86.0) 716 (71.0) 674 (29.2) TMS (73) 557 (6.33) 524 (27.2) 510 (27.2) 500 (31.5) 468 (79.7) – 560 (5.28) 527 (13.1) 510 (14.8) 503 (30.4) 468 (82.0) –
Ions underlined are the best candidates for designating the analytes and the internal standards. Entries with “–” indicate the corresponding ions derived from that particular derivative are not significant ones. With the exception of [M-22], the structures of all ions are shown inFig. 6(for BUP/BUP-d4) andFig. 7(for
Author's personal copy
C.-H. Wu et al. / J. Chromatogr. A 1182 (2008) 93–112 111
Fig. 7. Major ions derived from various derivatization products of NBUP/NBUP-d3.
Table 7
Effectiveness of NBUP-d3and BUP-d4as the ISs for the quantitation of NBUP and BUP
Der. group Analyte/IS Identification and quantitation ion LOD (ng/ml) LOQ (ng/ml)
Acetyl NBUP/BUP-d4 440, 408, 366/424, 456, 412 2.5 2.5 NBUP/NBUP-d3 440, 441, 422/443, 444, 425 10 10 BUP/BUP-d4 420, 452, 408/424, 456, 412 5.0 5.0 TMS NBUP/BUP-d4 468, 500, 524/454, 510, 486 5.0 5.0 NBUP/NBUP-d3 500, 524, 482/503, 527, 485 50 50 BUP/BUP-d4 450, 506, 482/454, 510, 486 10 10
Ions underlined are used for quantitation.
necessarily be a better IS than a structurally closely related analog.
4. Conclusion
It have been clearly demonstrated that derivatization reagents that are strongly acidic in nature will result in the formation of analyte-derived artifact products, depleting the abundance of the targeted derivatization product; thus, not suitable for the analysis of BUP and NBUP. Secondly, derivatization by acetic anhy-dride generates ion-pairs that are most effective for designating BUP/BUP-d4and NBUP/NBUP-d3; thus, most suitable for the
analysis of BUP and NBUP. Thirdly, with the positions of the deuterium atoms placed in the molecular framework of
NBUP-d3, this isotopic analog of the analyte is not an effective IS. In
fact BUP-d4(a structural analog to NBUP) can effectively serve
as the IS for the quantitation of both BUP and NBUP.
Acknowledgments
Full mass spectrometric data generated by the GC–MS sys-tem were skillfully converted to the format hereby presented by Meng-Yen Wu of Fooyin University. Urine samples col-lected from heroin addicts were kindly provided by Clinical Service and Hospitalization for Drug/Alcohol Addicts, Taipei City Hospital Songde Branch (Taipei, Taiwan). This work is partially supported by Department of Health National Bureau of Controlled Drugs (DOH97-NNB-1005) and National Science Council (NSC 96-2113-M-242-002-MY2).
References
[1] I. Galynker, D.J. Schlyer, S.L. Dewey, J.S. Fowler, S.J. Logan, R. Gatley, R. MacGregor, R.A. Ferrieri, M.J. Holland, J. Brodie, E. Simon, A.P. Wolf, Nucl. Med. Biol. 23 (1996) 325.
[2] E.J. Cone, C.W. Gorodetzky, D. Yousefnejad, W.F. Buchwald, R.E. Johson, Drug Metab. Dispos. 12 (1984) 577.
[3] E.T. Everhart, P. Cheung, P. Shwonek, K. Zabel, E.C. Tisdale, P. Jacob III, J. Mendelson, R.T. Jones, Clin. Chem. 43 (1997) 2292.
[4] A.M. Lisi, R. Kazlauskas, G.J. Trout, J. Chromatogr. B 692 (1997) 2 67.
[5] E.J. Cone, C.W. Gorodetzky, W.D. Darwin, W.F. Buchwald, J. Pharm. Sci. 73 (1984) 243.
[6] M. Bottcher, O. Beck, J. Anal. Toxicol. 29 (2005) 769.
[7] S. Gopal, T.B. Tzeng, A. Cowan, Eur. J. Pharm. Biopharm. 51 (2001) 147.
[8] S. Gopal, T.B. Tzeng, A. Cowan, Eur. J. Pharm. Sci. 15 (2002) 287. [9] M. Ohtani, H. Kotaki, K. Nishitateno, Y. Sawada, T. Iga, J. Pharmacol. Exp.
Ther. 281 (1997) 428.
[10] F.M. Wylie, H. Torrance, R.A. Anderson, J.S. Oliver, Forensic Sci. Int. 150 (2005) 191.
[11] D.E. Moody, J.D. Laycock, A.C. Spanbauer, D.J. Crouch, R.L. Foltz, J.L. Josephs, L. Amass, W.K. Bickel, J. Anal. Toxicol. 21 (1997) 406. [12] J.J. Kuhlman Jr., J. Magluilo Jr., E. Cone, B. Levine, J. Anal. Toxicol. 20
(1996) 229.
[13] D. Libong, S. Pirnay, C. Bruneau, F. Rogalewicz, I. Ricordel, S. Bouchon-net, J. Chromatogr. A 1010 (2003) 123.
[14] S. George, C. George, M. Chauhan, Forensic Sci. Int. 143 (2004) 121. [15] D. Di Candia, F. Gigli, P. Tirelli, Contributi Orignali XXVI (2003) 19. [16] B. Megarbane, N. Marie, S. Pirnay, S.W. Borron, P.N. Gueye, P. Risede, C.
Monier, F. Noble, F.J. Baud, Toxicol. Appl. Pharmacol. 212 (2006)256. [17] F. Vincent, J. Bessard, J. Vacheron, M. Mallaret, G. Bessard, J. Anal.
Toxicol. 23 (1999) 270.
[18] M. Deveaux, P. Kintz, J.P. Goulle, J. Bessard, G. Pepin, D. Gosset, Forensic Sci. Int. 107 (2000) 389.
[19] T. Gunnar, K. Ariniemi, P. Lillsunde, J. Mass Spectrom. 40 (2005) 739. [20] R.H. Liu, G.F. Foster, E.J. Cone, S.D. Kumar, J. Forensic Sci. 40 (1995)
983.
[21] T.C. Whiting, R.H. Liu, W.-T. Chang, M.R. Bodapati, J. Anal. Toxicol. 25 (2001) 179.
[22] B.G. Chen, C.D. Chang, C.T. Wang, Y.C. Chen, S.M. Wang, W.T. Chang, R.H. Liu, J. Amer. Soc. Mass Spectrom., in press.