Infrared absorption of gaseous ClCS detected with time-resolved Fourier-transform
spectroscopy
Li-Kang Chu, Hui-Ling Han, and Yuan-Pern Lee
Citation: The Journal of Chemical Physics 126, 174310 (2007); doi: 10.1063/1.2730501 View online: http://dx.doi.org/10.1063/1.2730501
View Table of Contents: http://scitation.aip.org/content/aip/journal/jcp/126/17?ver=pdfcov Published by the AIP Publishing
Articles you may be interested in
Photodissociation of CH3CHO at 248 nm by time-resolved Fourier-transform infrared emission spectroscopy: Verification of roaming and triple fragmentation
J. Chem. Phys. 140, 064313 (2014); 10.1063/1.4862266
Infrared absorption of CH3OSO detected with time-resolved Fourier-transform spectroscopy J. Chem. Phys. 134, 094304 (2011); 10.1063/1.3556817
Infrared absorption of gaseous c -ClCOOH and t -ClCOOH recorded with a step-scan Fourier-transform spectrometer
J. Chem. Phys. 130, 174304 (2009); 10.1063/1.3122722
Infrared absorption of gaseous C H 3 O O detected with a step-scan Fourier-transform spectrometer J. Chem. Phys. 127, 234318 (2007); 10.1063/1.2807241
Detection of ClSO with time-resolved Fourier-transform infrared absorption spectroscopy J. Chem. Phys. 120, 3179 (2004); 10.1063/1.1641007
Infrared absorption of gaseous ClCS detected with time-resolved
Fourier-transform spectroscopy
Li-Kang Chu and Hui-Ling Han
Department of Applied Chemistry, National Chiao Tung University, 1001 Ta-Hsueh Road, Hsinchu 30010, Taiwan and Institute of Molecular Science, National Chiao Tung University, 1001 Ta-Hsueh Road, Hsinchu 30010, Taiwan
Yuan-Pern Leea兲
Department of Applied Chemistry, National Chiao Tung University, 1001 Ta-Hsueh Road, Hsinchu 30010, Taiwan; Institute of Molecular Science, National Chiao Tung University, 1001 Ta-Hsueh Road,
Hsinchu 30010, Taiwan; and Institute of Atomic and Molecular Sciences, Academia Sinica, Taipei 10617, Taiwan
共Received 6 March 2007; accepted 21 March 2007; published online 7 May 2007兲
A transient infrared absorption spectrum of gaseous ClCS was detected with a step-scan Fourier-transform spectrometer coupled with a multipass absorption cell. ClCS was produced upon irradiating a flowing mixture of Cl2CS and N2 or CO2 with a KrF excimer laser at 248 nm. A transient band in the region of 1160– 1220 cm−1, which diminished on prolonged reaction, is assigned to the C–S stretching 共1兲 mode of ClCS. Calculations with density-functional theory 共B3P86 and B3LYP/aug-cc-pVTZ兲 predict the geometry, vibrational wave numbers, and rotational parameters of ClCS. The rotational contour of the spectrum of ClCS simulated based on predicted rotational parameters agrees satisfactorily with experimental observation; from spectral simulation, the band origin is determined to be at 1194.4 cm−1. Reaction kinetics involving ClCS, CS, and CS
2 are discussed. © 2007 American Institute of Physics.关DOI:10.1063/1.2730501兴
I. INTRODUCTION
Thiocarbonyls and carbonyls exhibit qualitatively simi-lar bonding, but their photochemistry and photophysics differ substantially.1–5 For example, for larger thiocarbonyls, their lower excited states are typically more photostable and tend to relax by photophysical rather than photochemical processes.3Thiophosgene共or thiocarbonyl chloride, Cl2CS兲, as one of the simplest halogen-substituted thiocarbonyls, has had extensive experimental6–14 and theoretical7,15–18 investi-gations. Cl2CS absorbs weakly in the visible region to pro-duce the lowest triplet 共T1兲 and lowest singlet 共S1兲 excited states, which correspond to symmetry-forbidden n→* transitions3 with band origins at 17 492 and 18 716 cm−1, respectively; the symbol * indicates antibonding orbitals. The second singlet excited state 共S2兲, corresponding to a
→* excitation, lies ⬃34 275 cm−1 above the ground elec-tronic state. Fluorescence from the S2state diminishes when the excitation energy is ⬃1450 cm−1 above the vibrational ground level because of predissociation.11,12
Three major channels for ultraviolet photodissociation of Cl2CS are expected,
Cl2CS→ ClCS + Cl, ⌬H0= 265 kJ mol−1, 共1兲
Cl2CS→ Cl2+ CS, ⌬H0= 240 kJ mol−1, 共2兲
Cl2CS→ 2 Cl + CS, ⌬H0= 479 kJ mol−1, 共3兲 in which experimental enthalpies of reaction are derived from enthalpies of formation共in kJ mol−1兲 at 0 K as follows: Cl: 119.6,19CS: 275± 4,20ClCS: 180± 4,6and Cl2CS: 35± 4; the value for Cl2CS was derived based on the bond energy
D0共SClC–Cl兲 of 265±4 kJ mol−1共Ref.6兲 and the enthalpies of formation of Cl and ClCS. Previous theoretical calcula-tions by Hachey et al. showed ⌬H=238 kJ mol−1 and ⌬H = 477 kJ mol−1 for reactions共2兲 and共3兲, respectively, and a barrier of ⬃299 kJ mol−1 for reaction共2兲.21
Photolysis at 248 nm 共⬃482 kJ mol−1兲 of Cl
2CS in a pulsed molecular beam yields Cl2 and ClCS, indicating the existence of channels 共1兲 and 共2兲; the branching ratio for reaction 共1兲 was determined to be 0.8± 0.1.13 The photodis-sociation dynamics at 235 nm were investigated with detec-tion of Cl共2P3/2兲 and Cl*共2P
1/2兲 by time-of-flight resonance-enhanced multiphoton ionization.14 The counter product, ClCS, was formed mostly in electronically excited states
A2A
⬙
and B2A⬘
; the percentage proportions of X, A, and B states of ClCS are 4:60:36 and 7.5:71.5:21 for associated atomic fragments Cl and Cl*, respectively. The photophysics and photochemistry of Cl2CS have been investigated with quantum-chemical calculations on the potential-energy sur-faces for dissociation of Cl2CS into ClCS + Cl in the first five excited electronic states according to a combined complete active space self-consistent field and multireference configu-ration interaction method.18Upon irradiation in the range of 235− 253 nm Cl2CS is excited to its S2 state, followed by direct dissociation to ClCS共A兲 and Cl 共2P3/2兲. Althoughex-perimental investigations on photodissociation dynamics of a兲Author to whom correspondence should be addressed. Fax:
886-3-5713491. Electronic mail: [email protected]
0021-9606/2007/126共17兲/174310/7/$23.00 126, 174310-1 © 2007 American Institute of Physics This article is copyrighted as indicated in the article. Reuse of AIP content is subject to the terms at: http://scitation.aip.org/termsconditions. Downloaded to IP:
Cl2CS involve mass spectrometry to probe ClCS, no direct spectral detection of gaseous ClCS has been previously re-ported.
Schallmoser et al. produced ClCS with a pulsed dis-charge jet of Cl2CS / Ar, CS2/ Cl2/ Ar, CS2/ CCl4/ Ar, and their isotopic variants, and deposited the gaseous mixture onto a cold substrate; they observed absorption lines at 1189.3 and 632.1 cm−1which they attributed to the
1共C–S stretching兲 and3共C–Cl stretching兲 modes of ClCS isolated in solid Ar.22Chan and Goddard predicted geometries, vibra-tional wave numbers, and energies of ClCS in the ground 共X2
A
⬘
兲 and first electronically excited states 共A2A⬙
兲 usingrestricted singles-and-doubles configuration-interaction 共RCISD/6-31G*兲 methods.23
Vibrational wave numbers of the X2A
⬙
state of ClCS are predicted to be1= 1314 cm−1,2 共ClCS bend兲=355 cm−1, and3= 699 cm−1; these values dif-fer by more than 10% from the values observed in matrix experiments.22
It is of interest to develop an infrared 共IR兲 detection technique to investigate further the photodissociation dynam-ics of Cl2CS and reaction kinetics involving ClCS. We have successfully coupled a step-scan Fourier-transform spec-trometer with a multipass absorption cell to record time-resolved infrared absorption spectra of reaction intermediates in the gaseous phase.24–27 Here we report an application of this technique to record transient IR absorption spectra of the intermediate ClCS upon photodissociation of Cl2CS.
II. EXPERIMENTS
A commercial step-scan spectrometer共Thermo Nicolet, Nexus 870兲 was employed for transient absorption measurements.26,27A White cell with an effective path length of 6.4 m共base path of 20 cm兲 and a volume of ⬃2000 cm3 served as the reactor and was placed in the sample compart-ment of the Fourier transform infrared共FTIR兲 spectrometer. Two rectangular共3⫻12 cm2兲 quartz windows on the sides of the White cell allow passage of the photolysis laser beam that propagates perpendicular to the multipassing IR beam. The laser beam is multiply reflected between a pair of exter-nal rectangular laser mirrors and passes these quartz win-dows and the White cell after each reflection. A KrF excimer laser共GAM Laser, EX100H/60兲 operated at 8 Hz with typi-cal output energy of⬃80 mJ pulse−1at 248 nm and a beam expanded by a telescope to a dimension ⬃4⫻1.5 cm2 was employed for photodissociation. The ac-coupled signal from the fast mercury cadmium telluride 共20 MHz兲 detector was further amplified 共Stanford Research Systems, Model SR560兲 20 times with a bandwidth 0.1–1000 kHz before being sent to the external 14 bit digitizer 共Gage Applied Technology, CompuScope 14100, 108samples s−1兲, whereas the dc-coupled signal was sent directly to the internal 16 bit digitizer 共2⫻105samples s−1兲 of the spectrometer. Tech-niques for obtaining time-resolved difference absorption spectra with a step-scan FTIR spectrometer are well established.24,28 The position of the moving mirror of FTIR was maintained to within ±0.2 nm at each step in the step-scan mode.29
Typically, 300 data points were acquired at 0.2s
inte-grated intervals 共20 dwells at 10 ns gate width兲 after each laser shot; the signal was typically averaged over 25 laser shots at each scan step. We utilized undersampling by em-ploying appropriate optical filters to define a small spectral region to decrease the number of points in the interferogram, hence the duration of data acquisition. For spectra in the range of 900– 1700 cm−1at a resolution of 4 cm−1, 552 scan steps were required, and the data acquisition lasted⬃40 min. For the spectral range 910– 1350 cm−1 at a resolution of 0.6 cm−1, 1656 scan steps were required, and the data acqui-sition lasted⬃80 min; in this case, the laser was triggered at 10 Hz and 16 acquisitions were averaged for each scan step. To improve further the ratio of signal to noise, we recorded and averaged four sets of data under similar experimental conditions.
A flowing mixture of Cl2CS / N2 or Cl2CS / CO2 with flow rates FCl2CS= 0.18– 0.22 cm3s−1, FN2⬵29.1 cm3s−1 or
FCO
2⬵14.4 cm
3s−1 at STP, and total pressure P
T
⬵43–52 Torr at 298 K was employed; STP states for stan-dard temperature of 273 K and pressure of 760 Torr. The efficiency of photolysis of Cl2CS is estimated to be⬃11% based on its absorption cross section ⬃8⫻10−18 cm2molecule−1 at 248 nm.30
Cl2CS共95%, Fluka Chemika兲 and N2 共99.9995%, AGA Specialty Gases兲 were used without further purification. CO2 共99.99%, AGA Specialty Gases兲 was purified by passing it through a trap with molecular sieve and a trap at 218 K.
III. THEORETICAL CALCULATIONS
The equilibrium geometry, vibrational wave numbers, and IR intensities were calculated with B3P86 and B3LYP density-functional theories using theGAUSSIAN 03program.31 The B3LYP method uses Becke’s three-parameter hybrid ex-change functional with a correlation functional of Lee, Yang, and Parr32,33 The B3P86 method uses Becke’s three-parameter hybrid exchange functional with Perdew’s gradient-corrected correlation functional.34 Dunning’s correlation-consistent polarized-valence triple-zeta basis set, augmented with s, p, d, and f functions 共aug-cc-pVTZ兲 共Refs.35and36兲, was applied in these calculations. Analytic
first derivatives were utilized in geometry optimization, and vibrational wave numbers were calculated analytically at each stationary point.
The calculated geometry, rotational parameters at the equilibrium geometry, vibrational wave numbers, and IR in-tensities of ClCS are compared with those of previous work-ers in Table I. The geometries predicted with various meth-ods are similar. The variations in geometry produce variations of rotational parameters less than 3% for the A parameter and 1% for the B and C parameters, as listed in TableI.
The greater C–S bond length共1.573 Å兲 calculated with B3LYP/aug-cc-pVTZ is consistent with a smaller wave num-ber共1212 cm−1兲 predicted for the C–S stretching 共1兲 mode, as compared with values1= 1314 cm−1and bond length of 1.565 Å predicted previously with RCISD/ 6 – 31G*.23 Pre-dictions of vibrational wave numbers using B3LYP/aug-cc-pVTZ are estimated to be accurate to within 3%, based on
174310-2 Chu, Han, and Lee J. Chem. Phys. 126, 174310共2007兲
results of similar molecules ClSO 共for the S–O stretch, cal-culated 1156.9 cm−1, gas phase 1162.9 cm−1兲 共Ref.26兲 and ClCO 共for the C–O stretch, calculated 1943.5 cm−1, gas phase 1884.6 cm−1兲.24
Hence, we expect that the vibrational wave number for the C–S stretching共1兲 and C–Cl stretching 共3兲 modes to be in the range of 1212±36 and 631±19 cm−1, respectively. The predicted values of1 and3are near the values of 1189 and 632.1 cm−1 reported for matrix-isolated ClCS. Predicted displacement vectors for the C–S stretching mode and the associated dipole derivative are shown in Fig.
1. Wave numbers predicted for Cl–C stretching and ClCS-bending modes are beyond our range of detection.
IV. EXPERIMENTAL RESULTS AND DISCUSSION Conventional cw absorption measurements were per-formed with a static cell containing 0.13 Torr of Cl2CS. The absorption of Cl2CS is characterized by an intense band near 1137 cm−1 共1, C–S stretch兲.37 Upon photolysis of the sample at 248 nm共80 mJ, 1 Hz兲 for 60 s, absorption of CS2 as the end product is clearly visible near 1529 cm−1.38 An-other band near 2089 cm−1is assigned to the CvS
stretch-ing mode 共兺u+兲 of C3S2.39 The mechanism for formation of C3S2will be discussed in the following section. No absorp-tion feature in the static-cell experiment is ascribable to un-stable species ClCS or CS.
In our previous experiments on ClSO,26we found that, at low pressure, the parent was highly internally excited upon laser irradiation, thus producing upward features on each side of the downward parent band in the difference spectrum; in this difference spectrum, features pointing upward indicate increase in concentration, whereas those pointing downward indicate decrease in concentration. We found that these two upward side lobes interfere with nearby absorption bands of dissociation products and hamper their detection. When pho-tolysis was conducted with a sample at high pressure, the upward side lobes diminished and the widths of downward parent features and upward features of product decreased be-cause of efficient relaxation. To quench the internal excita-tion of Cl2CS so as to avoid interference due to hot bands, and to stabilize ClCS, we added excessive N2or CO2in the system; the latter appears to be a more efficient quencher.
A. Spectra of ClCS
A representative three-dimensional plot of temporally re-solved survey difference spectra共resolution 4 cm−1兲 at 2s intervals upon laser irradiation at 248 nm of a flowing mix-ture of Cl2CS / N2 共⬵1/165, 43 Torr兲 is shown in Fig.2. In these difference spectra, features pointing upward indicate production; the downward feature in the range of 1100– 1150 cm−1 due to loss of Cl
2CS is not shown. Two new features near 1194 and 1285 cm−1 appear immediately after irradiation; the former decays with time much more rapidly than the latter. The band near 1285 cm−1 is readily assigned to CS,40 whereas the more intense feature near
TABLE I. Comparison of geometry, rotational parameters at equilibrium geometry, vibrational wave numbers, and infrared intensities of ClCS derived from theoretical calculations and experiments.
RCISD /6-31G*
B3P86 /aug-cc-pVTZ
B3LYP
/aug-cc-pVTZ Ar matrix Gas
rC–S共Å兲 1.565 1.569 关1.589兴a 1.573 关1.573兴a rC–Cl共Å兲 1.689 1.683 关1.683兴 1.697 关1.697兴 ⬔ClCS 共°兲 135.8 135.6 关135.6兴 135.3 关135.3兴 A共cm−1兲 4.4461 4.3983 关4.3825兴 4.3070 关4.2916兴 B共cm−1兲 0.1108 0.1113 关0.1083兴 0.1101 关0.1072兴 C共cm−1兲 0.1081 0.1085 关0.1057兴 0.1074 关0.1046兴 1共cm−1兲 1314 1245.0共294.1兲b 关1244.6兴 1212.4共289.4兲b 关1212.1兴 1189.3 1194.4 2共cm−1兲 355 332.7共1.2兲 关329.8兴 330.0共1.1兲 关327.0兴 3共cm−1兲 699 655.8共71.4兲 关650.5兴 630.6共79.2兲 关625.6兴 632.1
Reference 23 This work This work 22 This work
aParameters for37ClCS are listed in brackets; otherwise values are for35ClCS. bIR intensities共in km mol−1兲 are listed in parentheses.
FIG. 1. Rotational axes of ClCS, displacement vectors for the C–S stretch-ing共1兲 mode, and associated dipole derivative of ClCS predicted with the B3LYP/aug-cc-pVTZ method.
1194 cm−1is new. A third band near 1529 cm−1, attributed to CS2,38appears at a later time, indicating its association with secondary reactions.
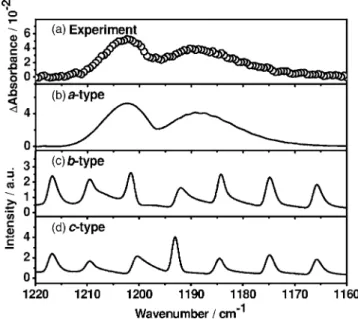
Transient absorption spectra in the region of 1160– 1220 cm−1 with an improved resolution of 0.6 cm−1 were recorded upon irradiation of a flowing mixture contain-ing Cl2CS / CO2 共1/65兲 at 52.3 Torr; the spectrum averaged over 0 – 20s after photolysis is shown in trace共a兲 of Fig.3. The P and R branches are clearly distinguishable, but no rotational structure is resolved.
The wave number of the approximate origin of this new feature, 1195 cm−1, is within the expected range of 1212± 36 cm−1 predicted with the B3LYP/aug-cc-pVTZ method and only slightly greater than the reported value of 1189.3 cm−1 for the C–S stretching mode of matrix-isolated ClCS.22 Considering that this feature appears immediately upon photolysis and decays rapidly due to the great reactivity of its carrier, and that the absorption band of another possible product CS is observed near 1285 cm−1, we tentatively as-sign this transient absorption to ClCS.
B. Simulation of the1absorption band of ClCS As derivation of rotational parameters from observed un-resolved spectra is impracticable, we simulate the band con-tour to compare with observed spectra. Rotational axes a and
b of ClCS are shown in Fig.1; the c axis is perpendicular to the molecular plane. Because the C–S stretching mode alters the dipole moment mainly along the a axis, absorption lines for transitions of a type are expected to be dominant.
The spectrum at 350 K was simulated 共SPECVIEW
program41兲 with rotational parameters A
⬙
, B⬙
, C⬙
, A⬘
, B⬘
, andC
⬘
derived from quantum-chemical calculations, Jmax= 120, and a Gaussian line shape with full width at half-maximum= 0.6 cm−1. Contributions from 37ClCS are included even though the 37Cl-isotopic shift for the C–S stretching mode is small with a shift of 0.3 cm−1 for the origin 共Table I兲 and
rotational parameters decreased by 0.4% 共A
⬙
兲, 2.7% 共B⬙
兲, and 2.6% 共C⬙
兲, as listed in Table II. Ratios of rotational parameters of the upper 共v1= 1兲 and the lower 共v=0兲 states 共A⬘
/ A⬙
, B⬘
/ B⬙
, and C⬘
/ C⬙
兲 are calculated to be 0.9727 共0.9722兲, 0.9956 共0.9958兲, and 0.9954 共0.9956兲 with B3LYP/ aug-cc-pVTZ 共B3P86/aug-cc-pVTZ兲; these ratios are nearly identical in both methods. Simulated a-type, b-type, andc-type bands are shown in traces 共b兲–共d兲 of Fig. 3, respec-tively. The a-type band agrees satisfactorily with experimen-tal observation shown in trace 共a兲, with most characteristic features reproduced. This agreement further supports our as-signment of this new feature to the C–S stretching mode of ClCS. The fitting yields a band origin at 1194.4 cm−1, near the value of 1189.3 cm−1reported for the C–S stretching共1兲 mode of matrix-isolated ClCS.22
C. Kinetic behavior of CS, ClCS, and CS2
One advantage of time-resolved Fourier-transform spec-troscopy is its multiplex detection; absorption bands of sev-eral species can be monitored concurrently, as illustrated in Fig. 2. The temporal profiles of bands of ClCS 共integrated over 1181– 1212 cm−1兲 and CS 共integrated over 1235– 1325 cm−1兲 are shown in Figs.4共a兲and4共b兲, respec-tively. Both bands appeared immediately upon photolysis and decayed rapidly with time. The temporal profile of the band due to CS2, integrated over 1470– 1550 cm−1 and shown in Fig. 4共c兲, indicated that this feature appeared at a later stage of reaction.
ClCS and CS are formed initially from direct photolysis,
FIG. 3. Comparison of observed and simulated absorption spectra of ClCS. 共a兲 spectrum at resolution of 0.6 cm−1 and integrated for 0 – 20s after 248 nm laser irradiation 共10 Hz, 80 mJ cm−2兲 of a flowing mixture of Cl2CS / CO2共1/65兲 at 52.3 Torr, 共b兲 Simulated a-type component based on rotational parameters predicted with B3LYP/aug-cc-pVTZ,共c兲 b-type com-ponent, and共d兲 c-type component.
FIG. 2. Time-resolved survey IR absorption spectra of a flowing mixture of Cl2CS / N2 upon photolysis at 248 nm共8 Hz, 80 mJ cm−2兲 displayed in a three-dimensional mode. The flowing mixture is Cl2CS / N2 共1/165兲 at 43 Torr. The path length is 6.4 m and resolution is 4 cm−1. Traces begin 1s after irradiation and are separated at 2s intervals.
174310-4 Chu, Han, and Lee J. Chem. Phys. 126, 174310共2007兲
Cl2CS→ ClCS共X兲 + Cl共2P3/2兲, ⌬H0= 265 kJ mol−1, 共4兲 Cl2CS→ Cl2共X1⌺g
+兲 + CS共X1⌺+兲,
⌬H0= 240 kJ mol−1. 共5兲 The energies of the A and B states of ClCS are greater than its ground state by only 77 and 178 kJ mol−1, respectively;21 hence ClCS was observed to be produced in its A and B states upon photolysis of Cl2CS at 235 nm.14Electronically excited ClCS is expected to relax to its X state within several nanoseconds via radiative processes. We are unable to detect the rapid rise associated with production of ClCS and CS. Subsequent decay of ClCS and CS and formation of CS2are results of secondary reactions. Possible secondary reactions include the following reactions involving ClCS and CS radi-cals and Cl atoms:
Cl + ClCS→ M Cl2CS, ⌬H0= − 265 kJ mol−1 共6a兲 →Cl2+ CS, ⌬H0= − 25 kJ mol−1, 共6b兲 Cl + CS→ M ClCS, ⌬H0= − 215 kJ mol−1, 共7兲 Cl + Cl→ M Cl2, ⌬H0= − 239 kJ mol−1, 共8兲 ClCS + ClCS→ Cl2CS + CS, ⌬H0= − 50 kJ mol−1, 共9兲 CS + CS→ M C2S2, ⌬H0= − 170 kJ mol−1. 共10兲 The exothermicity of reaction 共10兲 is taken from Talbi and Chandler.42The reaction
CS + ClCS→ CS2+ CCl, ⌬H0= 157 kJ mol−1, 共11兲 is excluded because of its large endothermicity; enthalpies of formation of CS2and CCl are 116± 1 and 480± 20 kJ mol−1, respectively.19 Reactions共6b兲 and共9兲 might be unimportant because of the small exothermicity and because a barrier is expected for the abstraction reaction.
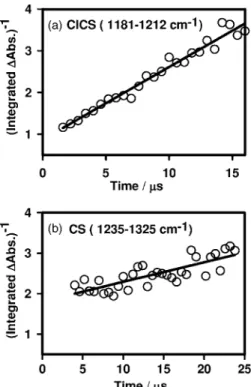
The complicated nature of the reaction mechanism and the lack of measurements of absolute concentrations of Cl, CS, and ClCS preclude accurate modeling of observed tem-poral profiles. As expected, a simple exponential decay func-tion fit poorly observed decay of ClCS, as shown with the solid line in Fig. 4共a兲. Based on our proposed mechanism, the consumption reaction of ClCS, mainly reaction 共6a兲, should follow roughly a decay of second-order assuming that initial concentrations of Cl and ClCS upon photolysis are nearly the same and the loss of Cl and ClCS are mainly due to this reaction. For a second-order reaction, the plot of 关ClCS兴−1 versus reaction period t is expected to yield a straight line; the fitting is satisfactory for the first 15s, as indicated in Fig. 5共a兲. The slope of this fitted line is 共1.81±0.04兲⫻105s−1. If we estimate the initial concentra-tions of Cl and ClCS to be ⬃9.2⫻1014molecules cm−3 based on absorption cross section of Cl2CS and laser fluence
TABLE II. Comparison of rotational parameters of35ClCS and37ClCS predicted with theoretical calculations using B3LYP and B3P86/aug-cc-pVTZ methods.
Parameters 35ClCS 37ClCS B3LYP /aug-cc-pVTZ B3P86 /aug-cc-pVTZ B3LYP /aug-cc-pVTZ B3P86 /aug-cc-pVTZ v = 0 A⬙共cm−1兲 4.356 1 4.457 9 4.339 7 4.441 0 B⬙共cm−1兲 0.109 73 0.110 89 0.106 81 0.107 94 C⬙共cm−1兲 0.106 79 0.107 96 0.104 01 0.105 16 v = 1 A⬘共cm−1兲 4.237 1 4.333 9 4.220 6 4.317 1 A⬘/ A⬙ 0.972 7 0.972 2 0.972 6 0.972 1 B⬘共cm−1兲 0.109 24 0.110 43 0.106 34 0.107 50 B⬘/ B⬙ 0.995 6 0.995 8 0.995 6 0.995 8 C⬘共cm−1兲 0.106 29 0.107 49 0.103 53 0.104 70 C⬘/ C⬙ 0.995 4 0.995 6 0.995 4 0.995 6
FIG. 4. Temporal profiles of共a兲 ClCS 共integrated over 1181–1212 cm−1兲, 共b兲 CS 共integrated over 1235–1325 cm−1兲, and 共c兲 CS
2 共integrated over 1470– 1550 cm−1兲 recorded upon 248 nm photolysis of a flowing mixture of Cl2CS / N2 共1/165兲 at 298 K and 43 Torr. Fitted results using first-order kinetics are represented with solid lines; see text.
at 248 nm, we estimated a rate coefficient k6+ 2k9⬵2.0 ⫻10−10cm3molecule−1s−1. Rate coefficients of k
6 and k9 have not been reported but are expected to be in the range of 10−11– 10−10cm3molecule−1s−1.
The loss of CS might be mainly due to reactions共7兲and
共10兲. At the initial stage, reaction 共7兲 is the most important because the initial concentration of Cl is greater than that of CS, which was initially produced via reaction 共2兲 with a branching ratio of 0.2± 0.1.13 However, the consumption of Cl atoms should be rapid according to reaction 共6a兲 dis-cussed in the previous paragraph. Hence, at the later stage, the temporal profile of CS should follow roughly second-order decay. The plot of 关CS兴−1 versus reaction period t yields a straight line with a slope of 共4.8±0.6兲⫻104s−1 in the range of 5 – 25s, as shown in Fig.5共b兲. However, we did not observe transient absorption of C2S2 at 1180 cm−1 partly because of its small concentration and partly because of overlap of this band with nearby absorption band of ClCS.43
A single exponential rise with a pseudo-first-order rate coefficient of共4.8±0.3兲⫻104s−1 fits satisfactorily observed generation of CS2, as shown in Fig.4共c兲. The generation of CS2might be due to the reaction of C2S2and CS,
C2S2+ CS→ C2S + CS2, ⌬H0= 47 kJ mol−1, 共12兲 in which enthalpies of formation of C2S at 0 K is 586 kJ mol−1;44
the small endothermicity may be compen-sated by the exothermicity of reaction共10兲. It is also possible that the reaction of CS + S also contributes to the formation of CS2; S atoms might be produced upon photolysis of S2Cl2, the most abundant impurity in the sample of Cl2CS. Further reaction of C2S, produced in reaction共12兲, with CS produces stable C3S2,43
C2S + CS→ C3S2. 共13兲
This might explain the observation of a small amount of C3S2 in the static-cell experiment; the IR absorption cross section of C3S2 at 2089 cm−1 is predicted to be 3160 km mol−1, five times greater than that of the C–S anti-symmetric stretching band of CS2at 1529 cm−1.
V. CONCLUSION
We demonstrate an application of the time-resolved Fourier-transform absorption technique to detect a transient absorption band at 1194.4 cm−1, ascribed to the C–S stretch-ing mode of ClCS produced upon photolysis of gaseous Cl2CS. The rotational contour of the observed spectrum con-forms satisfactorily to a simulated a-type spectrum based on rotational parameters predicted from quantum-chemical cal-culations; the vibrational wave number is consistent with that predicted for the C–S stretching mode of ClCS. The forma-tion and decay of ClCS, CS, and CS2were recorded, and the associated reaction mechanism is discussed.
ACKNOWLEDGMENTS
The authors thank V. Stakhursky and T. A. Miller for providing theSPECVIEWsoftware for spectral simulation, the National Center for High-Performance Computing of Taiwan for computer facilities, the National Science Council of Tai-wan 共Grant No. NSC95-2119-M-009-032兲, and the MOE-ATU Program for support.
1N. J. Turro, V. Ramamurthy, W. Cherry, and W. Farneth, Chem. Rev. 共Washington, D.C.兲 78, 125 共1978兲.
2R. P. Steer, Rev. Chem. Intermed. 4, 1共1981兲, and references therein. 3A. Maciejewski and R. P. Steer, Chem. Rev.共Washington, D.C.兲 93, 67
共1993兲, and references therein.
4D. J. Clouthier and D. C. Moule, Top. Curr. Chem. 150, 167共1989兲. 5H. Morrison, Y. Lu, and D. Carlson, J. Phys. Chem. A 102, 5421共1998兲. 6H. Okabe, J. Chem. Phys. 66, 2058共1977兲.
7D. C. Moule, I. R. Burling, H. Liu, and E. C. Lim, J. Chem. Phys. 111, 5027共1999兲.
8T. Fujiwara, D. C. Moule, and E. C. Lim, J. Phys. Chem. A 107, 10223 共2003兲.
9R. H. Judge and D. C. Moule, J. Mol. Spectrosc. 80, 363共1980兲. 10R. N. Dixon and C. M. Western, J. Mol. Spectrosc. 115, 74共1986兲. 11M. Ludwiczak, D. R. Latimer, and R. P. Steer, J. Mol. Spectrosc. 147,
414共1991兲.
12B. Simard, V. J. MacKenzie, P. A. Hackett, and R. P. Steer, Can. J. Chem. 72, 745共1994兲.
13G. S. Ondrey and R. Bersohn, J. Chem. Phys. 79, 175共1983兲. 14T. S. Einfeld, C. Maul, K.-H. Gericke, and A. Chichinin, J. Chem. Phys.
117, 1123共2002兲.
15A. Kapur, R. P. Steer, and P. G. Mezey, J. Chem. Phys. 70, 745共1979兲. 16B. Simard, A. E. Bruno, P. G. Mezey, and R. P. Steer, Chem. Phys. 103,
75共1986兲.
17B. Strickler and M. Gruebele, Chem. Phys. Lett. 349, 137共2001兲. 18L. Lin, F. Zhang, W.-J. Ding, W.-H. Fang, and R.-Z. Liu, J. Phys. Chem.
A 109, 554共2005兲.
19M. W. Chase, Jr., J. Phys. Chem. Ref. Data Monogr. 9, 1共1998兲. 20D. A. Prinslow and P. B. Armentrout, J. Chem. Phys. 94, 3563共1991兲. 21M. Hachey, F. Grein, and R. P. Steer, Can. J. Chem. 71, 112共1993兲. 22G. Schallmoser, B. E. Wurfel, A. Thoma, N. Caspary, and V. E.
Bondy-bey, Chem. Phys. Lett. 201, 528共1993兲.
23W.-T. Chan and J. D. Goddard, Chem. Phys. Lett. 173, 139共1990兲. 24S.-H. Chen, L.-K. Chu, Y.-J. Chen, I-C. Chen, and Y.-P. Lee, Chem. Phys.
Lett. 333, 365共2001兲.
25Y.-J. Chen, L.-K. Chu, S.-R. Lin, and Y.-P. Lee, J. Chem. Phys. 115, 6513共2001兲.
FIG. 5. Plots of共a兲 关ClCS兴−1and共b兲 关CS兴−1vs reaction period t recorded upon 248 nm photolysis of a flowing mixture of Cl2CS / N2 共1/165兲 at 298 K and 43 Torr. Fitted results are represented with solid lines; see text.
174310-6 Chu, Han, and Lee J. Chem. Phys. 126, 174310共2007兲
26L.-K. Chu, Y.-P. Lee, and E. Y. Jiang, J. Chem. Phys. 120, 3179共2004兲. 27L.-K. Chu and Y.-P. Lee, J. Chem. Phys. 124, 244301共2006兲. 28W. Uhmann, A. Becker, C. Taran, and F. Siebert, Appl. Spectrosc. 45,
390共1991兲.
29E. Y. Jiang, Spectroscopy共Eugene, Or.兲 17, 22 共2002兲.
30E. R. Farnsworth and G. W. King, J. Mol. Spectrosc. 46, 419共1973兲. 31M. J. Frisch, G. W. Trucks, H. B. Schlegel et al.,
GAUSSIAN 03, Revision A.7, Gaussian, Inc., Pittsburgh, PA, 1998.
32A. D. Becke, J. Chem. Phys. 98, 5648共1993兲.
33C. Lee, W. Yang, and R. G. Parr, Phys. Rev. B 37, 785共1988兲. 34J. P. Perdew, Phys. Rev. B 33, 8822共1986兲.
35T. H. Dunning, Jr., J. Chem. Phys. 90, 1007共1989兲.
36D. E. Woon and T. H. Dunning, Jr., J. Chem. Phys. 98, 1358共1993兲. 37T. Shimanouchi, J. Phys. Chem. Ref. Data 6, 993共1977兲.
38T. Shimanouchi, Tables of Molecular Vibrational Frequencies.
Consoli-dated Volume I共National Bureau of Standards, Gaithersburg, MD, 1972兲.
39Wm. H. Smith and G. E. Leroi, J. Chem. Phys. 45, 1778共1966兲. 40G. Herzberg, Molecular Spectra and Molecular Structure. I. Spectra of
Diatomic Molecules共Van Nostrand Reinhold, New York, 1950兲.
41V. Stakhursky, T. A. Miller, 56th OSU International Symposium on Mo-lecular Spectroscopy, Columbus, Ohio, 2001共unpublished兲;SPECTVIEW: Simulation and Fitting of Rotational Structure of Electronic and Vibronic Bands, http://www.chemistry.ohio-state.edu/⬃vstakhur
42D. Talbi and G. S. Chandler, J. Phys. Chem. A 104, 5872共2000兲. 43R. B. Bohn, Y. Hannachi, and L. Andrews, J. Am. Chem. Soc. 114, 6452
共1992兲.
44Y. H. Le Teuff, T. J. Millar, and A. J. Markwick, Astron. Astrophys., Suppl. Ser. 146, 157共2000兲.