Influence of Different Cleaning Conditions on Cleaning
Performance of Pilot-Scale Pulse-Jet Baghouse
Hsin-Chung Lu
1and Chuen-Jinn Tsai
2Abstract: In this study, a pilot-scale pulse-jet baghouse is utilized to control the particulate emission of an oil-fired boiler. The operating
and design parameters, such as filtration velocity, initial tank pressure, and nozzle diameter, were varied to evaluate the cleaning effect of the pulse-jet baghouse. Two different cleaning types,共1兲 high initial tank pressure and one bag cleaning; and 共2兲 low initial tank pressure and two consecutive bag cleanings, are used to compare the bag-cleaning performance in this study. It is found that the cleaning effect increases with the initial tank pressure. However, the cleaning intensity共overpressure兲 does not increase with the nozzle diameter. There exists an optimum nozzle diameter to achieve higher cleaning intensity and a better cleaning effect. This phenomenon results from the small volume of the baghouse compartment in this study. If an industrial size baghouse was used, it suggests that a nozzle diameter larger than 13 mm and initial tank pressure greater than 2.5 kg/cm2should be adopted to achieve a higher cleaning effect. Between the two cleaning types, type 2 is found to be more effective to clean the bag and the energy consumption for compressed air is reduced significantly from type 1. Therefore, type 2 bag cleaning is suggested to be a better method to clean the baghouse.
DOI: 10.1061/共ASCE兲0733-9372共2003兲129:9共811兲
CE Database subject headings:Emission control; Boilers; Pressures.
Introduction
Pulse-jet fabric filters are used widely for collecting fly ash from combustion sources because of their high air to cloth (A/C) ratio and low cost. When the pressure drop across the fabric bag is greater than a designated value in a pulse-jet baghouse, a short burst of compressed air is discharged from a nozzle into the filter bag to increase the pulse pressure within the bag. The sudden increase of pressure in the bag leads to the acceleration of the bag cloth and creation of reverse air flow through the bag, resulting in the removal of dust cake共Bakke 1974; Ravin et al. 1988兲; Morris et al. 1991. Pulse-jet baghouses for control of particulate emis-sions of coal- and oil-fired boilers are successfully applied throughout the world 共Dean and Cushing 1988; Blythe et al. 1991; Bustard et al. 1992兲. In this study, a pilot-scale baghouse is used to demonstrate the cleaning effect for an oil-fired boiler.
Some investigators 共Lanois and Wiktorsson 1982; Bustard et al. 1992兲 have compared the cleaning performance of three commonly used pulse-cleaning designs: low-共LP兲, intermediate-共IP兲, and high-pressure 共HP兲 baghouses. In the LP configuration, the tank pressure reaches approximately 12–30 psi 共83.7–206.7 kPa兲 and no Venturi injector is installed at the bag top. In the HP
configuration, a Venturi injector is installed at the bag top to in-duce secondary airflow. It was found that the LP system design without a Venturi injector requires lower cleaning energy for an equivalent cleaning efficiency.
Humphries and Madden共1983兲 found that particles will rede-posit on the bag after cleaning when on-line cleaning is utilized. This phenomenon reduces the bag-cleaning efficiency. Therefore, two cleaning types are used in this work: Type 1, in which the bag is cleaned only once at high initial tank pressure, and Type 2, in which the bag is cleaned twice in succession at low initial tank pressure. The cleaning effect and energy consumption are com-pared to search for the most suitable cleaning type.
The cleaning effects of a pulse-jet baghouse are greatly influ-enced by the design and operating parameters such as nozzle diameter, Venturi type, initial tank pressure, and filtration velocity 共Sievert and Lo¨ffler 1985; Morris et al. 1991; Lu and Tsai 1996兲. Therefore, the effects of filtration velocity, initial tank pressure, and nozzle size on the cleaning performance of the pulse jet are also investigated in this study.
Literature Review Filtration Performance
In the filtration process, the pressure drop is a common measure for evaluating the filtration performance. When the dust accumu-lates on the fabric to form a dust cake, the filter drag is described by the basic filtration equation共Donovan 1985兲
⌬p
vf ⫽Sf⫽SE⫹K2共
w⫺wR兲⫽SE⫹K2w0 (1)
⌬p⫽共SE⫹K2w0兲vf⫽Rfvf (2)
where⌬p⫽pressure drop across the filter bag;vf⫽filtration ve-locity; K2⫽specific resistance coefficient of the dust cake; Sf ⫽filter drag; SE⫽effective drag; w⫽mass areal density of the 1Dept. of Environmental Engineering, Hungkuang University, 34,
Chung-Chie Rd., 433 Sha-Lu, Taichung, Taiwan共corresponding author兲. E-mail: hclu@sunrise.hk.edu.tw
2Institute of Environmental Engineering, National Chiao Tung University, No. 75, Poai Street, 300 Hsin Chu, Taiwan. E-mail: cjtsai@cc.nctu.edu.tw
Note. Associate Editor: Mark J. Rood. Discussion open until February 1, 2004. Separate discussions must be submitted for individual papers. To extend the closing date by one month, a written request must be filed with the ASCE Managing Editor. The manuscript for this paper was submitted for review and possible publication on March 19, 2002; approved on October 18, 2002. This paper is part of the Journal of Environmental Engineering, Vol. 129, No. 9, September 1, 2003. ©ASCE, ISSN 0733-9372/2003/9-811– 818/$18.00.
dust cake; wR⫽residual dust areal mass density; w0⫽just the dust mass areal density added during the filtration cycle rather than the total mass areal density; and Rf⫽filter’s final resistance coeffi-cient.
Dennis and Klemm共1980兲 proposed that the filter drag for a single pulse-jet unit be described by the relationship
Sf⫽SE⫹共K2兲cwc⫹K2w0 (3) The new term added in Eq.共3兲 is (K2)cwc, which represents the drag contribution of the cycling portion of the dust mass areal density on the fabric, where (K2)c⫽specific resistance coefficient for the cycling fraction of the total dust mass areal density that is alternately dislodged and redeposited on the fabric; and wc ⫽cycling portion of the dislodgeable dust mass areal density.
Dennis et al.共1981兲 rewrote Eq. 共3兲 as ⌬p⫽共pE兲⌬w⫹K2w0vf⫽共pE兲⌬w⫹CK2vf
2⌬t⫽R
fvf (4) where the areal density of freshly added dust, w0, during the filtration interval ⌬t is expressed as Cvf⌬t. C is the dust inlet concentration. The variable ( pE)⌬w is defined as the effective re-sidual pressure loss. ( pE)⌬wcan be obtained from the intercept of a linear extrapolation of the pressure-time curve on the pressure axis. The slope of the pressure-time curve equals CK2vf2, and K2 is easily obtained from the slope when the inlet dust concentration and filtration velocity are constant. The similarity between Eq.共4兲 and the basic filtration equation关Eq. 共2兲兴 is obvious and, in the limit of negligible wc, Eq. 共4兲 becomes identical to the basic filtration equation. However, Eq. 共4兲 can be applied to on-line pulse-jet filtration.
When the filtration process reaches a steady state, the effective residual pressure loss and specific resistance coefficient of the dust cake will remain constant 共Dennis and Hovis 1984兲. For constant filtration velocity and inlet dust concentration, a lower effective residual pressure loss represents a longer filtration time and a better cleaning effect. The magnitude of ( pE)⌬wis related to the cleaning energy. In this study, the effective residual pressure loss is used as an index to evaluate the bag-cleaning effect. Effects of Bag-Cleaning Parameters
Many different bag-cleaning parameters such as pressure impulse, peak pressure, pulse overpressure, and fabric acceleration in the fabric bag have been claimed to be responsible for dust cake release by different investigators共Dennis et al. 1981; Ellenbecker and Leith 1981; Humphries and Madden 1983兲.
When the pressure drop exceeds a preset value, the dust cake must be removed by pulse-jet cleaning. A critical pulse-jet clean-ing energy exists beyond which bag cleanclean-ing improves only slightly. Dennis et al. 共1981兲 predicted that an acceleration of 200g is required to achieve complete dust dislodgment during pulse-jet cleaning. However, Morris’s experiment共1984兲 demon-strated that the pulse-jet fabric system can operate steadily when the acceleration ranges from only 30g – 60g. From Bustard et al.’s observation共1992兲, an acceleration of 100g – 200g is nec-essary to dislodge dust effectively. Kligel and Lo¨ffler 共1983兲 pointed out that when the air pressure impulse in the fabric bag is greater than 50 Pa•s, dust removal efficiency does not increase further. The pressure impulse 共PI兲 is defined as the integral of pressure versus time over a pulse duration, or PI⫽兰0Tpd
p(t)dt (Tpd⫽pulse duration兲. Humphries and Madden 共1983兲 found that there is a minimum pulse pressure of about 0.3 kPa in the fabric bag that removes about 60% of the dust cake. Increasing the pulse pressure beyond this minimum value results in only a slight
in-crease in the amount of dust dislodged. Sievert and Lo¨ffler共1989兲 also showed that it is necessary to reach a critical static overpres-sure of 400–500 Pa at all locations along the length of a bag in order to achieve a good fabric cleaning efficiency. The overpres-sure is defined as the pulse presoverpres-sure inside the bag minus the pulse pressure outside the bag. For fly-ash particles, Lu and Tsai 共1998兲 found that the critical cleaning average pulse overpressure is 500– 600 Pa.
In this study, the peak pulse overpressure, average pulse over-pressure, and pressure impulse are used as indices of cleaning intensity to evaluate the pulse-jet cleaning effect.
Experimental Method
A schematic diagram of the pilot-scale pulse-jet baghouse for testing the performance of filtration and bag cleaning is shown in Fig. 1. The system consists of a compressed air reservoir, dia-phragm valves, air blow tubes, nozzles, fan, baghouse compart-ment, and air cooler. The compressed air tank volume was 0.08 m3, and the blow tube diameter was 8.3 cm. In this work, no Venturi injectors were used in the baghouse. Inside the baghouse compartment, two 1.5-m-long and 130-mm-diameter fabric bags made of polyester with acrylic coating were installed. The bags were supported by cylindrical cages. The volume of the compart-ment was 0.54 m3. A flow rate control device including an orifice, a pressure transducer 共Model R22-01505, MODUS Instruments, Inc.兲, and a control valve was set downstream of the baghouse to measure the air flow rate during filtration and maintain a constant filtration velocity for each test. The dust of an oil-fired boiler was fed into the baghouse from the boiler through the air cooler. The sulfur content of the oil is about 0.5% by weight. The temperature of the airflow containing dust at the boiler outlet plenum was about 150°C. The temperature and relative humidity of waste gas inside the baghouse were 68 –73°C and 78 – 86%, respectively. The dust mass concentration inside the compartment was deter-mined by a filter holder during filtration. The mass median aero-dynamic diameter 共MMAD兲 and geometric standard deviation (g) of emission dust from the oil-fired boiler inside the compart-ment were measured using a multiorifice uniform deposition im-pactor 共MOUDI兲 cascade impactor 共Model 100, MSP Inc., St Paul, Minn.兲 to be 1.3 m and 2.2, respectively. The MOUDI was not connected directly to the stack. A sample tube with heating belt was inserted into the compartment of the baghouse and con-nected to the MOUDI. The sampling tube was heated to avoid the water vapor condensing inside the sampling tube and MOUDI.
During filtration, the pressure drop⌬p across the bag and the volume flow rate Qf were measured continuously. The pressure drop versus time curve can be used to determine the effective residual pressure loss (⌬PE)⌬w, and the specific resistance coef-ficient K2of the dust cake. After attaining a pressure drop of 4 in. H2O 共996 Pa兲, the diaphragm valve opened and the compressed air was injected into the bag from the nozzle to remove the dust accumulated on the bag. The dislodged dust dropped into the hopper and was removed by the rotary valve. The filtration veloc-ity, initial tank pressure, and nozzle diameter were varied for the pulse-jet cleaning system to obtain different operating conditions. In order to determine the cleaning conditions inside the bag when the compressed air was released, it is necessary to measure the pulse pressure at various positions along the bag head. For this reason, high-frequency pressure transducers共Model R22-01505, MODUS Instruments, Inc., Clinton, Mass.兲 were installed on the bag. The pulse pressure was measured at three positions located at
20, 100, and 140 cm from the bag opening. The pulse pressure was recorded by computer during the bag-cleaning period.
All tests were performed at a constant filtration velocity. When the pressure drop across the fabric reached 4 in. H2O共996 Pa兲, the bag cleaning was initiated and the pulse pressure inside and outside the bag were recorded by the pressure transducers. Before the pilot-scale test, the baghouse was set to run for about 50 h. The design and operation conditions are shown in Table 1.
Results and Discussion
Filtration Curve of Pilot-Scale Test
The filtration cycle of the long-term test is shown in Fig. 2. The operation conditions are ptk0⫽2 – 6 kg/cm2, vf⫽4.0 cm/s, and
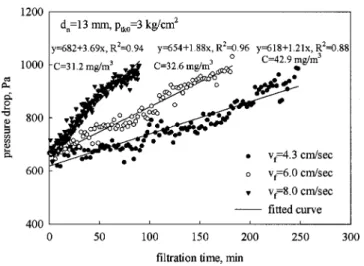
dn⫽13 mm. It is found that the baghouse works well in this study. The specific dust cake resistance coefficient K2 can be obtained from this filtration curve by fitting the linear portion of the data from Eq. 共2兲, and the effective residual pressure loss ( PE)⌬wcan be obtained from the intercept of the linear portion of the curve. Fig. 3 shows the linear portion of the filtration curve when the baghouse operates at dn⫽13 mm, ptk0⫽3.0 kg/cm2, vf⫽4.3, 6.0, and 8.0 cm/s, respectively. The calculated K2values are 5.13, 4.45, and 4.17 N•min/g•m 共307,888, 267,479, and Fig. 1.Schematic diagram of pilot-scale pulse-jet baghouse
Table 1. Design and Operation Parameters of Pulse-Jet Baghouse Used in this Study
Parameter Value
Design and operation parameters
Number of bags 4
Bag length 1.5 m
Bag diameter 130 mm
Bag fabric Polyester with acrylic coating
Ventury No Venturi
Number of nozzles 4
Nozzle diameter dn 8, 13, and 20 mm
Distance between nozzle and venturi S
72 mm Filter operating condition
Temperature of waste gas 68 –73°C Relative humidity of waste gas 78 – 86%
Dust Emission dust of oil-fired boiler,
MMADⱌ1.3 m,g⫽2.2
Filtration velocityvf 4 – 8 cm/s Inlet dust concentration C 30.2–53.7 mg/m3
Cleaning pulse duration Tpd 300 ms
Initial tank pressureptk0 1.0– 6.0 kg/cm2 Fig. 2. Filtration cycle of long-term test
250,200 s⫺1兲, respectively. Similar experimental data were ob-tained for different initial tank pressures for the bag cleaning.
The relationship between K2 and filtration velocity obtained from filtration at dn⫽13 mm is
K2 共s⫺1兲⫽1.53⫻105V0.33 (5) for the emission dust of an oil-fired boiler (MMAD⫽1.3 m) where the units of K2 and V are s⫺1and cm/s, respectively.
The curve of Eq.共5兲 can be represented by Kˆ2⫽aVb, and the number of samples is n⫽8. If we take the logarithms of both sides of Eq.共5兲, it becomes
log共Kˆ2兲⫽log a⫹b log V (6) The equation can be rewritten as Yˆ⫽ˆ0⫹ˆ1X, where Yˆ ⫽log(Kˆ2), ˆ0⫽log a, and ˆ1⫽b. The slope (ˆ1) and intercept (ˆ0) of the regression line can be obtained by the method of least squares.
The confidence intervals of the regression line are desired. For a straight-line regression, the corresponding confidence interval forY兩X0, the expected value of Y at X0is given by the formula 共Kleinbaum et al. 1988兲 YX0⫾tn⫺2,1⫺␣/2SYˆ X0 (7) SYˆ X0⫽SY兩X
冑
1/n⫹共X0⫺X¯兲 2/共n⫺1兲S X 2 (8)where YX0⫽ˆ0⫹ˆ1X0⫽predicted value of Y at X0; SYˆX
0
⫽estimate of the standard deviation of YX0; SY兩X⫽estimate of variance of Y; X¯⫽average of X; and SX2⫽variance of X.
Fig. 4.Relationship between filtration velocity and K2
Fig. 5. Influence of initial tank pressure and nozzle diameter on average pulse overpressure and pulse pressure inside bag
Fig. 6.Pulse pressures inside and outside bag during bag cleaning at
ptk0⫽3 kg/cm2and dn⫽ (a) 13, 共b兲 20 mm. Fig. 3. Linear portion of filtration curve for filtration velocity when
baghouse operates at dn⫽13 mm, ptk0⫽3.0 kg/cm2
By using the previous formulas, the fitted curve and 95% con-fidence intervals of the K2 value are shown in Fig. 4. In a previ-ous study of a pilot-scale pulse-jet baghprevi-ouse共Tsai et al. 2000兲, the relationship between K2 and filtration velocity for fly ash of a coal-fired boiler and limestone were described as
K2 共s⫺1兲⫽2.24⫻105V0.66,
fly ash of coal-fired boiler 共MMAD⫽6.0 m兲 K2 共s⫺1兲⫽4.75⫻105V0.44, limestone 共MMAD⫽2.6 m兲 The K2values reported previously are compared with the con-fidence intervals of the K2value of this work. For example, the K2 values of fly ash of a coal-fired boiler and limestone at V ⫽4 and 6 cm/s are 559,252, 874,178 and 730,850, 1,044,913 s⫺1 关calculated from the regression curve of Tsai et al. 共2000兲兴, re-spectively. For␣⫽0.05, the corresponding 95% confidence inter-vals of K2values at V⫽4 and 6 cm/s are 共234,250,249,225兲 and 共268,910,283,279兲, respectively. It is found that the K2values of previous work are outside the 95% confidence interval bands; therefore the K2 value of this work is different from the values reported previously.
It is seen that the influence of filtration velocity on the specific cake resistance coefficient for larger particles is larger than for smaller particles. Previous research also pointed out that the K2 value will increase by about 20% when the filtration velocity increases from 5 to 12 cm/s共Ellenbenbecker and Leith 1981兲. The higher filtration velocity also makes the baghouse blind easily. Therefore, the filtration velocity of 4 cm/s is used in the following discussion.
Influence of Initial Tank Pressure and Nozzle Diameter on Bag Cleaning
Fig. 5 shows the influence of initial tank pressure and nozzle diameter for bag cleaning on average pulse overpressure povand average pulse pressure inside the bag, pin. The pinfor bag clean-ing is the absolute pressure inside the bag and results from the burst of high-pressure compressed air from the compressed air reservoir. The average overpressure is the driving force for bag cleaning, which is defined as the average of the pulse pressure inside the bag minus the pulse pressure outside the bag. It is seen that both the average pulse overpressure and the pulse pressure
inside the bag increase with the initial tank pressure. The relation-ships between the average pulse overpressure and pinand initial tank pressure are almost linear. Therefore, increasing the initial tank pressure is the most convenient way to increase the cleaning effect.
It is also found from this figure that the average pulse pressure increases with the nozzle diameter, since a larger nozzle diameter will discharge more compressed air. However, the average pulse overpressure does not show this trend, so there exists an optimal nozzle diameter 共13 mm兲 to achieve the higher pulse overpres-sure. This phenomenon can be explained by Fig. 6, which shows the pulse pressures inside and outside the bag at ptk0 ⫽3 kg/cm2, the difference being the pulse overpressure. It is seen from Figs. 6共a and b兲 that the pulse pressure outside the bag is very large for dn⫽20 mm and results in lower pulse overpressure. In this study, the volume of the baghouse compartment is about 0.54 m3. The suction flow rate of waste gas by the fan is 5.9 m3/min. When an initial tank pressure of 3 kg/cm2is used, the discharged mass flow of compressed air from the nozzle can be computed by共Kayser and Shambaugh 1991兲
M˙isen⫽Aptk0
冋
␥MW RgT冉
2 ␥⫹1冊
共␥⫹1兲/共␥⫺1兲册
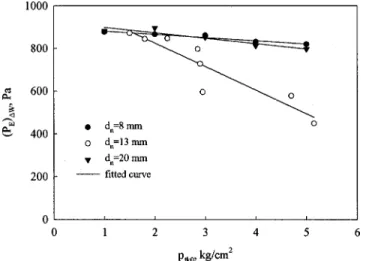
1/2 , pcom/ ptk0⬍ (9) where M˙isen⫽isentropic, adiabatic mass flow rate of discharge compressed air; A⫽area of the nozzle; pcom⫽pressure inside theFig. 7. Influence of initial tank pressure on effective residual pressure loss for different nozzle diameters
Fig. 8.Effects of共a兲 pressure impulse on cleaning effect for different nozzle diameters;共b兲 maximum and average pulse overpressure on cleaning effect for different nozzle diameters
compartment just before bag cleaning; MW⫽molecular weight of air; Rg⫽universal gas constant 8,314 J/kgmol•K; ␥⫽heat capac-ity ratio; and ⫽pressure ratio 0.528. When the ratio of pcom/ ptk0⬍0.528, the gas velocity at the nozzle becomes sonic.
From Eq. 共9兲, the discharge mass flow rate of air from the nozzle can be calculated, and the volume flow rate of cleaning air at standard temperature and pressure 共STP兲 can also be calcu-lated. The calculated mass flow of compressed air from four nozzles during the cleaning period for dn⫽20, 13, and 8 mm is about 1.19, 0.50, and 0.19 kg/s, respectively. The volume flow rates at STP are about 0.99共59.4兲, 0.41 共24.6兲, and 0.16 m3/s共9.6 m3/min兲 for dn⫽20, 13, and 8 mm, respectively. Therefore, the suction flow rate共5.9 m3/min兲 cannot release the cleaning airflow immediately. The excess airflow accumulates inside the compart-ment共outside the bag兲. The small compartment volume 共0.54 m3兲 results in the excess air volume being converted to static pressure. This phenomenon causes the pulse pressure outside the bag for dn⫽20 mm to be significantly larger than that for dn⫽13 mm. Therefore, there must exist an optimal nozzle diameter to make the pulse overpressure achieve a maximum value in this study. A nozzle diameter of 13 mm can reach the maximum overpressure in this study. However, a larger compartment volume can reduce the conversion of excess airflow to pulse pressure outside the bag. Then the pulse overpressure will increase with the nozzle diam-eter.
Relationships between Index of Cleaning Effect and Cleaning Intensities
The effective residual pressure loss is used as an index of the cleaning effect and the average, maximum overpressure and pres-sure impulse inside the bag are recognized as the cleaning inten-sity in this study. Fig. 7 shows the influence of initial tank pres-sure on the effective residual prespres-sure loss for different nozzle diameters. It is found that the bag-cleaning effect is best for dn ⫽13 mm since the pulse overpressure for dn⫽13 mm is maxi-mum. The next best value is for dn⫽20 mm, and the minimum value is for dn⫽8 mm. Therefore, the cleaning effect seems to increase with pulse overpressure.
Figs. 8共a and b兲 show the effects of pressure impulse and maximum and average pulse overpressure on the cleaning effect for different nozzle diameters. Figs. 8共a and b兲 display that the cleaning effect increases with pressure impulse and average and maximum pulse overpressure. It is seen from Fig. 8共a兲 that there seems to exist a critical pressure impulse at about 800 Pa•s. When the pressure impulse is greater than 800 Pa•s, the cleaning effect increases only slightly. This value is much larger than the result of Klingel and Lo¨ffler共1983兲 共50 Pa•s兲. Fig. 8共b兲 also shows a simi-lar phenomenon. The critical average and maximum pulse over-pressure are about 2 and 4 kPa, respectively. This is also much greater than the values of 400–500 Pa共Sievert and Lo¨ffler 1989兲 and 500– 600 Pa 共Lu and Tsai 1998兲. The reason for this is the high relative humidity and small particle size of dust particles in this study. When relative humidity is high and particle size is small, particles will adhere tightly to the bag and a higher clean-ing force is needed to clean the dust cake.
Suggested Nozzle Diameter for Industrial Size Baghouse
In this work, the size of the pilot-scale baghouse is quite small 共the compartment volume is 0.54 m3兲. Therefore, the cleaning air accumulates inside the compartment共outside the bag兲 and is con-verted to static pressure. This phenomenon makes the pulse over-pressure共pulse pressure inside the bag minus pulse pressure out-side the bag兲 maximum at dn⫽13 mm. However, if the compartment volume increases to industrial size, the cleaning air will be released inside the compartment and the pulse pressure outside the bag will be reduced and approach zero. Therefore, the pulse overpressure will increase with the pulse pressure inside the bag. It is seen that the pulse pressure inside the bag increases with the nozzle diameter共see Fig. 5兲. Thus, the pulse overpressure and cleaning effect will increase with the nozzle diameter for an in-dustrial size baghouse. From Fig. 8共b兲, it is seen that the cleaning effect increases only slightly when the pulse overpressure is larger than 2 kPa. If we assume the pulse pressure outside the bag will be reduced to zero for an industrial size baghouse, then the pulse overpressure will equal the pulse pressure inside the bag. From Fig. 5, the pulse pressure inside the bag can achieve 2 kPa for dn⫽13 mm at ptk0⫽2.2 kg/cm2 and dn⫽20 mm at ptk0 ⫽1.6 kg/cm2. The maximum pulse pressure inside the bag achieves only 1.4 kPa for dn⫽8 mm at ptk0⫽5 kg/cm2. There-fore, it is suggested that the smallest nozzle diameter should be larger than 13 mm for an industrial size filter. However, the pulse pressure depends on the nozzle diameter and initial tank pressure. We suggest that dn⬎13 mm and ptk0⬎2.5 kg/cm2 can be adopted for an industrial size filter.
Fig. 9. Filtration curves for two operating conditions: dn⫽ (a) 8
and共b兲 20 mm
Comparison of Cleaning Effect for Two Different Cleaning Types
It is found from the previous discussion that increasing the initial tank pressure is the most convenient way to increase the cleaning effect. However, the energy consumption of compressed air is also larger for higher initial tank pressure. Therefore, two operat-ing conditions for bag cleanoperat-ing are compared in this study: Type 1, where bag cleaning occurs once at high initial tank pressure, and type 2, where bag cleaning occurs twice at low initial tank pressure. The time between the two sequential pulses is about 5–10 s for type 2 bag cleaning. The filtration curves for the two operating conditions are shown in Figs. 9共a and b兲 for dn⫽8 and 20 mm, respectively. From the figures, it is found that the type 2 operating condition at low initial tank pressure can achieve a lower baghouse pressure drop after cleaning than type 1 operation at high initial tank pressure. The reason is that the first cleaning for type 2 will loosen particles adhered on the bag and the second cleaning will pulse the dust away from the bag. Therefore, the type 2 operating condition is much more effective for bag clean-ing than type 1. Table 2 displays the energy consumption and pressure drop after cleaning for the two bag-cleaning conditions. It is found that the type 2 operating condition at low initial tank pressure ( ptk0⫽1 and 2 kg/cm2兲 can obtain a lower pressure drop and energy consumption than type 1 at high initial tank pressure ( ptk0⫽4 and 5 kg/cm2兲. Therefore, the type 2 operating condition can achieve a better cleaning effect with less energy consumption of compressed air.
Conclusions
A pilot-scale pulse-jet baghouse was used to control the particu-late emission of an oil-fired boiler. Different filtration velocities, initial tank pressures, and nozzle diameters were chosen to evalu-ate the cleaning effect of the pulse-jet baghouse. In addition, two different cleaning conditions were used to compare the bag-cleaning performance in this study.
It is found that increasing the initial tank pressure is a conve-nient way to increase the cleaning effect. However, the pulse overpressure inside the bag does not increase with the nozzle diameter. There exists an optimum nozzle diameter to achieve higher cleaning intensity and better cleaning effect in this work. This phenomenon results from the larger excess air in the com-partment for larger nozzle diameter; the small volume of the bag-house compartment converts the excess airflow to static pressure. Thus the overpressure cannot increase with the nozzle diameter. If an industrial size baghouse is used, the experimental data of this work suggest that a nozzle diameter larger than 13 mm and initial
tank pressure greater than 2.5 kg/cm2 should be adopted to achieve a higher cleaning effect. Between the two cleaning con-ditions, the type 2 operating condition can achieve a better clean-ing effect with less energy consumption of compressed air than type 1. Therefore, bag-cleaning type 2 is suggested to be a better method to apply in bag cleaning for the pulse-jet baghouse.
Acknowledgment
The writers would like to thank the National Science Council of China for financial support共Grant No. NSC-89-EPA-Z-241-001兲.
Notation
The following symbols are used in this paper: A ⫽ area of nozzle 共m2兲;
C ⫽ dust concentration 共mg/m3兲;
dn ⫽ nozzle diameter for bag cleaning 共mm兲;
K2 ⫽ specific resistance coefficient of dust cake 共s⫺1兲; M˙isen ⫽ isentropic, adiabatic mass flow rate of discharge
compressed air共kg/s兲;
MW ⫽ molecular weight of air 共kg/kgmol兲;
pcom ⫽ pressure inside compartment just before bag cleaning共Pa兲;
( pE)⌬w⫽ effective residual pressure loss 共Pa兲;
pin ⫽ average pulse pressure inside bag 共Pa兲; pov ⫽ average pulse overpressure 共Pa兲;
ptk0 ⫽ initial tank pressure for bag cleaning 共kg/cm2兲;
Rf ⫽ filter’s final resistance coefficient 共Pa•s/cm兲;
Rg ⫽ universal gas constant 8,314 J/kgmol•K;
SE ⫽ effective drag of residual dust 共Pa•s/cm兲;
Sf ⫽ filter drag 共Pa•s/cm兲; SX2 ⫽ variance of X;
SY兩X ⫽ estimate of variance of Y; SYˆX
0 ⫽ estimate of standard deviation of YX0;
t ⫽ filtration time 共min兲; vf ⫽ filtration velocity 共cm/s兲;
W ⫽ mass areal density of dust cake 共g/cm2兲; WR ⫽ residual dust areal density 共g/cm2兲;
W0 ⫽ freshly accumulated dust areal density after cleaning cycle共g/cm2兲;
X ⫽ independent variable of straight line; X
¯ ⫽ average of X;
Y ⫽ dependent variable of straight line; YX0 ⫽ predicted value of Y at X0; Table 2. Effective Residual Pressure Loss and Energy Consumption of Bag Cleaning for different Bag-Cleaning Types
Cleaning type
dn⫽8 mm dn⫽20 mm
Energy consumption
共kJ兲
Pressure drop after cleaning
共Pa兲
Energy consumption
共kJ兲
Pressure drop after cleaning
共Pa兲 ptk0⫽1.0 kg/cm2, one cleaning 4.0 876.5 8.1 881.5 ptk0⫽1.0 kg/cm2, two cleanings 8.1 530.4 16.1 480.6 ptk0⫽2.0 kg/cm2, one cleaning 5.7 866.5 16.2 781.9 ptk0⫽2.0 kg/cm2, two cleanings 11.4 602.6 32.4 490.5 ptk0⫽3.0 kg/cm2, one cleaning 7.3 861.5 20.3 811.7 ptk0⫽4.0 kg/cm2, one cleaning 8.9 831.7 24.3 769.4 ptk0⫽5.0 kg/cm2, one cleaning 11.3 819.2 29.2 747.0
ˆ0 ⫽ estimated intercept of regression line; ˆ1 ⫽ estimated slope of regression line;
␥ ⫽ heat capacity ratio;
⌬p ⫽ filtration pressure drop 共Pa兲; and ⫽ pressure ratio 0.528.
References
Bakke, E.共1974兲. ‘‘Optimizing filtration parameters.’’ J. Air Pollut. Con-trol Assoc., 24, 1150–1154.
Blythe, G. M., Petersen, J. R., Burnette, A. D., and Rhudy, R. G.共1991兲. ‘‘Results of spray dryer/pulse-jet fabric filter pilot unit tests at the EPRI high sulfur test center.’’ Proc., 1991 SO2 Control Symp., Elec-tric Power Research Institute, Washington, D.C.
Bustard, C. J., Cushing, K. M., and Chang, R. L.共1992兲. ‘‘The potential of jet baghouse for utility boilers. Part 2: Performance of pulse-jet fabric filter pilot plants.’’ J. Air Waste Manage. Assoc., 42, 1240– 1249.
Dean, A. H., and Cushing, K. M.共1988兲. ‘‘Survey on the use of pulse-jet fabric filters.’’ J. Air Pollut. Control Assoc., 38, 90–96.
Dennis, D., and Hovis, L. S.共1984兲. ‘‘Pulse-jet filtration theory: A state of the art assessment.’’ Proc., 4th Symp. on the Transfer and Utilization of Particulate Control Technology, Rep. No. EPA-600/9-84-025a, U.S. EPA, Houston, 22–36.
Dennis, D., and Klemm, H. A.共1980兲. ‘‘Modeling concepts for pulse-jet filtration.’’ J. Air Pollut. Control Assoc., 30, 38 – 43.
Dennis, R., Wilder, J. E., and Harmon, D. L.共1981兲. ‘‘Predicting pressure loss for pulse jet filters.’’ J. Air Pollut. Control Assoc., 31, 987–992. Donovan, R. P.共1985兲. Fabric filtration for combustion source:
Funda-mental and basic technology, Marcel Dekker, New York.
Ellenbecker, M. J., and Leith, D.共1981兲. ‘‘Dust removal from non-woven fabric-cleaning methods needs to be improved.’’ Filtr. Sep., 18, 41– 45.
Humphries, W., and Madden, J. J.共1983兲. ‘‘Fabric filtration for coal-fired
boilers: Dust dislodgment in pulse jet filters.’’ Filtr. Sep., 20, 40– 44. Kayser, H. C., and Shambaugh, R. T.共1991兲. ‘‘Discharge coefficients for compressible flow through small-diameter orifices and convergent nozzles.’’ Chem. Eng. Sci., 46, 1697–1711.
Kleinbaum, D. G., Kupper, L. L., and Muller, K. E. 共1988兲. Applied regression analysis and other multivariable methods, PWS-KENT, Boston.
Klingel, R., and Lo¨ffler, F. 共1983兲. ‘‘Influence of cleaning intensity on pressure drop and residual dust areal density in a pulse-jet fabric filter.’’ Proc., Filtech Conf., London, 306 –314.
Lanois, G. D., and Wiktorsson, A. 共1982兲. ‘‘Current status and future potential for high-ratio fabric filter technology applied to utility coal-fired boilers.’’ Proc., 1st Conf. on Fabric Filter Technology for Coal-Fired Power Plants, EPRI, Denver, 4-125– 4-154.
Lu, H. C., and Tsai, C. J.共1996兲. ‘‘Numerical and experimental study of cleaning process of a pulse-jet fabric filtration system.’’ Environ. Sci. Technol., 30, 3243–3249.
Lu, H. C., and Tsai, C. J.共1998兲. ‘‘A pilot-scale study of the design and operation parameters of a pulse-jet baghouse.’’ Aerosol Sci. Technol., 29, 510–534.
Morris, K., Cursley, C. J., and Allen, R. W. K. 共1991兲. ‘‘The role of Venturis in pulse-jet filters.’’ Filtr. Sep., 28, 24 –31.
Morris, W. J.共1984兲. ‘‘Cleaning mechanisms in pulse jet fabric filters.’’ Filtr. Sep., 21, 50–54.
Ravin, M. D., Humphries, W., and Postle, R.共1988兲. ‘‘A model for the performance of a pulse jet filter.’’ Filtr. Sep., 24, 201–207.
Sievert, J., and Lo¨ffler, F.共1985兲. ‘‘The effect of cleaning system param-eters on the pressure pulse in a pulse-jet filter.’’ Proc., Conf. on Par-ticulate and Multiphase Process, Vol. II, Hemisphere Publishing Corp., Washington, D.C., 179–183.
Sievert, J., and Lo¨ffler, F.共1989兲. ‘‘Fabric cleaning in pulse-jet filter.’’ Chem. Eng. Process., 26, 179–183.
Tsai, C. J., Tsai, M. L., and Lu, H. C.共2000兲. ‘‘Effect of filtration velocity and filtration pressure drop on the bag-cleaning performance of a pulse-jet baghouse.’’ Sep. Sci. Technol., 35, 211–226.