Cascaded Broadcasting for Test Data Compression
Cheng-Ho Chang, Lung-Jen Lee, Wang-Dauh Tseng and Rung-Bin Lin
Department of Computer Science & EngineeringYuan Ze University Taoyuan, Taiwan [email protected]
Abstract –This paper presents a cascaded broadcast scheme
for test data compression. The basic idea is to conduct a dif-ferent number of broadcasts in a cumulative way to load each test pattern into scan chains. The broadcast scope can be dy-namically reduced as a result of the compatibility analysis among scan chains so that broadcasts can proceed efficiently and each scan chain is guaranteed to receive correct test data. Compared with similar works using broadcasting scheme, this method is very simple and effective. Experimental results for the ISCAS’89 benchmark circuits have demonstrated that a significant compression effect can be achieved at the cost of a limited amount of selection signals and low hardware overhead.
Keywords- automated test equipment (ATE); pattern
run-length; circuit under test (CUT); test data compression.
I. INTRODUCTION
Modern System-On-a-Chip (SOC) designs have com-bined several cores on a single chip, in which over millions of transistors are used. To detect the increasing number of faults, a large amount of test vector is required, which has seriously impacted the test cost owing to the prolonged testing time and the exceeding memory cost. Test data volume is now recognized as a major contributor to the cost of testing in the process of manufacturing integrated circuits [1-4]. Many researches have been proposed to reduce test data volume to improve the efficiency between the automatic test equipment (ATE) and SOC. Test data compression is a popularly-used method that condenses pre-computed test set into in a smaller size and stored in ATE memory. Compressed data is then transferred through test channels to SOC, decompressed losslessly by the on-chip decoder and sequentially scanned in through scan chain during the circuit test. The output re-sponse, on the other hand, can use lossy compaction tech-nique with little effect on fault coverage [5]. Many studies have focused on this topic, such as Nine codewords (9C) [6], Variable-length Input Huffman Coding (VIHC) [7], Selec-tive Huffman Coding (SHC) [8], Optimal selecSelec-tive Huffman Coding [9], Golomb Coding [10], Alternating Run-length Coding (ARL) [11], Frequency-Directed Run-length Coding (FDR) [12], Extended Frequency-Directed Run-length (EFDR) [13], Pattern Run-length Coding (PRL) [14], Dic-tionary Coding [15], RL-Huffman Encoding (RL-HC) [16], Block Merging (BM) [17], Multi-layer Data Copy (MDC)
[18], SAS [19],UMC Scan [20] and so on. Although, these encoding methods could save the test data storage effec-tively, an extra cost of hardware is required for test data decompression.
Another solution popularly used for reducing test data volume and test application time is BIST (built-in self-test). In BIST, test patterns are randomly generated by li-near-feedback shift-register (LFSR) using a smaller size of test data called seeds for on-chip testing. Although this technique can reduce test data storage significantly, it loses efficiency in testing some random pattern resistant (RPR) faults. In [15, 21], the Hybrid BIST method is proposed to solve this problem where deterministic test patterns for de-tecting RPR faults are stored and the BIST architecture is used for detection of easy-to-detect faults. Besides, some other techniques such as reseeding [22-23] and weight ran-dom pattern testing [24]are also proposed to solve this problem. In [25], the two-dimensional (space/time) com-pression method (S/TC) is proposed to reduce test data vo-lume and test application time for testing intellectual prop-erty (IP) cores. However, hardware overhead remains high. In [26], a tree-like architecture is proposed where the com-patibility of test data among columns in a test set and the correlation among scan cells in the scan chain are analyzed to reduce test data volume and number of clock cycles during the scan in/out of test data. Although efficiency is signifi-cantly improved using some XORs, it may cause a high hardware overhead and an aliasing problem. Similarly, in [27], the authors explore the compatibility among scan cells and propose a tree-based architecture of scan path for the reduction of test application time and test data volume. To reduce the test cost for multiple cores in SOC, the authors in [28] proposed an approach of concurrent core test, which efficiently condenses a large amount of test data in a much smaller shared set and employs on-chip scan chain disabling signal to active only a portion of scan chains during testing.
The broadcast-scan-based scheme is also very efficient in compressing test data where compatible scan chains can share the same data through broadcasting. Lee, Chen and Huang first explored the broadcasting idea in [29]. Then, this idea was implemented into Illinois scan by Jamzaoglu and Patel in [30]. However, an inefficiency problem is induced due to conflicts among scan chains. Many research works have been proposed to solve this problem. Recently, the multicasting scheme is proposed in [19, 31] in which large
amounts of control codes are used to select a limited number of compatible scan chains for the later data broadcasting. The authors in [20] further propose a universal-multicasting-scan (UMC) architecture to maximize the freedom of multicasting scheme and reduce the large amount of control bits. Although effective, the drawback appears in the excessive amount of control bits and the complex control logic in selecting com-patible scan chains for broadcast. Especially, for broadcast-ing each test pattern, the algorithm of searchbroadcast-ing minimum number of max-cliques implied the in-negligible testing time and the difficulty in obtaining an optimal solution.
In this paper, we propose a cascaded broadcast scheme for test data compression. The basic idea is to repeatedly broadcast test data to compatible scan chains with a dynam-ically reduced scope according to the compatibility analysis. This method requires only a very limited amount of selection signals and low hardware overhead. Moreover, to correctly scan-in each test pattern, the decision method in selecting compatible scan chains is very simple and easy to implement. The rest of this paper is organized as follows: Section II presents the proposed method. A simple example is given to illustrate the entire design flow. Section III reports the expe-rimental results. Finally, we conclude this paper in Section IV.
II. PROPOSED METHOD
This method presents a cascaded broadcast scheme to transmit test data via a single test channel of ATE to multiple scan chains. Scan chains can share the same test data if they are compatible. Two scan chains are recognized as compati-ble if every bit pair at the same position has the same value or any of them is a don’t-care. Otherwise they are incompatible. Given a test pattern p with r as the pattern length, we first evenly partition it into n sub-patterns. Each sub-pattern cor-responds to a scan chain. If all scan chains are compatible. Test pattern p can be scanned-in by broadcasting the com-pressed test data v to n scan chains. Since v is 1/n shorter than
r, test data can be compressed n times. In this method, we
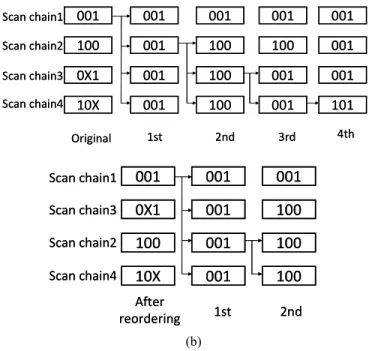
first assume that all scan chains are compatible and broadcast test data to all scan chains. If scan chain i is incompatible with all the previous i-1 scan chains, another broadcast from i to n is needed. In this way, test data in the scan chain i can be corrected. Note that, in this time, all scan chains from i to n are assumed compatible. The above procedure repeats until all scan chains have received correct test data. Obviously, a different test pattern may need a different broadcast plan and the required number of broadcasts can be different; it can be as small as 1, if all scan chains are compatible, and as big as n, if all are incompatible. The required number of broadcasts is different if scan chains are ordered differently. We will illu-strate it by a simple example. In Fig. 1(a), 4 scan chains are used (n=4) and the original test data of each scan chain are presented on the left respectively. Since scan chains (1, 2), (2, 3) and (3, 4) are incompatible, a broadcast of test data 001 to all scan chains is first conducted. Next, to adjust test data of scan chain 2 from 001 to 100, a second broadcast is con-ducted to scan chains 2, 3 and 4. In the third step, scan chain 3
is adjusted by broadcasting 100 to both scan chain 3 and scan chain 4. In the fourth step, scan chain 4 is corrected by the scan-in of test data 101. Consequently, it takes a total of four broadcasts to scan-in test data by the proposed cascaded broadcast scheme and no compression is achieved. Alter-nately, if all scan chains are properly reordered from the original sequence 1-2-3-4 to the sequence 1-3-2-4, as shown in Fig. 1 (b), only two broadcasts are required and the test data volume is reduced from the original 12 bits to 6 bits. As is demonstrated, a proper scan-chain reordering can help improve the broadcast efficiency in both the testing time and the test data volume. We will now describe the details.
A. Compatibility analysis
We first evenly partition a given test set into k columns and number them from 1 to k. Each column corresponds to a scan chain. Sub-patterns in scan chain j are denoted as Cj where j is an integer from 1 to k. To determine a scan-chain order for the broadcast efficiency, a compatibility graph is constructed to explore the compatibility among scan chains. In this graph, each vertex corresponds to a scan chain. For each vertex pair, an edge is connected with an edge weight denoting the compatibility between them. In this paper, compatibility is defined as the total number of compatible sub-patterns in the associated two columns. Two sub-patterns are recognized as compatible if they are in the same test pattern and, at the same time, both bits in the same position have the same value or any of them is a don’t-care. Hence, the compatibility of each vertex can be computed by sum-ming up all the edge weights originating from it. The com-patibility analysis can then be made among k
0X1 100 001 10X Scan chain1 Scan chain2 Scan chain3 Scan chain4 Original 001 001 001 001 100 100 001 100 001 100 001 001 001 001 001 101 1st 2nd 3rd 4th 0X1 100 001 10X Scan chain1 Scan chain2 Scan chain3 Scan chain4 Original 001 001 001 001 100 100 001 100 001 100 001 001 001 001 001 101 1st 2nd 3rd 4th
100
0X1
001
10X
Scan chain1 Scan chain3 Scan chain2 Scan chain4 After reordering001
001
001
001
100
100
001
100
1st 2nd100
0X1
001
10X
Scan chain1 Scan chain3 Scan chain2 Scan chain4 After reordering001
001
001
001
100
100
001
100
1st 2nd (b)Figure 1. Examples of (a) test data broadcasting. (b) Test data broadcasting after the scan chain reordering.
vertices by computing the compatibility of each of them. k scan chains are thus arranged from the top to the bottom in order of decreasing compatibilities. During the broadcasting of test data, the scan chain with the highest number of com-patibilities is first considered, and a second broadcast is is-sued once an incompatibility to the first scan chain is recog-nized. In this way, the cascade broadcasting of test data proceeds until all scan chains have received correct test data.
B. Construct the broadcast architecture
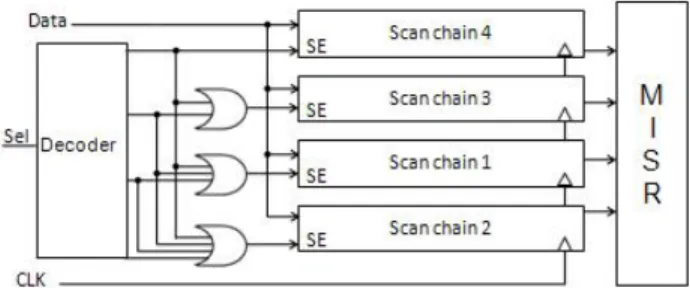
As shown in Fig. 2, the broadcast architecture is constructed by scan chains arranged in order according to the compati-bility analyses made in the previous step. The scan chain with the highest number of compatibilities is placed on the top and then the scan chain with the compatibilities next highest. In this way, all scan chains are placed from top to bottom in a decreasing order of compatibility. Each scan chain is acti-vated by an enable/disable signal sent from a simple selection circuitry. This simple circuitry is composed of a de-multiplexer and three OR gates. If the selection signal is “00”, all the scan chains are enabled. If the selection signal is “01”, scan chains 2 ~ 4 are enabled. If the selection signal is “10”, scan chains 3 ~ 4 are enabled. If the select signal is “11”, only scan chain 4 is enabled.
C. Decide the broadcast plan for each test pattern
Once the broadcast architecture is constructed, a broadcast plan has to be made for each test pattern so that test data in every scan chain can be correctly scanned in. In each broadcast plan, the broadcast of scan-chain data follows the scan chain order in the broadcast architecture from the top to the bottom. In other words, the data of the first scan chain is first broadcast to all scan chains. Then, considering the
Figure 2. An example architecture for the proposed broadcasting scheme with 4 scan chains.
Figure. 3 An example test set.
4
3
2
1
1
5
3
4
3
3
4
3
2
1
1
5
3
4
3
3
Figure 4. The compatibility graph in this example.
Scan chain 3 Scan chain 4 Scan chain 1 Scan chain 2 Scan chain 3 Scan chain 4 Scan chain 1 Scan chain 2
Figure 5. The resulting scan chain architecture in the example.
Table I The broadcast plans for each test pattern. #p S Data #p S Data #p S Data
P1 00 111X00 P3 00 11XXXX P5 00 11011X 10 101000 10 100XXX 11 XXXX01 11 000001 P2 00 0X00XX P4 00 110XX0 P6 00 X1X00X 10 111000 01 000111 01 011010 11 000000 11 10000X 11 1XXX00 compatibility of the following scan chains with the first scan chain one by one, another scan-chain data is broadcast once an incompatibility occurs. Repeat the above procedure until the entire test pattern is correctly scanned into all scan chains. Note that considering the selection algorithm for compatible scan chains for broadcasting, the proposed broad-cast-plan-decision algorithm is quite efficient and easy to implement, unlike the max-clique algorithm used in SAS [19] and UMC [20] which falls short in a prolonged testing time due to the computational complexity of the NP-complete problem. To facilitate the description, an example follows.
D. An example for the proposed method
In this section, a simple example is given to illustrate the entire design flow for the proposed method. As shown in Fig. 3, the original test set contains 6 test patterns and each pattern has 24 bits. In the first step, the test set is partitioned into 4 columns (k=4). Each column contains 6 sub-patterns. In Fig. 4, a compatibility graph is constructed where each vertex corresponds to one column (or one scan chain) and the edge connecting every two vertices denotes the compatibility between them. For example, column 1 and column 2 have one pair of compatible sub-patterns occurring in test pattern P3, while 5 compatibilities occur between column 1 and column 4 in test patterns 1, 2, 3, 5 and 6, respectively. Three
patterns 3, 5 and 6, respectively. As a result, the total number of edge weights originating from the vertex 1 is 1+5+3=9. In the same way, the edge weights originating from the vertices 2, 3, 4 are 7, 10 and 12 respectively. In the second step, the broadcast architecture arranges the four scan chains from the top to the bottom in reverse order of their compatibilities which is 4-3-1-2, as shown in Fig. 5. In the third step, the broadcast plan is made for each test pattern. As shown in Table I, column “#p” denotes the pattern number. Columns “S” and “Data” respectively present the selection signals and the corresponding compressed test data. Taking the first test pattern (P1) as an example, three broadcasts are required to scan in P1 to the four scan chains. With the first selection signal “00”, test data “111X00” is broadcast to all four scan chains. With the second selection signal “10”, scan chains 1 and 2 are updated by test data “101000”. In the last broadcast, scan chain 2 is updated as “000001”. Consequently, test data “101000 000001 111X00 111X00”, which is compatible to the original “1010000 000001 111X0X XXXXX0”, is scanned into the scan chains (from chain 1 to chain 4) by the proposed cascaded broadcasting scheme. The test data vo-lume is reduced from the original 144 bits to 96 bits and the compression ratio is 33.3%.
III. EXPERIMENTAL RESULTS
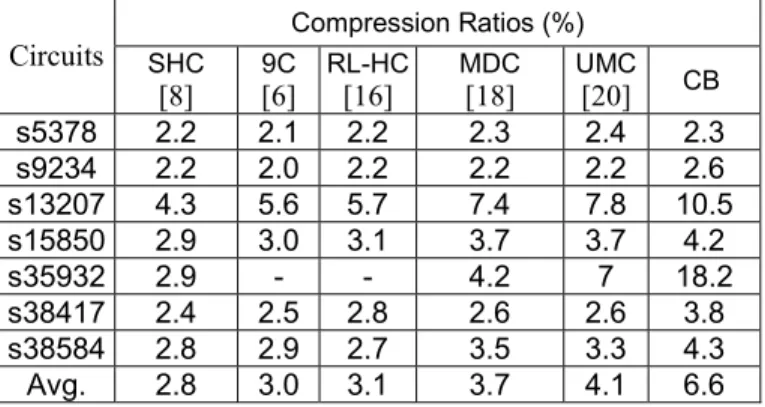
We conducted experiments in C++ language on an Intel(R) Core(TM) 2 Duo CPU E4500 2.2GHz 2.5GB PC. The test sets for the large ISCAS’89 full-scan benchmark circuits are generated by MINTEST [32]. In the first experiment, we compare the compression effect with similar methods using broadcasting schemes. The compression ratio is computed by dividing the original test data volume by the compressed data volume. The compressed data volume includes the resulting test bits and the extra control bits. Table II shows the com-pression results compared with the results of other methods. The first column presents the circuit names. By the circuit sequence, the number of scan chains and the scan chain length is (7, 31), (14, 18), (30, 23), (30, 20), (111, 16), (67, 25), (64, 23) respectively. Taking the circuit s5378 as an example, 7 scan chains are involved and the scan chain length is 31. The first column presents the circuit names. The next column compares the compression ratios with those in the other methods. Results show that the proposed cascaded broadcasting method (CB) can achieve an average compres-sion of 6.6% and is superior to the others in most cases.
In the second experiment, we analyze the hardware overhead of the decompressor architecture and compare it with the UMC and the SAS methods. The benchmark circuits and the decompressor were synthesized using Synopsys Design Compiler with a single scan chain.
The proposed method requires very little control logic. The controller is circuit-independent and depends only on the total number of scan chains. As can be seen in Table III, the required hardware overhead by the proposed method is quite limited, far less than those by the other two methods.
In the third experiment, with the same number of scan
Table II Compression comparisons with the other methods.
Circuits Compression Ratios (%) SHC [8] 9C [6] RL-HC [16] MDC [18] UMC[20] CB s5378 2.2 2.1 2.2 2.3 2.4 2.3 s9234 2.2 2.0 2.2 2.2 2.2 2.6 s13207 4.3 5.6 5.7 7.4 7.8 10.5 s15850 2.9 3.0 3.1 3.7 3.7 4.2 s35932 2.9 - - 4.2 7 18.2 s38417 2.4 2.5 2.8 2.6 2.6 3.8 s38584 2.8 2.9 2.7 3.5 3.3 4.3 Avg. 2.8 3.0 3.1 3.7 4.1 6.6
Table III Result comparisons in hardware overhead for the con-troller.
# scan chains
Area Overhead (gates) UMC [20] SAS [19] CB 16 602 84 23 32 861 167 56 64 1285 334 112 128 2076 585 224 256 3561 1253 443 512 6494 2672 1006
Table IV Efficiency comparisons for the scan-in of test data.
Circuits PartitionsScan-Chain Length (Avg.) # Broadcasts/Pat.CB UMC/SAS
s5378 7 31 2.9 3 s9234 14 18 5 6.6 s13207 30 23 2.5 4.2 s15850 30 20 6.1 9.9 s35932 111 16 4.9 9.1 s38417 67 25 15.2 32.4 s38584 64 23 12.8 20.5
chains, we compare the average number of broadcasts for scanning-in each test pattern with those in the UMC and the SAS methods. (Both methods exploit the same multi-cast scan chain architecture; therefore, they have the same num-ber of broadcasts.) As shown in Table IV, the proposed me-thod takes a smaller average number of broadcasts.
The reason for this comparison result is discussed as be-low. As previously stated, both the UMC and the SAS me-thods exploit the max-clique-decision algorithm in selecting compatible scan chains for broadcasting. Although optimal, this algorithm is known to be NP-complete; therefore, only a sub-optimal solution is available in a reasonable time.
IV. CONCLUSION
We have proposed a cascaded broadcasting compression method to reduce test data volume and test application time for today’s multiple-scan testing. The selection algorithm is simple and effective. Significant improvement in test data
compression can be achieved at the cost of very little control logic. Experimental results for ISCAS’89 benchmark circuits have demonstrated that this method outperforms the others in aspects of the compression effect, the required hardware overhead, and the broadcast efficiency.
REFERENCES
[1] Rajski, J., et al., “Embedded deterministic test,” IEEE Transactions on Comput-er-Aided Design of Integrated Circuits and Systems, 2004. 23(5), pp. 776-792.
[2] Mitra, S. and K. Kee Sup,” X-compact: an efficient re-sponse compaction technique,” IEEE Transactions on Computer-Aided Design of Integrated Circuits and Systems, 2004. 23(3), pp. 421-432. [3] Koenemann, B., et al.,” A SmartBIST variant with guaranteed
encoding,” Proc. Test Symposium, 2001. Proc. 10th Asian. 2001, pp. 325-330.
[4] Mitra, S. and K.S. Kim,” XMAX: X-tolerant architecture for MAXimal test compression,” Proc. Computer Design, 2003. Proc. 21st International Conference on. 2003, pp. 326-330.
[5] Touba, N.A.,” Survey of Test Vector Compression Techniques,” Design & Test of Computers, IEEE, 2006. 23(4), pp. 294-303. [6] Tehranipoor, M., M. Nourani, and K. Chakrabarty, “Nine-coded
compression technique for testing embed-ded cores in SoCs” IEEE Transactions on Very Large Scale Integration (VLSI) Systems, 2005. 13(6), pp. 719-731.
[7] Gonciari, P.T., B.M. Al-Hashimi, and N. Nicolici,”Im-proving compression ratio, area overhead, and test application time for system-on-a-chip test data com-pression/decompression,” Proc. Design, Automation and Test in Europe Conference and Exhibition, 2002. Proc. 2002, pp. 604-611.
[8] Jas, A., et al.,” An efficient test vector compression scheme using selective Huffman coding,” IEEE Transactions on Comput-er-Aided Design of Integrated Circuits and Systems, 2003. 22(6), pp. 797-806. [9] Kavousianos, X., E. Kalligeros, and D. Nikolos,” Optimal Selective
Huffman Coding for Test-Data Compression,” IEEE Transactions on Computers, 2007. 56(8), pp. 1146-1152.
[10] Chandra, A. and K. Chakrabarty,”System-on-a-chip test-data compression and decompression architectures based on Golomb codes,” IEEE Transactions on Computer-Aided Design of Integrated Circuits and Systems, 2001. 20(3), pp. 355-368.
[11] Chandra, A. and K. Chakrabarty,” A unified approach to reduce SOC test data volume, scan power and testing time,” IEEE Transactions on Computer-Aided Design of Integrated Circuits and Systems, 2003. 22(3), pp. 352-363.
[12] Chandra, A. and K. Chakrabarty,” Test data compression and test resource partitioning for system-on-a-chip using frequency-directed run-length (FDR) codes,” IEEE Transactions on Computers, 2003. 52(8), pp. 1076-1088.
[13] El-Maleh, A.H. and R.H. Al-Abaji,” Extended frequen-cy-directed run-length code with improved application to system-on-a-chip test data compression,” Proc. Elec-tronics, Circuits and Systems, 2002. 9th , pp. 449-452 vol.2.
[14] Ruan, X. and R. Katti,” An efficient data-independent technique for compressing test vectors in sys-tems-on-a-chip,” Proc. Emerging VLSI
Technologies and Architectures, IEEE Computer Society Annual Symposium on. 2006, pp. 6 .
[15] Li, L. and K. Chakrabarty,” Test data compression using dictionaries with fixed-length indices,” Proc. VLSI Test Symposium. 2003, pp. 219-224.
[16] Nourani, M. and M.H. Tehranipour,” RL-huffman en-coding for test compression and power reduction in scan applications,” ACM Trans. Des. Autom. Electron. Syst., 2005. 10(1), pp. 91-115.
[17] El-Maleh, A.H., “Efficient test compression technique based on block merging. Computers & Digital Tech-niques,” IET, 2008. 2(5), pp. 327-335.
[18] Shih-Ping, L., et al.,”A Multilayer Data Copy Test Data Compression Scheme for Reducing Shifting-in Power for Multiple Scan Design,” IEEE Transactions on Very Large Scale Integration (VLSI) Systems, 2007. 15(7), pp. 767-776.
[19] Al-Yamani, A., et al.,”Scan Test Cost and Power Re-duction Through Systematic Scan Reconfiguration,” IEEE Transactions on Computer-Aid-Design of Integrated Circuits and Systems, 2007. 26(5), pp. 907-918.
[20] Chao-Wen, T. and H. Shi-Yu,”UMC-Scan Test Metho-dology: Exploiting the Maximum Freedom of Multi-casting,” Design & Test of Computers, IEEE, 2008. 25(2), pp. 132-140.
[21] Jervan, G., et al.,”Test time minimization for hybrid BIST of core-based systems,” Proc. Test Symposium, 2003. ATS 2003. 12th Asian. 2003, pp. 318-323.
[22] Hellebrand, S., H. Linag, and H.-J. Wunderlich, “A mixed-mode BIST scheme based on reseeding of folding counter,” Journal of Electronic Testing: Theory and Ap-plications, 2001. 17, pp. 341-349.
[23] Krishna, C.V., A. Jas, and N.A. Touba,”Test vector encoding using partial LFSR reseeding,” Proc. Test Conference, 2001, pp. 885-893. [24] Seongrnoon, W., “Low hardware overhead scan based 3-weight
weighted random BIST,” Proc. Test Conference, 2001, pp. 868-877. [25] Lei, L., et al., “Efficient space/time compression to reduce test data
volume and testing time for IP cores,” Proc. VLSI Design. 2005. 18th. 2005, pp. 53-58.
[26] Banerjee, S., D.R. Chowdhury, and B.B. Bhattacharya, “An Efficient Scan Tree Design for Compact Test Pattern Set,” IEEE Transactions on Computer-Aided Design of Integrated Circuits and Systems, 2007. 26(7), pp. 1331-1339.
[27] Bonhomme, Y., et al., “An efficient scan tree design for test time reduction,” Proc. Test Symposium, 2004. ETS 2004, pp. 174-179. [28] Zeng, G. and H. Ito, “Concurrent core test for Soc using shared test and
scan chain disable,” Proc. Design, Automation and Test in Europe. 2006, pp. 1-6.
[29] Kuen-Jong, L., C. Jih-Jeen, and H. Chen-Hua, “Using a single input to support multiple scan chains,” Proc. ICCAD 98, pp. 74-78.
[30] Hamzaoglu, I. and J.H. Patel, “Reducing test application time for full scan embedded cores,” Proc. Fault-Tolerant Computing, 1999, pp. 260-267.
[31] Al-Yamani, A., E. Chmelar, and M. Grinchuck, “Seg-mented addressable scan architecture,” Proc. VLSI Test Symposium, 2005. Proc. 23rd IEEE. 2005, pp. 405-411.
[32] Hamzaoglu, I. and J.H. Patel, “Test set compaction algorithms for combinational circuits,” IEEE Transactions on Computer-Aided Design of Integrated Circuits and Systems, 2000. 19(8), pp. 957-963.