Search for critical loading condition of the spine – A meta
analysis of a nonlinear viscoelastic finite element model
JAW-LIN WANG†*, ABOULFAZL SHIRAZI-ADL‡ and MOHAMAD PARNIANPOUR{
†#1, Section 1, Jen-Ai Road, Collage of Engineering and Collage of Medicine, Institute of Biomedical Engineering, National Taiwan University, Taipei, 100 Taiwan, ROC
‡Department of Mechanical Engineering, Ecole Polytechnique, Montreal, Que., Canada {Department of Mechanical Engineering, Sharif Technology University, Tehran, Iran
(Received 17 May 2004; in final form 20 May 2005)
The relative vulnerability of spinal motion segments to different loading combinations remains unknown. The meta-analysis described here using the results of a validated L2 – L3 nonlinear viscoelastic finite element model was designed to investigate the critical loading and its effect on the internal mechanics of the human lumbar spine. A Box-Behnken experimental design was used to design the magnitude of seven independent variables associated with loads, rotations and velocity of motion. Subsequently, an optimization method was used to find the primary and secondary variables that influence spine mechanical output related to facet forces, disc pressure, ligament forces, annulus matrix compressive/shear stresses and anulus fibers strain. The mechanical responses with respect to the two most-relevant variables were then regressed linearly using the response surface quadratic model. Axial force and sagittal rotation were identified as the most-relevant variables for mechanical responses. The procedure developed can be used to find the critical loading for finite element models with multi input variables. The derived meta-models can be used to predict the risk associated with various loading parameters and in setting safer load limits.
Keywords: Meta-models; Motion segment; Finite element modeling; Viscoelasticity; Biomechanics
1. Introduction
Epidemiological studies have identified frequent dynamic loading, sudden forceful exertions, exposure to vibration, lifting frequency, lifting asymmetry, extreme trunk angular position and movement velocity as risk-enhancing factors related to low back pain (LBP), disorders and symptoms (Frymoyer et al. 1983). Effective preventive strategies can only be designed and implemented if the mechanisms of spinal injury are adequately understood. Realistic stress – strain analysis quantifying the effects of the preceding risk factors on the lower back response requires extensive, time-dependent, dynamic experimen-tal and computational model studies. The finite element method (FEM) is an appropriate tool for exploring spine mechanics. We have previously developed a 3-D, finite element, nonlinear viscoelastic model to explore the dynamic behaviour of spinal motion segments under different load and displacement conditions. The model has been validated under several static and dynamic loading
conditions by comparison of its predictions with available results of measurements (Wang et al. 1997a – c, 1998, 2000).
Previous finite element studies, however, have con-sidered the dose-response of the lumbar motion segments under only specific load/displacement magnitudes, thus providing incomplete views of all likely conditions. Since the number of loading conditions on the human spine in various activities is virtually limitless, it is crucial to find the most critical conditions that could introduce higher risk of injury. In this work, we propose a meta-analysis of FEM simulations to investigate the spinal response under various mechanical loading and movement conditions.
The generic procedure for building the meta-models involves the following three steps; first, select the experimental design to yield the loading condition for the FEM simulations, e.g. D-optimal, Latin hypercubes (McKay et al. 1979), or response surface design (RSD) (Box and Behnken 1960); second, perform a number of FEM analyses based on the selected experimental design;
Computer Methods in Biomechanics and Biomedical Engineering ISSN 1025-5842 print/ISSN 1476-8259 online q 2005 Taylor & Francis
http://www.tandf.co.uk/journals DOI: 10.1080/10255840500317631
*Corresponding author. E-mail: [email protected] Vol. 8, No. 5, October 2005, 323–330
T able 1. The le v els of ind ependen t v ariabl es (i.e. loading condition s) of four group s. Group Loadi ng per iod (s) AP shea r force F1 (kN) Lateral shear force F2 (kN) Co mp. force F3 (kN) Lateral rotatio n U 4 (d eg ) Sagittal rotatio n U 5 (de g) Axia l rotat ion U6 (de g) 1 0.3 0 0 2 10 0 0 1.3 2 0.5 0.25 2 3 2 2 2 4 2 1 2.3 2 1 0.5 2 5 2 4 2 8 2 2 Co mple x asym metric fle xion wit h anteri or and right lateral shea r at hig h compre ssi v e load ing 2 0.3 1 0.5 2 10 0 0 1.3 0 0 2 3 2 2 2 4 2 1 2.3 2 1 2 0.5 2 5 2 4 2 8 2 2 Co mple x asymm etric fle xion with anterop ost erior and right – left lateral she ar at high compre ssi v e load ing 3 0.3 1 0.5 2 24 4 2 1.3 0 0 2 3.5 0 2 30 2.3 2 1 2 0.5 2 5 2 4 2 10 2 2 Comp le x asymm etric fle xion-e xten sion with high anterop ost erior and right – left lateral shear at high compre ssi v e load ing 4 0.3 0.2 0.2 2 0.5 4 4 2 1.3 0 0 2 1.25 0 2 30 2.3 2 0.2 2 0.2 2 2 2 4 2 10 2 2 Comp le x asymm etric fle xion-e xtensio n with medium anterop ost erior and right – left lateral shear at medium com pressi v e loading Anteroposterior shear force direction: þ Posterior , 2 Anterior Lateral shear force direction: þ Right, 2 Left Axial force direction: þ Upward, 2 Do wnward Lateral rotation: þ Left bending, 2 Right bending Sagittal rotation: þ Extension, 2 Flexion Axial rotation: þ Left rotation, 2 Right rotation
third, fit an empirical meta-model to the predicted data using, e.g. linear regression (Welch et al. 1990) or Kriging (Sacks et al. 1989) modeling methods (Matherton 1963). During the first step, the RSD method is the technique that efficiently reduces the number of numerical simulations (Box and Draper 1987, Myers and Montgomery 1995). Many techniques, such as Central Composite Design and Box-Behnken Design (BBD) have been developed based on the RSD principle. Linear regression of the results
of FEM simulations with respect to the loading conditions can be of one, two or higher orders, depending on response characteristics.
Hence, the objectives of the current study are two-fold; first, to demonstrate the capability and feasibility of meta-analysis in presenting the results of a FE model with multiple input variables; and second, to find the two primary variables and their influence on spine biomechanics.
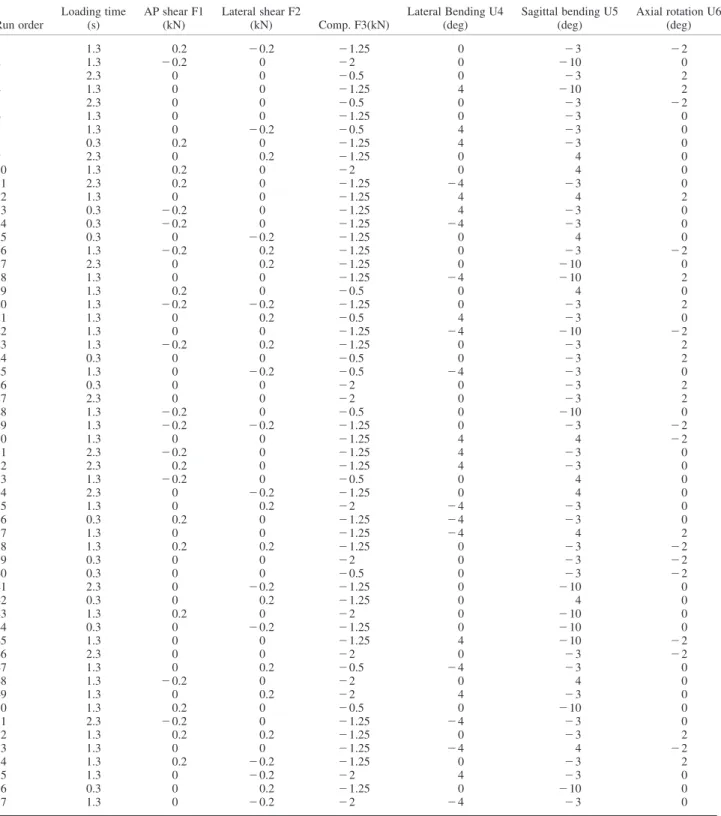
Table 2. An example (group 4) of experimental design using Box-Behnken Design (BBD).
Run order Loading time (s) AP shear F1 (kN) Lateral shear F2 (kN) Comp. F3(kN) Lateral Bending U4 (deg) Sagittal bending U5 (deg) Axial rotation U6 (deg) 1 1.3 0.2 2 0.2 2 1.25 0 2 3 2 2 2 1.3 2 0.2 0 2 2 0 2 10 0 3 2.3 0 0 2 0.5 0 2 3 2 4 1.3 0 0 2 1.25 4 2 10 2 5 2.3 0 0 2 0.5 0 2 3 2 2 6 1.3 0 0 2 1.25 0 2 3 0 7 1.3 0 2 0.2 2 0.5 4 2 3 0 8 0.3 0.2 0 2 1.25 4 2 3 0 9 2.3 0 0.2 2 1.25 0 4 0 10 1.3 0.2 0 2 2 0 4 0 11 2.3 0.2 0 2 1.25 2 4 2 3 0 12 1.3 0 0 2 1.25 4 4 2 13 0.3 2 0.2 0 2 1.25 4 2 3 0 14 0.3 2 0.2 0 2 1.25 2 4 2 3 0 15 0.3 0 2 0.2 2 1.25 0 4 0 16 1.3 2 0.2 0.2 2 1.25 0 2 3 2 2 17 2.3 0 0.2 2 1.25 0 2 10 0 18 1.3 0 0 2 1.25 2 4 2 10 2 19 1.3 0.2 0 2 0.5 0 4 0 20 1.3 2 0.2 2 0.2 2 1.25 0 2 3 2 21 1.3 0 0.2 2 0.5 4 2 3 0 22 1.3 0 0 2 1.25 2 4 2 10 2 2 23 1.3 2 0.2 0.2 2 1.25 0 2 3 2 24 0.3 0 0 2 0.5 0 2 3 2 25 1.3 0 2 0.2 2 0.5 2 4 2 3 0 26 0.3 0 0 2 2 0 2 3 2 27 2.3 0 0 2 2 0 2 3 2 28 1.3 2 0.2 0 2 0.5 0 2 10 0 29 1.3 2 0.2 2 0.2 2 1.25 0 2 3 2 2 30 1.3 0 0 2 1.25 4 4 2 2 31 2.3 2 0.2 0 2 1.25 4 2 3 0 32 2.3 0.2 0 2 1.25 4 2 3 0 33 1.3 2 0.2 0 2 0.5 0 4 0 34 2.3 0 2 0.2 2 1.25 0 4 0 35 1.3 0 0.2 2 2 2 4 2 3 0 36 0.3 0.2 0 2 1.25 2 4 2 3 0 37 1.3 0 0 2 1.25 2 4 4 2 38 1.3 0.2 0.2 2 1.25 0 2 3 2 2 39 0.3 0 0 2 2 0 2 3 2 2 40 0.3 0 0 2 0.5 0 2 3 2 2 41 2.3 0 2 0.2 2 1.25 0 2 10 0 42 0.3 0 0.2 2 1.25 0 4 0 43 1.3 0.2 0 2 2 0 2 10 0 44 0.3 0 2 0.2 2 1.25 0 2 10 0 45 1.3 0 0 2 1.25 4 2 10 2 2 46 2.3 0 0 2 2 0 2 3 2 2 47 1.3 0 0.2 2 0.5 2 4 2 3 0 48 1.3 2 0.2 0 2 2 0 4 0 49 1.3 0 0.2 2 2 4 2 3 0 50 1.3 0.2 0 2 0.5 0 2 10 0 51 2.3 2 0.2 0 2 1.25 2 4 2 3 0 52 1.3 0.2 0.2 2 1.25 0 2 3 2 53 1.3 0 0 2 1.25 2 4 4 2 2 54 1.3 0.2 2 0.2 2 1.25 0 2 3 2 55 1.3 0 2 0.2 2 2 4 2 3 0 56 0.3 0 0.2 2 1.25 0 2 10 0 57 1.3 0 2 0.2 2 2 2 4 2 3 0
2. Method
2.1 Loading conditions for numerical experiments Four groups of loading, i.e. (1) complex asymmetric flexion with high anterior and right lateral shear forces at high compressive loading, (2) complex asymmetric flexion with anteroposterior and right-left lateral shear forces at high compressive loading, (3) complex asymmetric flexion-extension with high anteroposterior and right – left lateral shear forces at high compressive loading, and (4) complex asymmetric flexion-extension with moderate anteroposterior and right – left lateral shear at medium compressive loading, were designed to cover a wide range of loading that the spinal motion segment may encounter in various recreational and occupational tasks. Each group of loading was studied accounting for seven independent variables, i.e. loading duration (i.e. velocity of movement), anteroposterior shear force, lateral shear force, compressive force, lateral bending rotation, sagittal rotation and axial rotation. For example, the first loading set, i.e. the complex asymmetric flexion with anterior and right lateral shear forces at high compressive loading, consists of 1000 N anterior shear, 500 N right lateral shear, 5000 N compressive force, 48 right lateral bending, 88 flexion and 28 right axial rotation. In various loading groups, the load duration ranged 0.3 – 2.3 s to account for the velocity of movements. The ultimate anteroposterior
and lateral shear forces were set respectively as 1000 and 500 N, respectively, whereas the highest compressive force was taken as 5000 N. The maximum lateral bending and axial rotations were set as 4 and 28, respectively, whereas the sagittal angle reached 108 in flexion and 48 in extension. Each factor includes three levels. The detailed magnitude of variables and levels of each group are shown in table 1.
The BBD, which is based on the RSD principle, was used for the experimental design. With the high repeatability of the results of FEM simulations, one block experimental design was adequate in formulating the experimental table. The experiments were performed only once for each loading condition (Minitab User Guide). At the end, the seven independent variables, three levels for each variable, and one block experimental design resulted in 57 runs in each group. The details of the loading conditions of the 57 runs for group 4 are listed in table 2. The loading conditions of the FE simulations were coded following the values listed in the table. For example, the loading condition of the first case of group 4 is to reach 200 N posterior shear, 200 N left lateral shear, 1250 compressive force, 08 lateral bending, 38 flexion and 28 right axial rotation within 1.3 s. The statistical software Minitab R13 (Minitab Inc., State College, PA, USA) was used to generate the numerical experimental protocol.
2.2 Finite element modeling
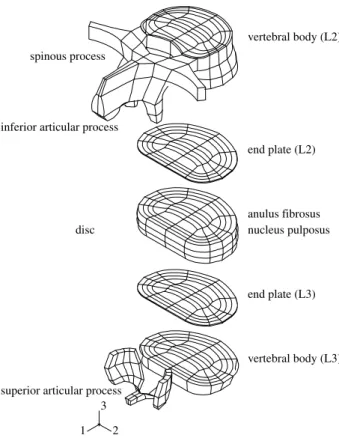
A validated viscoelastic finite element model of the L2 – L3 motion segment was used for the numerical experiments (Wang et al. 1998, 2000). The current model includes the vertebrae, anulus fibrosus, nucleus pulposus, facets and ligaments (Shirazi-Adl et al. 1986) (see figure 1). The experimental data of Best et al. (1994) and Li (1994) were used to develop a viscoelastic model of the anulus matrix based on the Prony series. In addition, the experimental data of Haut and Little (1972) were used to develop a nonlinear viscoelastic (Zener) model of the collagen fibres embedded in the ground substance of the anulus fibrosus. The experimental results of McNally et al. (1992) and Iatridis et al. (1997) were used to optimize the nucleus pulposus viscoelastic parameters. The ligamentous properties such as the cross sectional area and elastic response were taken from an earlier elastic model (Adl et al. 1986, Shirazi-Adl and Drouin 1987) whereas the viscoelastic material properties were obtained from reported constant strain rate loading experiments of anterior longitudinal ligament (ALL) (Wang et al. 1997, Neumann et al. 1992, 1993, 1994). The geometric and material nonlinearities were also incorporated (Argoubi and Shirazi-Adl 1996). The model was implemented in ABAQUS v5.3 with a total of 10 different material types and 2022 elements. The results of the entire model have extensively been validated by comparison of its predictions with the experimental data of compressive, creep and cyclic relaxation loadings (Wang et al. 1997a,b, 1998, 2000). Figure 1. The finite element mesh of the lumbar spinal motion segment
L2 – L3. The criss-cross structured anulus collagen fibers of the disc and the ligaments are not plotted for better visualization.
In the current study, seven independent variables as described previously were the input for the FEM. We analyzed the mechanical responses of the facet joint, ligaments and disc. The posterior longitudinal ligament (PLL) was selected to represent the characteristic behaviour of all segmental ligaments. The mechanical response of segmental components were analyzed to give a detailed understanding of the ligamentous spine mechanics during complex loading; i.e. total and left facet joint force, PLL stress and strain, the intra-discal pressure (IDP), annulus matrix (AM) compressive (in axial direction) and shear (in transverse direction) stresses and anulus fibrosus (AF) strain. Since the loading conditions of each simulation varied from one analysis to another, the global maximum values within each analysis were selected for subsequent statistical analysis.
2.3 Meta analysis of FEM results
The “best subsets” routine using the statistical software Minitab R13 was used to find the primary and secondary independent variables of the seven loading conditions that best correlated with the mechanical responses considered.
The abovementioned mechanical responses were
regressed linearly with the two most-relevant variables using the response surface quadratic model, which
is virtually a two-variables second order regression. The correlation coefficients of the regression were also obtained. The contours of the mechanical responses with respect to the primary and secondary variables were then plotted. While plotting the contours, the magnitudes of the remaining five variables were kept constant. For example, if the sagittal motion and axial force were the most-relevant variables for a specific response parameter, the contours were plotted in the full range of sagittal motion (108 flexion to 48 extension) and axial compressive force (1 – 5 kN), while the anteroposterior and lateral shear forces were 0 kN, and the lateral bending and axial rotations were 08 for the loading period of 1.3 s. It should be noted that the absolute maximum values may have occurred in other combinations of loading. The purpose of setting the other variables constant was to show the effect of two most-relevant variables with no confounding influence.
3. Results
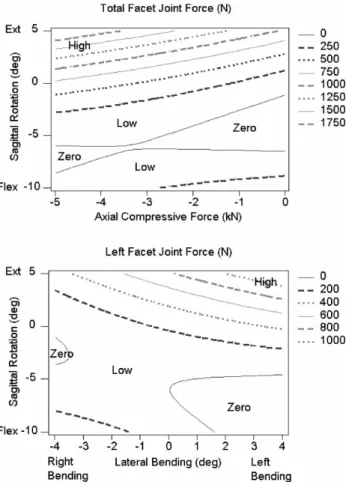
The axial force and sagittal bending rotation were found to be the most significant independent variables influencing the mechanical responses of the facet joints, PLL and disc. The only exemption is the left facet joint force, which Figure 2. The contour plots of (A) total facet joint force w.r.t. the
sagittal rotation and axial compressive loading (r2¼ 90.4%), and (B) left facet joint force w.r.t. the sagittal rotation and lateral bending (r2¼ 78.2%).
Figure 3. The contour plots of (A) stress (r2¼ 76.0%), and (B) strain
(r2¼ 86.4%) of posterior longitudinal ligament (PLL) w.r.t the sagittal rotation and axial compressive force.
is best predicted by lateral and sagittal bending rotation. The coefficients of correlation of all meta-models in the current study are well above 70%, except the responses of AF (see captions of figures 2 – 6). The total facet joint force increases as the extension rotation and axial compression increase, with the effect of the former being greater than that of the latter. The lowest facet joint force occurs at low axial loading with medium flexion. The extension motion and left lateral motion increase the
left facet joint force. The left facet joint is lowest at flexion with right lateral bending (figure 2B).
The PLL is not stressed when sagittal rotation is small. The PLL tensile stress is increased by flexion motion; however, the PLL can also be lightly stressed during hyper extension with high axial loading (figure 3A). The latter effect is due to the posterior shift towards facet joints of the centre of segmental rotation under larger extension rotations. The PLL strain is also best predicted by flexion rotation and axial compressive loading. However, the strain is higher at hyper flexion with less axial compressive loading. The low axial compressive loading combined with extension motion would generate com-pressive strain in the PLL.
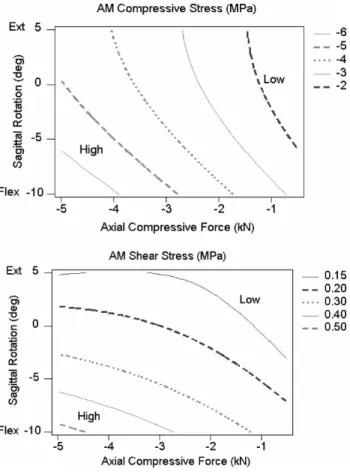
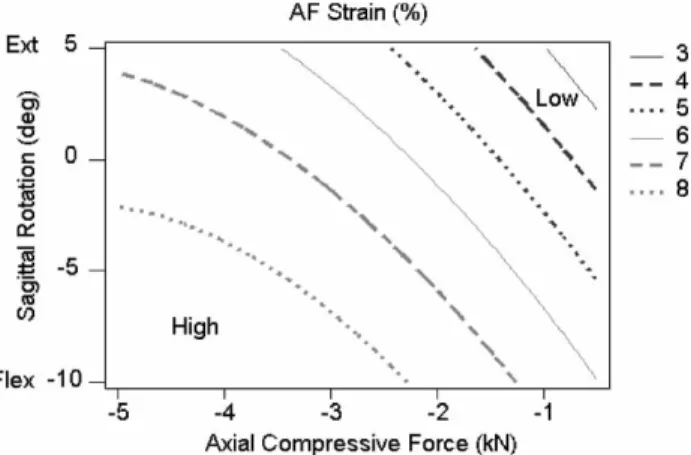
The IDP is higher at larger compressive loading with flexion, and lower at smaller compressive loading with extension (figure 4). It is noted that the disc could be even in tension (i.e. suction) when the motion segment is under hyper extension with low axial compressive loading. This is due to the “pivot effect” of the facet joint as mentioned above. The mechanical response (shape of contour) of AM compressive stress is similar to the IDP (figure 5A). The hyper flexion and axial force will induce high compressive and shear stresses in the AM. Lowering the axial force and flexion motion can reduce the AM compressive stress. The AM shear stress is greatly reduced with hyper extension even under high compressive loading (figure 5B). The maximum AF strain decreases in extension motion and low axial loading, whereas it increases with flexion (figure 6).
4. Discussion
We developed the meta-analysis using results of FEM simulations with different conditions. The procedure can be used to find the most critical loading conditions for the cases when the input variables of FE simulations are numerous. The developed meta model is an efficient tool for predicting the most critical conditions associated with the risk of injury at a specific component of the ligamentous spine. As such, it has the potential to be used in the design of work environments, optimal manual material handling tasks and the spinal instrumentation.
In the current study, performing a full factorial experimental design of seven factors with three levels, required 2187 experiments in each group and 8748 experiments in total. However, with the use of the BBD method, only 228 runs were needed for the four groups of experiments. The number of runs when using BBD constitutes a mere 2.6% of those using full factorial design. Hence, the BBD method greatly reduced the effort of FE experiments.
The three major load-sharing components of motion segment, i.e. the facet joints, ligaments and disc were all considered in the current model. It was found that sagittal rotation and axial compression loading are the two most-relevant independent variables in defining the risk factors Figure 4. The contour plot of intra-discal pressure (IDP) w.r.t. the
sagittal rotation and axial compressive loading (r2¼ 98.1%).
Figure 5. The contour plots of (A) maximum AM compressive stress (r2¼ 90.2%), and (B) maximum AM shear stress (r2
¼ 71.1%) w.r.t. the sagittal rotation and axial compressive force.
for all three foregoing components within the motion segment. This finding lends support to many already existing in vitro studies which use complex flexion loading conditions as the controlling variables. Moreover, the finding suggests that these two variables should be used when attempting to set safe limits on loading conditions.
The current analysis aimed to combine some extreme loading conditions that the motion segment may encounter in daily physical activities. Full coverage of all loading in six degrees of freedom and at different loading rates may not be necessary. The four groups considered in this work represented the complex asymmetric flexion and extension with varying pro-portions of sagittal and lateral shear forces under light, moderate and heavy compression loading. The ratio of sagittal, coronal (lateral) and transverse (axial) rotations (i.e. 8:4:2) was based on previous reports (Pearcy and Tibrewal 1984, Pearcy et al. 1984, Panjabi et al. 1989, Yamamoto et al. 1989, Panjabi et al. 1994, Cholewicki et al. 1996). The combination of loading conditions of the spine can be very wide. A forward flexion in lifting, for example, could justify the different amount of shear and compression forces in the presence of varying external loads, inertia forces, muscle forces and postures/lifting techniques. In the case of extension or asymmetric exertions, for example, in the awkward postures encountered in the shoulder level jobs (e.g. painting, mechanical working on a car, in the well etc.), the high compressive forces considered in this study may not be reached.
The magnitude of lateral shear force is less accurate and more difficult to compute due to the modeling problems about the lines of actions of oblique and Latissmus dorsi muscles. Hence, the anteroposterior shear was taken as one fifth to one tenth of the acting compressive loading. The magnitude of the shear forces was limited to 1.2 kN based on earlier failure reports (Yingling and McGill 1999a,b). Despite the increasing trend to implicate shear forces as a major risk factor
in the lumbar spine, few biomechanical in vitro studies have investigated the role of shear loads. Frei et al. (2001, 2002) and Yingling and McGill (1999a) have subjected the lumbar motion segments of human and porcine, respectively, to shear forces up to failure. The large shear predicted in EMG-driven models also creates a concern as whether such large forces can be sustained safely.
The current study only presented the results of the
two most-relevant variables on the mechanical
response. However, the independent variables that affect the mechanical responses are often more than two. For example, the facet joint is recognized to be one of the most important components in constraining the motion segment in axial rotation. Hence, axial rotation should also have a significant effect on the facet joint forces. Nevertheless, sagittal motion and axial force were found to be the two most important variables influencing the facet joint forces. To improve the correlation between the response and the variables, it is possible to incorporate more variables that have considerable influence on a mechanical parameter. The presentation of the data and the subsequent interpretation of the outcomes would, however, become equally more complex and cumbersome than the current format.
Several limitations of this meta-model should be considered. First, no fracture or failure threshold was assigned for the numerical simulation and, hence, no fracture or rupture of the components was considered during the simulation. This may reduce the limitation of prediction of models at extreme loading conditions, since the load sharing is expected to be altered once failure initiates in a component. Second, the mechanical responses of vertebral bodies and endplates were not analyzed. The failure of a vertebral body and endplate has often been reported in burst fractures, i.e. high rate loading and under large compression loads. Third, the FE model is based on only one mesh with fixed geometry and material properties. Variations in the geometric/material properties influence the spine mechanics, an effect not considered in the current meta-models. More models should be analyzed to complete the full picture of risk factor analysis for the lumbar spine.
The current study provides an innovative and effective method in analyzing the multi input variables finite element model. Despite the advent of more powerful computers, meta models can always provide much needed insights into mechanics of the human spine in various conditions which is crucial for the design of more effective preventive, diagnostic and treatment procedures.
Acknowledgements
The study is partially supported by National Science Council, Taiwan (NSC 93-2320-B-002-030).
Figure 6. The contour plots of maximum AF strain (r2¼ 30.2%) w.r.t. sagittal rotation and axial compressive force. The correlation coefficient is noted to be too low in this case as no other two independent variables were found to improve this correlation value.
References
M. Argoubi and A. Shirazi-Adl, “Poroelastic creep response analysis of a lumbar motion segment in compression”, J. Biomech., 29(10), pp. 1331 – 1339, 1996.
B.A. Best, F. Guilak, L.A. Setton, W. Zhu, F. Saed-Nejad, A. Ratcliffe, M. Weidenbaum and V.C. Mow, “Compressive mechanical properties of the human anulus fibrosus and their relationship to biochemical composition”, Spine, 19(2), pp. 212 – 221, 1994.
G.E.P. Box and D.W. Behnken, “Some new three level designs for the study of quantitative variables”, Technometrics, 2, pp. 455 – 475, 1960.
G.E.P. Box and N.R. Draper, Emperical Model-Building and Response Surface, New York: Wiley, 1987.
J. Cholewicki, J.J. Crisco, 3rd, T.R. Oxland, I. Yamamoto and M.M. Panjabi, “Effects of posture and structure on three-dimensional coupled rotations in the lumbar spine. A biomechanical analysis”, Spine, 21(21), pp. 2421 – 2428, 1996.
H. Frei, T.R. Oxland, G.C. Rathonyi and L.P. Nolte, “The effect of nucleotomy on lumbar spine mechanics in compression and shear loading”, Spine, 26(19), pp. 2080 – 2089, 2001.
H. Frei, T.R. Oxland and L.P. Nolte, “Thoracolumbar spine mechanics contrasted under compression and shear loading”, J. Orthop. Res., 20(6), pp. 1333 – 1338, 2002.
J.W. Frymoyer, M.H. Pope, J.H. Clements, D.G. Wilder, B. MacPherson and T. Ashikaga, “Risk factors in low-back pain. An epidemiological survey”, J. Bone Joint Surg. Am., 65(2), pp. 213 – 218, 1983. R.C. Haut and R.W. Little, “A constitutive equation for collagen fibers”,
J. Biomech., 5(5), pp. 423 – 430, 1972.
J.C. Iatridis, L.A. Setton, M. Weidenbaum and V.C. Mow, “The viscoelastic behavior of the non-degenerate human lumbar nucleus pulposus in shear”, J. Biomech., 30(10), pp. 1005 – 1013, 1997. S. Li, Response of Human Intervertebral Disc to Prolonges Axial
Loading and Low-Frequency Vibration [Doctoral Dissertation], in Department of Mechanical Engineering, Chicago IL: University of Illinois at Chicago, 1994.
G. Matherton, “Principles of geostatistics”, Econ. Geol., 58, pp. 1246 – 1266, 1963.
M.D. McKay, W.J. Conover and R.J. Beckman, “A comparison of three methods for selection values of input variables in the analysis of output from a computer code”, Technometrics, 21, pp. 239 – 245, 1979.
D.S. McNally, M.A. Adams and A.E. Goodship, “Development and validation of a new transducer for intradiscal pressure measurement”, J. Biomed. Eng., 14(6), pp. 495 – 498, 1992.
Minitab User Guide R13, p20-5, p20-8
R.H. Myers and D.A. Montgomery, Response surface mothodology, New York: Wiley, 1995.
P. Neumann, T.S. Keller, L. Ekstrom, L. Perry, T.H. Hansson and D.M. Spengler, “Mechanical properties of the human lumbar anterior longitudinal ligament”, J. Biomech., 25(10), pp. 1185 – 1194, 1992. P. Neumann, T. Keller, L. Ekstrom, E. Hult and T. Hansson, “Structural
properties of the anterior longitudinal ligament. Correlation with lumbar bone mineral content”, Spine, 18(5), pp. 637 – 645, 1993.
P. Neumann, T.S. Keller, L. Ekstrom and T. Hansson, “Effect of strain rate and bone mineral on the structural properties of the human anterior longitudinal ligament”, Spine, 19(2), pp. 205 – 211, 1994. M. Panjabi, I. Yamamoto, T. Oxland and J. Crisco, “How does posture
affect coupling in the lumbar spine?”, Spine, 14(9), pp. 1002 – 1011, 1989.
M.M. Panjabi, T.R. Oxland, I. Yamamoto and J.J. Crisco, “Mechanical behavior of the human lumbar and lumbosacral spine as shown by three-dimensional load-displacement curves”, J. Bone Joint Surg. Am., 76(3), pp. 413 – 424, 1994.
M.J. Pearcy and S.B. Tibrewal, “Axial rotation and lateral bending in the normal lumbar spine measured by three-dimensional radiography”, Spine, 9(6), pp. 582 – 587, 1984.
M. Pearcy, I. Portek and J. Shepherd, “Three-dimensional X-ray analysis of normal movement in the lumbar spine”, Spine, 9(3), pp. 294 – 297, 1984.
J. Sacks, W. Welch, T. Mitchell and H. Wynn, “Design and analysis of computer experiment”, Stat. Sci., 4, pp. 409 – 435, 1989.
A. Shirazi-Adl and G. Drouin, “Load-bearing role of facets in a lumbar segment under sagittal plane loadings”, J. Biomech., 20(6), pp. 601 – 613, 1987.
A. Shirazi-Adl, A.M. Ahmed and S.C. Shrivastava, “A finite element study of a lumbar motion segment subjected to pure sagittal plane moments”, J. Biomech., 19(4), pp. 331 – 350, 1986.
J.L. Wang, M. Parnianpour, A. Shirazi-Adl and A.E. Engin, “The review and evaluation of viscoelastic models for collagen fiber during constant strain rate loading”, Biomed. Eng. Appl. Basis, Commun., 9, pp. 5 – 19, 1997a.
J.L. Wang, M. Parnianpour, A. Shirazi-Adl and A.E. Engin, “Failure criterion of collagen fiber: viscoelastic behavior simulated by using load control data”, Theor. Appl. Frac. Mech., 27(1), pp. 1 – 12, 1997c. J.L. Wang, M. Parnianpour, A. Shirazi-Adl, A.E. Engin, S. Li and A. Patwardhan, “Development and validation of a viscoelastic finite element model of an L2/L3 motion segment”, Theor. Appl. Frac. Mech., 28(1), pp. 81 – 93, 1997b.
J.L. Wang, M. Parnianpour, A. Shirazi-Adl and A.E. Engin, “The dynamic response of L(2)/L(3) motion segment in cyclic axial compressive loading”, Clin. Biomech. (Bristol, Avon), 13(1 Suppl 1), pp. S16 – S25, 1998.
J.L. Wang, M. Parnianpour, A. Shirazi-Adl and A.E. Engin, “Viscoelastic finite-element analysis of a lumbar motion segment in combined compression and sagittal flexion. Effect of loading rate”, Spine, 25(3), pp. 310 – 318, 2000.
W.J. Welch, T.K. Yu, S.M. Kang and J. Sacks, “Computer experiments for quality control by parameter design”, J. Qual. Technol., 22, pp. 15 – 22, 1990.
I. Yamamoto, M.M. Panjabi, T. Crisco and T. Oxland, “Three-dimensional movements of the whole lumbar spine and lumbosacral joint”, Spine, 14(11), pp. 1256 – 1260, 1989.
V.R. Yingling and S.M. McGill, “Mechanical properties and failure mechanics of the spine under posterior shear load: observations from a porcine model”, J. Spinal Disord., 12(6), pp. 501 – 508, 1999. V.R. Yingling and S.M. McGill, “Anterior shear of spinal motion
segments. Kinematics, kinetics, and resultant injuries observed in a porcine model”, Spine, 24(18), pp. 1882 – 1889, 1999.