Prevalence and psychosocial risk factors of upper extremity musculoskeletal pain in industries of Taiwan: A nationwide study
8
0
0
全文
(2) 312. Special attention was focused on psychosocial factors in the workplace after controlling other determinants.. Material and Methods Study subjects The present study was based on the database of the national survey on Employee’s Perception on Safety and Health in the Work Environment. This broad-scale survey was conducted by the Institute of Occupational Safety and Health (IOSH) in Taiwan under the guidance and assistance from Directorate-General of Budget, Accounting and Statistics. Taking advantage of the enormous manpower supported by the agency, which has about 500 trained interviewers throughout Taiwan, a twostage stratified random sampling was conducted and a total of 18,120 employees were successfully interviewed by personal visit during September 20–30 in 1998. In the first stage, all of the districts in urban areas and the villages in rural areas were grouped into 24 strata according to their levels of urbanization. Secondly, households were randomly selected from each stratum. For the sampled households, residents working as paid employees during the time of this survey were identified and interviewed by trained interviewers with standardized questionnaires about workers’ perceptions on safety and hazards in the work place as well as health problems, medicine-seeking attitude, working environment and demographic characteristics, etc. As the mining, electricity, gas, and water industries covered fewer than 2.4% of all workers, they were not included. Thus, a total of 17,669 subjects were included in the final data analysis. Questionnaire The questionnaire used was firstly constructed by the IOSH from the experts’ focus group for the 1988 survey, and modified in the present study for a more comprehensive scope of employees’ subjective assessment of the work environment and their own physical and psychological conditions over the year prior to the questionnaire administration11). The questions regarding subjective musculoskeletal pain originated from the Nordic musculoskeletal questionnaire13). With reference to an illustrated body chart, the subject was asked if he-she had experienced the musculoskeletal soreness or pain of the upper extremities (UE), including the neck, shoulder, upper back, elbow, wrist and hand during the past 1 year. If the answer was ‘yes’, the way of dealing with the symptoms such as (1) seeking treatment from physician or traditional Chinese medicine, or (2) self care with over-the-counter drugs, or (3) non-treatment and others was further assessed by a categorical scale as well. Classification of psychosocial factors in the workplace The psychosocial condition was evaluated in terms of. J Occup Health, Vol. 47, 2005. job stress, comfort of working environment, satisfaction with safety and hygiene at the work site, and so on. First, each study subject was asked to identify their own major sources of stress at work, if any, by a nominal scale. All the answers were classified into 4 domains: problems with job content (i.e., heavy workload, monotonous task, lack of career prospects), poor physical working conditions, problems of relationship with co-workers or supervisors, organizational problems (i.e., evaluation and promotion policies for performance, provision for vacation or sick leave, lack of in-service training, dissatisfaction with salary, benefit or welfare). Then another two psychosocial factors about the working environment were also classified by the Likert scale in 5 levels. For the safety and hygiene of the workplace, the subjects who felt “very satisfied” or “satisfied” were combined as one level, and those who felt “very unsatisfied” or “unsatisfied” were also grouped together in another level, while the others who choose the answer “neither good nor bad” were classified as the intermediate level. For the second question regarding the working environment, the subjects who felt their working environment “comfortable” or “very comfortable” were combined as one category, while those who felt their workplace “uncomfortable” or “very uncomfortable” were grouped together in another level. Because relatively few subjects chose the option “neither good nor bad”, they were merged with the “comfortable” group described above. Data analysis In order to improve the specificity, subjects were scrutinized according to two main criteria: (1) the existence of self-reported UE musculoskeletal pain, and (2) whether or not the affected worker sought any medical treatment. Thus, study participants were categorized into groups of either having UE symptoms and seeking treatment, UE symptoms only, or being asymptomatic on the basis of self-report. Here only the subjects who met the aforementioned two criteria were defined as the cases, and the other were controls. The categorization of industries was done according to the Standard Industrial Classification System of the Republic of Taiwan (SICSROC)14), which is as the same as the international classification system. All subjects from 11 industry categories were further summarized into 6 main industry codes, i.e., manufacturing, service industry (including trade, accommodation, food service, finance, insurance, real estate, etc.), public administration, construction, transportation, storage and communication, and agriculture-related industries (including agriculture, forestry, fishing and animal husbandry). Furthermore, age was also classified into 5 strata in order to determine the age-modifying effect, i.e., <26, 26–35, 36–45, 46– 55, and > 55 yr old. Multiple logistic regression analysis was performed to assess the independent and interactive.
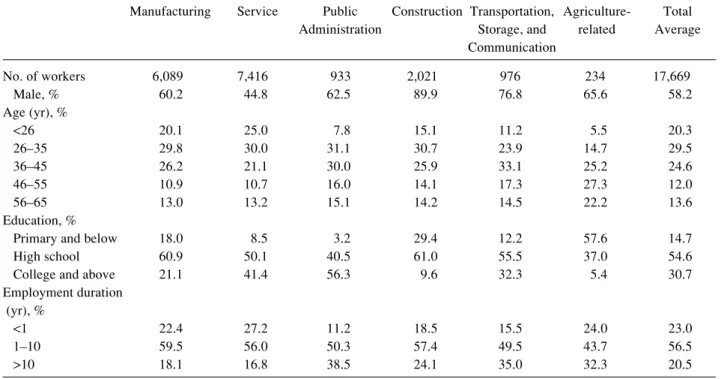
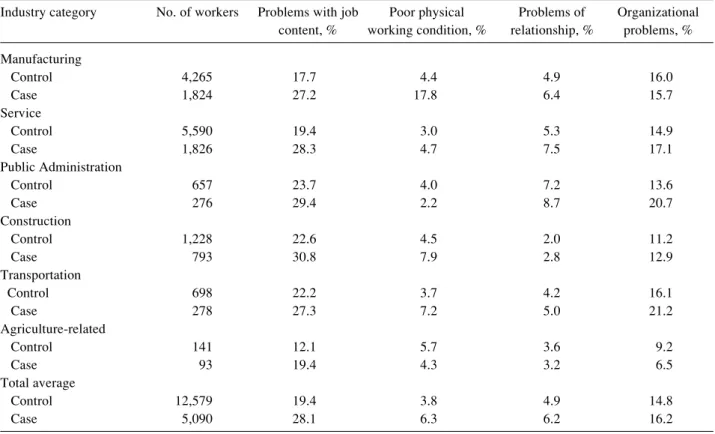
(3) Hsin-Yi LEE, et al.: Prevalence and Psychosocial Risk Factors of Musculoskeletal Pain. 313. Table 1. Demographics of the study subjects Manufacturing. No. of workers Male, % Age (yr), % <26 26–35 36–45 46–55 56–65 Education, % Primary and below High school College and above Employment duration (yr), % <1 1–10 >10. Service. Public Construction Transportation, AgricultureAdministration Storage, and related Communication. Total Average. 6,089 60.2. 7,416 44.8. 933 62.5. 2,021 89.9. 976 76.8. 234 65.6. 17,669 58.2. 20.1 29.8 26.2 10.9 13.0. 25.0 30.0 21.1 10.7 13.2. 7.8 31.1 30.0 16.0 15.1. 15.1 30.7 25.9 14.1 14.2. 11.2 23.9 33.1 17.3 14.5. 5.5 14.7 25.2 27.3 22.2. 20.3 29.5 24.6 12.0 13.6. 18.0 60.9 21.1. 8.5 50.1 41.4. 3.2 40.5 56.3. 29.4 61.0 9.6. 12.2 55.5 32.3. 57.6 37.0 5.4. 14.7 54.6 30.7. 22.4 59.5 18.1. 27.2 56.0 16.8. 11.2 50.3 38.5. 18.5 57.4 24.1. 15.5 49.5 35.0. 24.0 43.7 32.3. 23.0 56.5 20.5. effects of all the psychosocial factors and the potential confounding factors (i.e., age, education and employment duration) for male and female workers separately. However, most of the interactions were not significant and they were not included in the final regression models. All data analysis was performed using the Statistical Analysis System (SAS) package, version 6.1215).. Results Demographics of the study subjects The basic demographics characteristics of the 17,669 subjects (response rate=85.3%) are summarized in Table 1. It was noted that the gender composition varied widely among the six industry categories, i.e. the percentage of male workers ranged from 89.9% for the construction industry to 44.8% for the service industry. As to the distribution of age and education level, most workers in agriculture-related industries were older than 45 yr and had only received primary education or below. The main workforce of other industries was aged below 45 yr and had received education of high school level or higher. Prevalence of UE musculoskeletal pain Ta b l e 2 s u m m a r i z e s t h e p r e v a l e n c e o f U E musculoskeletal pain of the workers fulfilling the two aforementioned criteria and also those workers with the symptoms only. In general, the most susceptible UE body parts of musculoskeletal pain were the shoulder and neck region, followed by the wrist and hand. For all industries, higher prevalence rates were observed in the hand. (21.4%), shoulder (18.9%), and neck (16.4%) than the elbow (14.3%) and upper back (9.2%) when the two criteria were simultaneously met. Among the six main industry categories, workers of the construction and agriculture-related industries were recognized as highrisk groups for most UE musculoskeletal pains, except in the neck region. The highest prevalence in the neck region was reported in public administration (19.1%) and the construction industry (17.9%). Job stress in the workplace As shown in Table 3, for the UE pain cases, problem with job content or lack of career prospects (28.1%) seemed to be the most frequently expressed job stressor across the industrial categories, followed by organizational problems (16.2%). However, it was noted that the job stress of poor physical working conditions also played a significant role for musculoskeletal pain among workers in manufacturing industry (17.8%). For the service industry and public administration, in which workers had a greater opportunity for direct contact with customers, the percentages of having problems of relationship with co-workers or supervisors were higher than other industries. The reported rate was 7.5% for the general service industry and 8.7% for public administration. Overall, case subjects appeared to declare existence of job stress more frequently than control ones. Risk factors for UE Musculoskeletal pain Table 4 summarizes the results of logistic regression.
(4) 314. J Occup Health, Vol. 47, 2005. Table 2. Prevalence of UE musculoskeletal pain by industry category Industry category Manufacturing Symptoms only Symptoms + Medical Treatment Service Symptoms only Symptoms + Medical Treatment Public Administration Symptoms only Symptoms + Medical Treatment Construction Symptoms only Symptoms + Medical Treatment Transportation Symptoms only Symptoms + Medical Treatment Agriculture-related Symptoms only Symptoms + Medical Treatment Total average Symptoms only Symptoms + Medical Treatment. Neck. Shoulder. Upper back. Elbow. Hand & wrist. 23.3 14.4. 25.7 16.5. 10.4 6.6. 12.5 8.5. 20.4 13.6. 24.0 13.7. 25.9 14.8. 11.2 6.6. 10.7 6.8. 16.8 10.2. 29.1 19.1. 28.2 18.5. 12.6 7.9. 10.2 6.8. 14.3 10.1. 27.2 17.9. 32.6 22.1. 15.1 10.0. 19.9 13.9. 26.7 18.6. 26.5 14.9. 30.0 16.9. 13.0 7.5. 11.6 6.9. 15.7 9.3. 24.4 16.4. 26.9 18.9. 13.9 9.2. 17.2 14.3. 28.6 21.4. 24.5 14.8. 26.9 16.6. 11.6 7.1. 12.5 8.3. 19.1 12.4. Table 3. Frequencies of major job stressors among workers by industry category Industry category. Manufacturing Control Case Service Control Case Public Administration Control Case Construction Control Case Transportation Control Case Agriculture-related Control Case Total average Control Case aCase. No. of workers. Problems with job Poor physical content, % working condition, %. Problems of relationship, %. Organizational problems, %. 4,265 1,824. 17.7 27.2. 4.4 17.8. 4.9 6.4. 16.0 15.7. 5,590 1,826. 19.4 28.3. 3.0 4.7. 5.3 7.5. 14.9 17.1. 657 276. 23.7 29.4. 4.0 2.2. 7.2 8.7. 13.6 20.7. 1,228 793. 22.6 30.8. 4.5 7.9. 2.0 2.8. 11.2 12.9. 698 278. 22.2 27.3. 3.7 7.2. 4.2 5.0. 16.1 21.2. 141 93. 12.1 19.4. 5.7 4.3. 3.6 3.2. 9.2 6.5. 12,579 5,090. 19.4 28.1. 3.8 6.3. 4.9 6.2. 14.8 16.2. is subjects who reported UE musculoskeletal pain and sought medical treatment; other are Control..
(5) 1.3 (1.1–1.7). Organizational problem vs no stress. Uncomfortable vs comfortable. Unsatisfied vs satisfied. Abbreviation: M for male, F for female. 1.4 (1.2–1.7) 1.5 (1.0–2.2). Intermediate vs satisfied. Safety and hygiene of the job. 1.7 (1.2–2.5). 1.7 (1.2–2.3). Relationship vs no stress. Working environment. 2.0 (1.7–2.4) 2.2 (1.7–3.0). Job content vs no stress. Physical working condition vs no stress. Job stress. 1.2 (0.9–1.4 1.4 (1.1–1.8). 1–10 vs <1. 2.6 (1.6–4.2). 1.6 (1.3–2.0). 1.3 (0.8–2.2). 1.4 (1.1–1.8). 2.5 (1.6–3.7). 2.0 (1.3–3.0). 2.1 (1.6–2.6). 1.3 (0.9–1.8). 1.4 (1.1–1.7). 0.6 (0.5–0.9). 0.4 (0.3–0.5). >10 vs <1. Employment duration (yr). College vs primary. High school vs primary. 1.7 (1.2–2.5) 1.3 (0.9–1.8) 0.8 (0.6–1.0). >55 vs <26. 1.2 (0.9–1.6) 1.8 (1.4–2.4). 0.6 (0.5–0.8). 1.8 (1.3–2.6) 2.0 (1.5–2.8). 46–55 vs <26. Education level. 1.5 (1.1–1.9) 1.9 (1.5–2.5). 26–35 vs <26. Manufacturing M (3,660) F (2,429). 36–45 vs <26. Age (yr). Risk Factors Gender (numbers). 1.7 (1.1–2.8). 1.2 (0.9–1.4). 1.3 (0.8–2.1). 1.6 (1.3–2.1). 2.2 (1.6–3.0). 1.5 (0.9–2.3). 1.9 (1.5–2.3). 1.8 (1.3–2.3). 1.1 (0.9–1.4). 0.5 (0.4–0.7). 0.7 (0.5–1.0). 1.6 (1.2–2.2). 1.1 (0.8–1.6). 1.2 (0.9–1.6). 1.7 (1.1–2.6). 1.3 (1.1–1.5). 2.3 (1.5–3.7). 1.6 (1.3–1.9). 1.9 (1.4–2.5). 2.0 (1.4–3.0). 2.0 (1.7–2.4). 1.4 (1.1–1.9). 1.4 (1.1–1.6). 0.8 (0.6–1.1). 0.9 (0.7–1.2). 2.2 (1.7–2.9). 3.0 (2.2–4.0). 2.0 (1.5–2.5). 1.5 (1.2–1.9). Service F (4,103). 1.3 (0.8–1.4). M (3,313). 1.2 (0.3–4.1). 2.0 (1.3–3.0). 1.5 (0.5–5.0). 1.7 (1.0–2.9). 1.3 (0.6–2.6). 0.7 (0.2–2.2). 1.2 (0.7–2.0). 1.7 (0.8–3.8). 1.4 (0.6–2.9). 1.1 (0.4–3.3). 1.6 (0.5–4.9). 2.7 (0.8–8.9). 3.3 (0.9–11). 3.3 (1.0–10.7). 2.5 (0.8–7.7). 2.0 (0.4–10.5). 1.3 (0.7–2.2). 2.1 (0.2–21.3). 2.6 (1.3–5.2). 2.5 (0.9–6.6). 0.6 (0.1–3.8). 2.2 (1.2–4.1). 2.9 (1.2–6.9). 1.7 (0.7–3.8). 0.4 (0.1–1.7). 0.5 (0.1–2.4). 2.5 (0.8–7.9). 4.1 (1.3–12.7). 1.5 (0.5–4.2). 1.9 (0.7–5.3). Administration M (581) F (352). 1.1 (0.8–1.7). 1.0 (0.8–1.3). 1.5 (1.0–2.1). 1.6 (1.1–2.1). 3.3 (1.7–6.7). 2.5 (1.7–3.9). 1.8 (1.5–2.3). 1.1 (0.8–1.6). 1.1 (0.8–1.5). 0.2 (0.1–0.4). 0.7 (0.5–0.9). 1.5 (1.0–2.3). 2.6 (1.7–4.0). 1.8 (1.3–2.6). 1.7 (1.2–2.4). 3.0 (1.4–6.4). 1.5 (1.0–2.2). 0.7 (0.3–1.6). 1.9 (1.2–3.0). 1.9 (0.8–4.2). 2.2 (1.1–4.6). 1.6 (1.1–2.5). 1.7 (0.9–3.2). 2.2 (1.2–4.0). 0.3 (0.1–0.4). 0.8 (0.5–1.2). 1.3 (0.6–3.1). 2.1 (0.9–4.9). 1.4 (0.6–3.0). 0.9 (0.4–2.1). Construction Transportation M (1,814) M (751). Table 4. Odds ratios (with 95% confidence intervals in parentheses) calculated from multiple logistic regressions for developing musculoskeletal pain in the upper extremity stratified by gender and category of industries. Hsin-Yi LEE, et al.: Prevalence and Psychosocial Risk Factors of Musculoskeletal Pain 315.
(6) 316. analysis on the risk factors for the musculoskeletal pain among male and female workers after adjusting for age, education level and employment duration at the present company. When workers of all industries were studied as a whole, the significant risk factors related to UE musculoskeletal pain included greater job stress, the feeling of an uncomfortable working environment, and dissatisfaction with the safety and hygiene in the workplace. The odds ratios for job stressors, including problems with job content, poor physical working condition, and relationships with co-workers or supervisor were all greater than 1.5 (all of them p<0.0001). For the manufacturing and service industries, job stress as well as safety and hygiene of the job were significantly associated with musculoskeletal pain. Interestingly, in manufacturing industry the problem of relationship (OR=2.5, 95% CI: 1.6 to 3.7) and dissatisfaction with the safety and hygiene of the workplace (OR=2.6, 95% CI 1.6 to 4.2) showed a stronger influence in female workers than male workers, whereas in the service industry, job stress from physical working conditions (OR=2.0, 95% CI 1.4 to 3.0) and uncomfortable working environments demonstrated significant influence for female workers but not male workers. For public administration, problems with job content or lack of career prospects (OR=2.2, 95% CI 1.2 to 4.1) and organizational problems (OR=2.6, 95% CI 1.3 to 5.2) were recognized as the important risk factors for female workers. For the construction industry, job stress due to having problems with poor physical working conditions (OR=2.5, 95% CI 1.7 to 3.9) and relationships with co-workers or supervisors (OR=3.3, 95% CI 1.7 to 6.7) were the major risk factors of UE musculoskeletal pains for male workers. For the transportation and communication industries, problems with poor physical working conditions (OR=2.2, 95% CI 1.1 to 4.6) and dissatisfaction with safety and hygiene in the workplace (OR=3.0, 95% CI 1.4 to 6.4) were the strongest factors for male workers. Because of small numbers of subjects in agriculture-related industry and female workers in construction and transportation industries, none of the aforementioned determinants were significantly associated to the reported musculoskeletal pain and they were omitted from Table 4.. Discussion The study subjects were sampled nation-wide under a two-stage, stratified sampling design and the questionnaire response rate was as high as 85.1%. Accordingly, we believe that the sample is probably representative for making inferences about the prevalence of UE musculoskeletal pains among different industries. Moreover, because the questionnaire interviews were conducted by well-trained interviewers, the possibility of misunderstanding of the questions during the interview. J Occup Health, Vol. 47, 2005. was minimized. Besides, two criteria were set during data analysis in order to select those workers with definite pain and seeking treatment. Thus, the estimated prevalence of UE musculoskeletal pain was probably more conservative and reliable. The following limitations shall be discussed, however. First, since it is generally difficult to assess individual biomechanical loading accurately through a questionnaire, the present study only focused on variables related to psychosocial stress, work environment conditions and organization, which were readily accessible through subjective assessment. In addition, due to the nature of self-reported data, the survey may not have comprehensively distinguished work-related musculoskeletal problems from those unrelated to work; this is also a common problem encountered in other epidemiologic studies16). Hence we deliberately avoided the use of the term “work-related” when presenting the prevalence in this study. Moreover, because of the crosssectional design in the this study, we should be cautious in drawing any conclusion about a causal relationship between UE musculoskeletal pain and risk factors at work, especially regarding psychosocial factors. Nevertheless, with the regression model for data analysis, we were able to control the potential confounding effects of age, education and employment duration to some degree, which might reconcile the disadvantages in the cross-sectional study. The present study also showed that the prevalence rate of musculoskeletal pain was, to some extent, consistent with each industry’s job characteristics. For instance, both agriculture-related and construction industries, which are characterized with more heavy manual work, were found to be in the high-risk category for all parts of UE musculoskeletal pain. The sedentary work related to sustained postures or monotonous movements in public administration only showed higher prevalence rates of neck and shoulder pain as compared with other industries. Compared with a similar national survey conducted in 199417), the prevalence rates of neck, shoulder, hand and wrist problems defined as “symptoms only” in the present study were generally higher than reported previously (ranged from 10.3% to 17.3%), which implies an increase of UE musculoskeletal problems in the Taiwanese working population during these years. On the other hand, the 1-year prevalence rate of 24.5% self-reported neck complaint was slightly less than those reported from European member states, which were approximately 28%1). Moreover, both surveys showed the same trend of higher prevalence rates for musculoskeletal pains in the neck and shoulder regions than those of elbows and wrists/hands. We examined the reported frequencies of job stressors, and the problems with job content and organization-related problems seemed to persist as compared with the previous.
(7) Hsin-Yi LEE, et al.: Prevalence and Psychosocial Risk Factors of Musculoskeletal Pain. survey18), which is consistent with both the demand-control theory19–22) and the effort-reward theory23, 24). However, this study disclosed two more factors, problem of relationships with co-workers or supervisors and physical working conditions, as significant job stressors in different industries. The independent association between poor interpersonal relationships at the workplace and UE musculoskeletal complaints in manufacturing, construction and service industries appeared to be consistent with the demand-control theory, while the significant impact of physical condition reminded us that biomechanical factors should always be considered, as shown in the manufacturing, construction and transportation industries in Table 4. Because our study did not ask detailed organization problems or conduct direct biomechanical measurement at the worksite, we were unable to test other theories summarized in the reviews by Huang25) and Bongers26). Future studies should consider the characteristics of different industries and collect more detailed information to test specific theories. A gender difference in association between psychosocial factors and UE musculoskeletal pain was also found in the manufacturing, service and administration industries. For example, working environment was a strong determinant for male workers in manufacturing industry and for female workers in service industry. It is probably due to the traditional Taiwanese culture in manufacturing that the male workers are more easily assigned to jobs with heavier and dirtier or more uncomfortable physical working conditions than female workers. As there are fewer heavy and dirty jobs in the service industry, the problem of poor working environment becomes less apparent for male workers. Meanwhile, female workers in the service industry showed concern in all the studied psychosocial factors except for those who worked in public administration, for whom the problem of job content or lack of career prospect might be more frequently encountered and for whom relationships with supervisor and co-workers became more important, too. It is also worthwhile to emphasize social support as an important factor among Taiwanese workers, which is similar to findings reported in Japan 27, 28). In these countries, which are influenced by oriental culture, people are probably more family-bound or society-oriented than westerners29). It might indicate that workers in Taiwan have some tendency to sacrifice personal interest for the interpersonal harmony of a group rather than to argue aggressively with his/her families and/or colleagues30). Therefore, this culture might drive people to express more concern about interpersonal relationships with supervisors and co-workers rather than other sources of job stress31). Here, any conflict occurring in the workplace is frequently thought of as interpersonal conflict rather than concern on a particular issue32). Thus, the resulting suffering from. 317. poor interpersonal relationships might be even more detrimental to one’s psychological well-being in Taiwanese society. More studies are needed to explore the role of cultural influence on the development of musculoskeletal disorders, especially on the differences and similarities between western and far eastern countries.. Conclusions Workers of the construction industry and agriculturerelated industries were most susceptible to UE musculoskeletal pain. After adjustment for age, education level and duration of employment, job stress due to job content, physical working condition organizational problems as well as dissatisfaction with safety and hygiene in the workplace were significantly associated with developing UE musculoskeletal pain. The interpersonal relationships with co-workers and supervisors should also be considered and strongly emphasized in occupational health promotion programs in workplace. Acknowledgments: The study was supported by the Institute of Occupational Safety and Health (IOSH88H309), Council of Labor Affairs and National Health Research Institute (NHRI-EX93-9204PP), Taiwan.. References 1). 2). 3). 4). 5). 6). 7). 8). PW Buckle and JJ Devereux: The nature of workrelated neck and upper limb musculoskeletal disorders. Appl Ergon 33, 207–217 (2002) US National Research Council and the Institute of Medicine. Musculoskeletal Disorders and the Workplace: Low Back and Upper Extremities. Panel on Musculoskeletal Disorders and the Workplace. Washington, DC: National Academy Press, 2001. US National Institute for Occupational Safety and Health. Research topics for the next decade (NORA): A report by the NORA Musculoskeletal Disorders team. Cincinnati, OH: National Institute for Occupational Safety and Health, 2001. US National Institute of Occupational Safety and Health (NIOSH). Musculoskeletal disorders and workplace factors: a critical review of epidemiologic evidence for work-related musculoskeletal disorders of the neck, upper extremity, and low back. Cincinnati, OH: NIOSH, 1997. M Aptel, A Aublet-Cuvelier and JC Cnockaert: Workrelated musculoskeletal disorders of the upper limb. Joint Bone Spine 69, 546–555 (2002) US Commission on Behavior and Social Sciences and Education. Work-related Musculoskeletal Disorders: Report, Workshop Summary, and Workshop Papers. Washington, DC: National Academy Press, 1999. Buckle PW, Devereux J. Work-related Neck and Upper Limb Musculoskeletal. Bilbao, Spain: European Agency for Safety and Health at Work, 1999. P Cote, JD Cassidy and L Carroll: The Saskatchewan.
(8) 318. 9) 10). 11). 12). 13). 14). 15) 16). 17). 18). 19). 20). J Occup Health, Vol. 47, 2005. Health and Back Pain Survey. The prevalence of neck pain and related disability in Saskatchewan adults. Spine 23, 1689–1698 (1998) G Bovim, H Schrader and T Sand: Neck pain in the general population. Spine 19, 1307–1309 (1994) Directorate-General of Budget Accounting and Statistics. Social Indicators: Average Monthly Working Hours of Employees in 1998. Taipei, Taiwan: Executive Yuan of Republic of China, 2003. Institute of Occupational safety and Health (IOSH). Employees’ perceptions of safety and health problems in the workplace in 1998. Taipei, Taiwan: ROC council of Labor Affairs, 1998. YC Chang and JD Wang: Trends in major occupational injuries in different industrial divisions in Taiwan during 1983–1993. J. Occup Health 39, 295–301 (1997) K Palmer, G Smith, S Kellingray and C Cooper: Repeatability and validity of an upper limb and neck discomfort questionnaire: the utility of the standardized Nordic questionnaire. Occup Med (Lond) 49, 171–175 (1999) Directorate-General of Budget, Accounting, and Statistics. Standard Industrial Classification System and Standard Occupational Classification System of the Republic of China. Taipei, Taiwan: ROC Department of Statistics, 2001. SAS Institute. SAS Windows v.6.12. NC, USA: SAS Institute, 1989. US National Research Council (NRC). Musculoskeletal Disorders and the Workplace: Low Back and Upper Extremities. Washington, DC: National Academy Press, 2001. HR Guo, YC Chang, WY Yeh, CW Chen and YL Guo: Prevalence of musculoskeletal disorder among workers in Taiwan: a nationwide study. J Occup Health 46, 26– 36 (2004) YW Cheng, YL Guo and WY Yeh: A national survey of psychosocial job stressors and their implications for health among working people in Taiwan. Int Arch Occup Environ Health 74, 495–504 (2001) L Levi, M Bartley, M Marmot, R Karasek, T Theorell, J Siegrist, R Peter, K Belkic, C Savic, P Schnall and P Landsbergis: Stressors at the workplace: theoretical models. Occup Med 15, 69–106 (2000) T Theorell and RA Karasek: Current issues relating to psychosocial job strain and cardiovascular disease research. J Occup Health Psychol 1, 9–26 (1996). 21) LA MacDonald, RA Karasek, L Punnett and T Scharf: Covariation between workplace physical and psychosocial stressors: evidence and implications for occupational health research and prevention. Ergonomics 44, 696–718 (2001) 22) R Karasek, C Brisson, N Kawakami, I Houtman, P Bongers and B Amick: The Job Content Questionnaire (JCQ): an instrument for internationally comparative assessments of psychosocial job characteristics. J Occup Health Psychol 3, 322–355 (1998) 23) R Peter and J Siegrist: Chronic psychosocial stress at work and cardiovascular disease: the role of effortreward imbalance. Int J Law Psychiatry 22, 441–449 (1999) 24) J Siegrist: Adverse health effects of high-effort/lowreward conditions. J Occup Health Psychol 1, 27–41 (1996) 25) GD Huang, M Feuerstein and SL Sauter: Occupational stress and work-related upper extremity disorders: concepts and models. Am J Ind Med 41, 298–314 (2002) 26) PM Bongers, AM Kremer and J ter Laak: Are psychosocial factors, risk factors for symptoms and signs of the shoulder, elbow, or hand/wrist?: A review of the epidemiological literature. Am J Ind Med 41, 315–342 (2002) 27) D Fujita and M Kanaoka: Relationship between social support, mental health and health care consciousness in developing the industrial health education of male employees. J Occup Health 45, 392–399 (2003) 28) M Watanabe, M Irie and F Kobayashi: Relationship between effort-reward imbalance, low social support and depressive state among Japanese male workers. J Occup Health 46, 78–81 (2004) 29) KK Huang: face and favor: the Chinese power game. Am J Sociol 92, 945–974 (1987) 30) G Lai: Work and family roles and psychological wellbeing in urban China. J Health Soc Behav 36, 11–37 (1995) 31) MJ Yang, CK Ho, YC Su and MS Yang: Job strain, social support and mental health: a study on the male heavy manufacturing workers. Kaohsiung J Med Sci 13, 332–341 (1997) 32) Wu HM, Hwang KK. Strategies for Resolving Interpersonal Conflict in Chinese Society: A Comparison between REBT and Relational Approaches [dissertation]. 2003 (in Chinese).
(9)
數據

相關文件
The aim of this study was to investigate, through a prospective clinical study, the prevalence and characteristics of oral lichen planus (OLP) and lichenoid lesions (OLL) in
As regards the two main industries in manufacturing, namely manufacture of textiles and manufacture of wearing apparel, their gross output, gross value added and the structure of
As regards the two main industries in manufacturing, namely manufacture of textiles and manufacture of wearing apparel, their gross output, gross value added and the structure of
Article 40 and Article 41 of “the Regulation on Permission and Administration of the Employment of Foreign Workers” required that employers shall assign supervisors and
To offer foreign fisherman employed to work in Taiwan sounder care and impose obligations on employers to manage foreign fishermen for the purpose of improving their
Employment of Foreign Workers, overseas Chinese students shall meet the student status regulated in the Regulations on Study and Counseling Assistance in Taiwan for
In order to apply for a permit to employ Class B Foreign Worker(s), an Employer shall provide reasonable employment terms and register for such employment demands with local
Should an employer find it necessary to continue the employment of the Class A Foreign Worker(s), the employer shall, within four (4) months prior to the expiration of the
