Materials Chemistry and Physics 56 (1998) 157-162
The effects of microstructure on the mechanical properties of
A1203-NiAl composites
W.H. Tuan”, W.B. Chou, H.C. You, S.T. Chang
Institute of hf~~lerials Science nrld Engineering, Nntional Tai~tm~ Unh~ersi&, Taipei 10764, Tai\~ymReceived 30 October 1997: received in revised form 8 May 1998: accepted 11 May 1998
Abstract
In the present study, the room-temperature mechanical properties of Al,O,-NiAl composites containing 0 to 100 vol.‘% NiAl an determined.
The composites are prepared by attrition milling A1203 and NiAl powders together followed by hot-pressing in vacuum. The Al,O, and NM
grains in the composites constrain each other’s growth. Since the hardness of NiAl is lower than that of A&O,, the hardness of the composites decreases with the increase of NiAl content. The strength and toughness of the A1203-NiAl composites are higher than the values predicted
by the rule of mixtures. The strengthening effect is mainly contributed by the microstructural refinement. Because the Al,03/NiA1 interface
is weak, cracks propagate mainly along the interfaces. The fracture toughness is thus enhanced. 0 1998 Elsevier Science S.A. Allrights
reserved.
Ke,nrords; Composite materials; Microstructure
1. Introduction
Alumina, A1203, is superior for its hardness, chemical sta-
bility and refractory character. However, the applications of alumina as a structural component are often limited by its brittleness. By adding metallic reinforcements, such as Al,
Ni and Ag [ l-31, the toughness of alumina can be signifi-
cantly improved. However, several disadvantages are asso-
ciated with this approach. These disadvantages are:
1. Although the mechanical properties of alumina can be increased with increasing metal content, the metal content that can be added is limited by the poor wetting of metallic melt on ceramics [ 2,3].
2. The oxidation and corrosion resistance of metals are poorer than those of oxides. The chemical stability of alumina is thus degraded as metallic reinforcements are added [ 41.
3. The creep resistance of the ceramic may also suffer from the addition of low-melting-point metals.
These shortcomings have to be overcome first before metal-
toughened alumina can be employed successfully.
Nickel aluminide, NiAl, is a potential high-temperature material. The melting point of NiAl is 164O”C, which is about 300°C higher than that of Ni-based superalloys. The thermal conductivity of NiAl is three to eight times that of Ni-based
x Corresponding author.
superalloys [ 5,6]. Furthermore, the density of NiAl is lower than that of superalloys. The oxidation and corrosion resis- tance are also better than those of superalloy. Nevertheless,
the toughness of NiAl is relatively low compared to other
metals. The applications of NiAl at room temperature are
therefore limited. A recent study suggested that the toughness
and strength of NiAl can be improved by adding 20 vol.% zirconia particles [ 71.
In the present study, Al,O,-NiAl composites containing
O-100 vol.% NiAl have been prepared. The microstructures
of the composites are investigated in detail. The mechanical
properties, such as hardness, strength and toughness, of the
composites at room temperature are also determined. Since
both A1203 and NiAl are brittle, the mechanical properties of
monolithic Al,O,, NiAl and Al,O,-NiAl composites can be
measured with the same techniques. The strengthening and
toughening effects of the composites can then be correlated
to their microstructures.
2. Experimental procedure
Alumina (TM-DR, 0.2 p.m, Taimei Chem., Tokyo, Japan)
and various amounts of nickel aluminide ( NiAl. Xform, New
York, USA) were attrition milled together in ethyl alcohol. The milling time was 1 h. The grinding medium used was
0X%0584/98/$ see front matter Q 1998 Elsevier Science S.A. All rights reserved. PUSO254-05&4(98)00168-O
158 W.H. Tuan et al. /Materials Chemistry and Physics 56 (1998) 157-162
zirconia (ZrO,) balls. The particle size and its distribution were determined with a laser particle-size analyser (LS 230, Coulter, USA). During the analysis of particle size, a disper- sant (Dar-van C, R.T. Vanderbilt, USA) and ultrasonic treat- ment were used to disperse the powder and powder mixtures in water. The morphology of NiAl particles was observed with scanning electron microscopy (SEM). The morphology of the NiAl particles in the powder mixtures was revealed by removing the A1,03 powder by washing repeatedly with water.
After milling, the slurry was dried with a rotary evaporator. The dried lumps were crushed and passed through a plastic sieve with 74 pm aperture size. The sintering was performed by hot-pressing at 1450°C with a graphite die for 1 h. The pressure applied was 24.5 MPa. The vapour pressure during
hot-pressing was kept below 5 X 10e3 torr. The dimensions
of the hot-pressed specimen were 50 mm diameter and roughly 4.5 mm thickness. Alumina specimens were also prepared with the same milling and hot-pressing procedures. The hot-pressed specimens were cut into rectangular bars with a diamond saw. The rectangular specimens were then
machined longitudinally with a 44 p,rn grit resin-bonded dia-
mond wheel at cutting depths of 5 Km/pass. The final dimen-
sions of the specimens were 4 mmX 3 mm X 34 mm. The
final density was determined by the water-displacement method. The phase identification was performed by X-ray powder diffractometry (XRD) with Cu Kol radiation. The polished surface was prepared by grinding with diamond
slurry to 6 km and polishing with silica suspension to 0.05
p,m. The microstructure was observed with SEM and trans- mission electron microscopy (TEM). The polished speci- mens were thermally etched at 1400°C for 0.5 h to reveal the grain boundaries. The size of A1203 and NiAl grains was determined with the lineal intercept procedure. The aspect ratio of NiAl grains was determined with a statistical tech- nique [8]. The interconnectivity of the NiAl grains in the composites was determined by measuring the electrical resis- tivity at room temperature [ 91. The chemical composition after sintering was determined by electron probe microanal- ysis (EPMA) .
The hardness was determined by the Vickers indentation technique. The load applied was 98 N. The strength of the specimens was determined by the four-point bending tech- nique at ambient conditions. The inner and outer spans were 10 and 30 mm, respectively. The rate of loading was 0.5 mm/ min. The fracture toughness was determined by the single-
edge-notched-beam (SENB) technique. The notch was
generated by cutting with a diamond saw.
3. Results and discussion
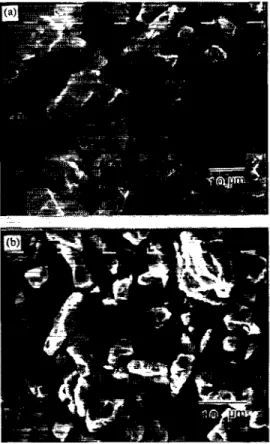
The morphology of the as-received NiAl particfes is shown in Fig. 1 (a). The shape of the as-received NiAl particles is angular; the aspect ratio of the NiAl particles is nearly unity. The particle size distribution of the as-received NiAi powder
Fig. 1. The morphology of the (a) as-received NiAl powder and (b) Nii particles in the &O&Vii1 powder mixtures after milling, The A&O3 pow- der in (b) was removed by washing with wafer.
is shown in Fig. 2. The median size of the as-received NiAl powder is 5.9 Frn. The particle size distribution of the 20% Al,O,-80% NiAl powder mixtures after milling is also shown in the Figure. The powder mixtures show a bimodal size distribution. Since the size of as-received NiAl powder is roughly one order of magnitude larger than that of A1203 powder, the peak above 1 pm in Fig. 2 can be attributed to NiAl powder. Fig. 2 shows that the size of the NiAl particles is reduced after milling. The morphology of NiAl particles after milling can be revealed by washing the powder mixtures repeatedly with water to remove Al,O, particles. Many elon- gated NiAl particles can be found, Fig. l(b). The Al,O,
0
0.01 0.1 1 10 loo
particle size / pm
Fig. 2. The particle size distribution of the as-received NiAl powder and milled 20% Ai203-80% NiAl powder mixtures.
W.H. Turn et al. /Materials Chernisq, and Physics 56 (1998) 157-162 159
particles are attached on the surface of the NiAl particles during attrition milling [ lo]. Compression and shear forces are generated by the ZrO, milling balls during milling. These forces are applied on the NiAl particles through the Al,O,/ NiAl contacts. The forces are amplified through these con- tacts. Angular NiAl particles are thus deformed into elongated NiAl particles after milling. The ductility of NiAl is poor [ 61. The NiAl particles are first elongated during milling. NiAl fragments are then produced during prolonged milling. Therefore, the size of NiAl grains is smaller than the original particle size, Fig. 2.
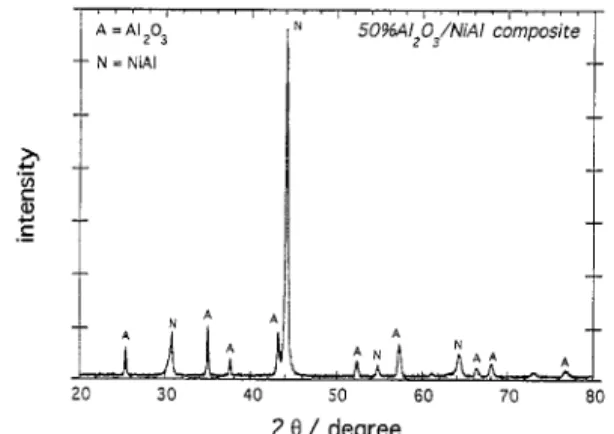
The XRD pattern for an A1203-NiAl composite after hot- pressing is shown in Fig. 3. The XRD analysis indicates that no phases other than o!-A1203 and P-NiAl are produced after hot-pressing. Contamination from the ZrO, milling medium may be picked up during the milling stage. However, the XRD and EPMA analyses show no ZrO, in the sintered spec- imens. This may be due to the contamination from ZrO, being below the detection limit of the XRD and EPMA. The relative density of the A1203-NiAl composites is shown as a function of NiAl content in Fig. 4. The relative density of the com- posites is higher than 98% theoretical density. The micro- structures of the A1203-NiAl composites are shown in Fig. 5. In the Figure, the bright particles are NiAl and the dark phase is Al?O,. The micrographs are taken from the cross section that is perpendicular to the hot-pressing direction. For the Al,O,-rich composites, NiAl grains are distributed uni- formly in the AlzO, matrix, Fig. 5(a) and (b). Furthermore, elongated NiAl grains within the A&O3 matrix are observed. The NiAl particles were deformed into elongated particles during attrition milling. The shape of NiAl particles after milling is retained after hot-pressing. Therefore, the aspect ratio of NiAl grains in the composites is bigger than unity, see Table 1. The aspect ratio of NiAl grains decreases with the increase of NiAl content. This may be due to the milling efficiency decreasing with decreasing A1203 content.
For the NiAl-rich composite, Al,O, grains are mainly
located at the grain boundaries of NiAl after sintering, as shown in Fig. 5 (c) . In the Figure, the Al,O, particles are slightly above the polished surface. The Al,O, particles thus appear brighter due to the charging effect. The Al,O, particles are attached on the surface of the NiAl particles after milling
[ lo]. The size of NiAl grains and of Al,O, grains in the hot- pressed composites is shown as a function of NiAl content in Fig. 6. The size of the as-received A120, and NiAl powders is also shown for comparison. The size of NiAl increases with the increase of NiAl content. However, the NiAl grains in the
Al,O,-rich composites are smaller than the initial particle
size. This is due to the size of NiAl particles being reduced during milling. Furthermore, the NiAl particles are isolated from each other in the A1203 matrix (to be shown later) as the NiAl content is less than 20 vol.%. The coarsening of NiAl particles has therefore not taken place during hot- pressing.
The grain size of Al,O, in the composites is larger than the original particle size, see Fig. 6. This indicates that the A1203
A =AlZ03 50%41203/NiAI compaite
2 6 / degree
Fig. 3. The XRD pattern for the 50% Al,O,-50% NiAl composite after hot- pressing.
A1203-MA/ composites :
96 , /
0 20 40 60 90 100
NiAl content / vol.%
Fig. 4. The relative density of the AI,O,-NiAI composites as a function of NiAl content.
underwent considerable grain growth during hot-pressing. However, the grain size of Al,O, decreases with increasing NiAl content. The diffusion distance between Al,O, grains is increased due to the presence of NiAl grains. Furthermore, a small amount of Ni from NiAl may be dissolved into alu- mina during sintering. The nickel ions prefer to segregate at the grain boundaries of alumina [ 111. The movement of the grain boundaries of alumina is therefore prohibited, and the grain size of alumina is reduced. The size of A1203 grains in the composites containing less than 50 vol.% A&O, is small. The thermal etching step failed to reveal the grain boundaries of Al,O,. The size of Al,O, grains for the NiAl-rich com- posites is thus not determined.
The electrical resistivity of the composites is shown as a function of NiAl content in Fig. 7. It suggests that the NiAl grains are interconnected to each other as more than 20 vol.% NiAl is added into alumina. The Al,O, grains are located at the grain boundaries of NiAl for the NiAl-rich composites. The presence of Al,O, reduces the grain size of NiAl as shown in Fig. 6. The pinning effect provided by the Al,O, grains retards the grain growth of NiAl. Despite the A1203 grains being located at the grain boundaries of NiAl, NiAl grains are still interconnected up to 80 vol.% A1203, Fig. 7. Without the presence of Al,O, particles, NiAl grains can grow to twice their original size after hot-pressing, Fig. 6.
160 W.H. Xrnn et cd. /Muierials Chemistp and Physics 56 (1998) 157-162
Fig. 5. The polished surfaces of the .4iU203-NiAl composites containing (a) 20% NiAl, (b) 50% NiAl and (c) 80% NiAl. Some NiAl grains are indicated wilh N,
Table 1
The aspect ratio of the NiAl grains in the A&O,-NiAI composites
NiAl contentivol.~ Aspect ratio
0 10 4.8 20 4.9 50 3.0 60 2.7 80 2,4 100 21
size of the as-received
size ofthe as-iecwed _ AiZO, partkles
NiAl content / vol.%
Fig. 6. The size of the AlzO, and NiAl grains in the composites as a function ofNiA1 content. The median size of the as-received powders is also shown for comparison.
The hardness of the composites is shown as a function of NiAl content in Fig. 8. The hardness of NiAi is much lower than that of A120,. The hardness of the composites is therefore decreased with increasing NiAl content. Furthermore, the hardness of the composites follows the rule of mixtures. The toughness of the composites is shown as a function of NiAl content in Fig. 9. The value in the Figure indicates the average values of three to seven specimens being tested. Error bars show one standard deviation. The straight line predicted by the rule of mixtures is also shown for comparison. The tough- ness of the composites is higher than the values predicted by the rule of mixtures. The interactions between cracks and
microstructure are shown in Fig. 10. The crack propagates
mainly along the interface of Al,O, and NiAl. This implies
-10 " I"' / " I II I"' 1
0 20 40 60 80 loo -.
NiAl content / vol.%
W.H. Tuan et al. /Materials Chemistry and Physics 56 (1998) 157-162 161 20 m 15 4 \ w E 10 E 2 5 . 0- , ” / I , I A1203-N/AI composites / I I , - -
3
1
” 2” 40NiAl content /6voo1.%
80 100
Fig. 8. The hardness of the composites as a function of NiAl content. The straight lint is predicted by the rule of mixtures.
I 2 0
I ,,/.,,I, , I 20 40 60 80 100
NiAl content / vol.%
Fig. 9. The toughness of the composites as a function of NiAl content. straight line is predicted by the rule of mixtures.
The
that the interface is relatively weak. The crack path is thus
erratic due to the presence of weak interfaces. The resistance of the composites to the propagation of cracks is increased. The toughness of the composites is therefore enhanced. The toughness of the 20% A1,0,/80% NiAl composite is 65% higher than the value predicted by the rule of mixtures. The toughening effect exerted by the crack deflection from the spherical inclusions is not large enough to account for all the toughness enhancement [ 121. Other toughening mechanisms may also be involved during the fracture of the composite.
For the ZrO,/NiAl composites, the toughness enhancement
is proposed to be due to the transformation of ZrO, inclusions [ 71. The present study indicates that the toughness of NiAl can also be enhanced by introducing weak interfaces.
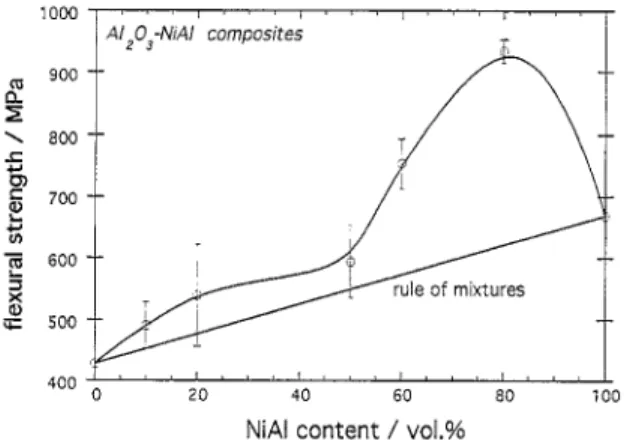
The flexural strength of the composites is shown as a func- tion of NiAl content in Fig. 11. The strength of the composites is also higher than the values predicted by the rule of mixtures. From Fig. 6, the grain growth of one phase is constrained by another phase. The strength of the composites is increased due to the microstructural refinement. The thermal expansion
of NiAl ( 13 X 10B6 “C- ’ [ 61) is higher than that of Al,O,
(9 X 10V6 “C-l), so residual stresses are generated as the
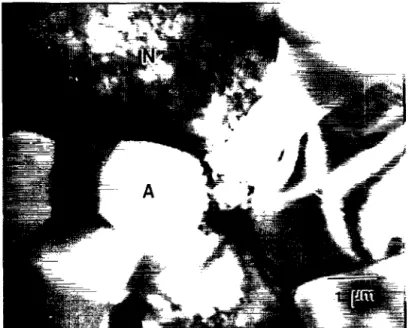
specimens are cooled from the hot-pressing temperature. A TEM micrograph of the composite containing 50 vol.% NiAl is shown in Fig. 12. Dislocation networks are observed within
Fig. 10. The interactions between a crack and the A11203-NiAl interfaces. The composites contain (a) 207~ NiAl and (b) 80% NiAl. The crack is introduced by indentation.
low "'I"//',,,,,,/.,,
composites
400;' " I"' ( " I "'I "1 20 40 60 80 100
NiAl content / vol.%
Fig. Il. The flexural strength of the composites as a function of NiAl content. The straight line is predicted by the rule of mixtures.
the NiAl grains. The strength of NiAl is thus increased due to the increase of dislocation density. Barinov and Evdoki- mov [ 71 speculated that the residual stress may underline the
strengthening effect found in the ZrO,/NiAl composites.
However, no evidence is provided. This possibility is evi- denced by the TEM observation in the present study. 4. Conclusions
Al,O,-NiAl composites containing 0 to 100% NiAl are
I62 W.H. Turin et 01. /Marerials Chemist? rind Physics 56 (1998) 157-162
Fig, 12. A TEM micrograph of the composite containing 50% N&I. A denotes Al,03 and N denotes NiAl.
structure is refined during the milling and densification proc- esses. The strengthening effect is thus contributed by the
microstructural refinement. The AI,O,-NiAl interface is rel-
atively weak, so erratic crack advance develops. The tough- ness is therefore enhanced. Both the strength and toughness of the composites are higher than the values predicted by the rule of mixtures.
Acknowledgements
The present study is supported by the National Science Council, Taiwan, through the contract numbers NSC83- 0405-E002-006 and NSC84-2216-E002-030.
References [II [21 [31 [41 [51 [61
M.K. Aghajanian, N.H. MacMillan, C.R. Kennedy, S.J. Luszcz, R. Roy, J. Mater. Sci. 24 (1989) 658.
W.H. Tuan, R.J. Brook, J. Eur. Ceram. Sot. 6 ( 1990) 31. W.B. Chou, W.H. Tuan, J. Eur. Ceram. Sot. 15 (1995) 291. W.H. Tuan, W.B. Chou, J. Eur. Ceram. Sot. 16 (1996) 583. R. Darolia, J. Metal 43 ( 1991) 44.
R.D.Noebe, R.R. Bowaman, M.V. Nathal, Int.Mater. Rev. 38 (1993) 192. [71 181 [91 IlO1 IllI
S.M. Btinov, V.Yu. Evdokimov, ActaMetall. Mater.41 (1993) 801. G. Wotting, B. Kanka, G. Ziegler, in: S. Hampshire (Ed.), Non-oxide Technical and Engineering Ceramics, Elsevier Applied Science, Lo& don, 1986, p. 83.
W.H. Tuan, J.M. Wu, J. Mater. Sci. 28 (1993) 1415. W.H. Tuan, to be published.
P.J. Jorgensen, J.H. Westbrook, J. Am. Ceram. Sot. 47 ( 1964) 332.- [ 121 K.T. Faber, A.G. Evans, ActaMetall. 31 ( 1983) 565