Surface-induced ordering effect in one antiferroelectric liquid crystal compound
LiDong Pan,1Shun Wang,1 C. S. Hsu,2and C. C. Huang1
1
School of Physics and Astronomy, University of Minnesota, Minneapolis, Minnesota 55455, USA
2
Department of Applied Chemistry, National Chiao Tung University, Hsinchu 30050, Taiwan 共Received 16 September 2008; published 18 March 2009兲
Null transmission ellipsometer was employed to study the surface-induced tilt transition of an antiferroelec-tric liquid crystal compound in the bulk smectic-A 共SmA兲 temperature range. The data of the surface tilt transition can be fitted with an extended mean-field model. These results indicate the transition is near a mean-field tricritical point. The surface layers’ tilt directions are found to be in different planes several degrees above the bulk SmA-SmC␣ⴱ transition.
DOI:10.1103/PhysRevE.79.031704 PACS number共s兲: 61.30.Hn, 64.70.M⫺, 77.84.Nh
I. INTRODUCTION
Since the discovery of ferroelectricity 关1兴 and antiferro-electricity 关2兴 in smectic liquid crystals, a considerable amount of research effort has been devoted to this field. Among the various smectic liquid crystal phases, smectic-A 共SmA兲 and smectic-C 共SmC兲/smectic-Cⴱ 共SmCⴱ兲 are the most studied ones. Earlier heat capacity关3–6兴 and x-ray dif-fraction 关7兴 studies of the SmA to SmC 共SmCⴱ兲 transition showed classical mean-field behavior. The data can be de-scribed by an extended mean-field free-energy expansion in-cluding a sixth-order term in the order parameter共tilt angle兲. Among antiferroelectric liquid crystal compounds, in many cases, the smectic-C␣ⴱ 共SmC␣ⴱ兲 phase is found below SmA instead of the SmCⴱ phase. The SmC␣ⴱ exhibits an incom-mensurate nanoscale helical pitch关8兴. Near the SmA-SmC␣ⴱ transition calorimetric studies 关9兴 and layer compression modulus measurements 关10兴 yield a crossover from three-dimensional共3D兲 XY critical to tricritical behavior.
Among liquid crystals, surface-induced ordering effects were often observed 关11兴. For smectic liquid crystals, free standing film geometry has been widely used in experiments. Films with thickness ranging from 2 to several hundred lay-ers can be obtained. Thus smectic liquid crystal films are perfect systems to study the surface-induced ordering effect. For most materials showing a SmA-SmC 共SmCⴱ兲 transition, surface-induced ordering appears as surface-induced tilts at temperatures in the bulk SmA range. Thus far, most studies yield that surface layers tilt in a synclinic or anticlinic ar-rangement, i.e., the surface layers tilt in the same plane 关12–15兴. Earlier studies using the extended mean-field model to analyze the tilt angle data from thin films 共ⱕ10 layers兲 yielded good fitting results 关12,13兴. However, in recent studies, synclinic-anticlinic-synclinic-anticlinic double re-entrance surface transitions were reported in two different liquid crystal compounds 关14,16兴. Meanwhile nonplanar ar-rangements of surface tilt directions were discovered, in which the surface layers’ tilt directions are in different planes 关17,18兴. So far, the general understanding of these complex surface-induced ordering effects has been limited. In this pa-per, we report the ellipsometric study of surface-induced or-dering effect found in an antiferroelectric liquid crystal com-pound. Despite the fact that the underlying bulk transition shows a crossover behavior from 3D XY to tricritical, order
parameter of the surface transition can be well described by an extended mean-field model.
II. EXPERIMENTAL METHOD
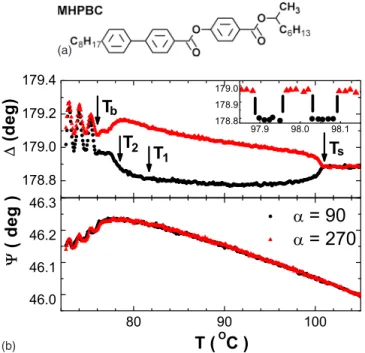
The liquid crystal compound used in this study is 共R兲-MHPBC. Its molecular structure is shown at the top of Fig. 1. The phase sequence found in bulk is isotropic 共109 °C兲-SmA 共76 °C兲-SmC␣ⴱ 共71 °C兲-SmCFI2ⴱ 共66 °C兲-SmCFI1ⴱ 共62 °C兲-SmCAⴱ 关19,20兴. Free standing films
were prepared in our null transmission ellipsometer 共NTE兲. Two optical parameters, ⌬ and ⌿, were acquired. ⌬ mea-sures the phase difference between the p and s components of the incident light necessary to produce linearly polarized transmitted light, while ⌿ defines the polarization angle of the transmitted light. A cover glass slide with a 4 mm
diam-(a)
(b)
FIG. 1. 共Color online兲 ⌬ and ⌿ as a function of temperature upon cooling from an 81-layer film, with ␣=90° 共black dots兲 and 270°共red triangles兲. Inset shows raw data obtained from a cooling run while switching the direction of E. On the top is the chemical structure of MHPBC
PHYSICAL REVIEW E 79, 031704共2009兲
eter hole was used as the film plate. Applying a proper set of voltages to eight evenly spaced electrodes around the film hole creates a rotatable uniform in-plane dc electric field over more than 90% of the film. For films with nonzero in-plane polarization, the whole structure can be rotated smoothly about the layer normal by rotating the electric field 共E兲. Variable␣denotes the angle between E and the projec-tion of k共wave vector of the laser beam兲 onto the film plate. Details of our experimental setup have been reported else-where关21兴.
The ellipsometric parameters ⌬ and ⌿ were measured from about 50 films with thickness ranging from 2 to 200 layers at 104.9 ° C where there are no surface tilts present. Data were fitted by a 4⫻4 matrix method 关22兴. By model-ing each layer as a uniaxial slab with no, ne, d being the
principal indices of refraction and layer thickness, we ob-tained their values to be 1.481⫾0.002, 1.626⫾0.01, and 3.44⫾0.05 nm, respectively 关15兴. Afterwards, the same fit-ting method was used to determine the thickness of all films studied.
III. DATA AND ANALYSES
For chiral smectic liquid crystals, polarization is perpen-dicular to the tilt plane due to symmetry of the molecule. By setting E field orientation ␣= 90°/270°, the molecules will tilt toward/away from the incident laser beam. So data col-lected at ␣= 90° and 270° give important information con-cerning the average tilt and structural symmetry of the film studied关12,13,23兴. Figure1shows⌬ and ⌿ as functions of temperature upon cooling from an 81-layer film, with ␣ = 90° 共black dots兲 and 270° 共red triangles兲. To minimize the complications caused by thermal degradation of the sample, data were collected in the following procedure. During the temperature ramps the direction of E was switched every 150 s between ␣= 90° and ␣= 270°. The temperature ramping rate was set to be 40 mK/min in the region 10 K below the surface transition temperature 共Ts兲 and 20 mK/min above it
共for the films from which critical exponentwas measured, this rate was reduced to 10 mK/min兲. Since our ellipsometer collects one data point every 30 s, five data points are col-lected for one E field orientation before switching to the other orientation. These five raw data points are then aver-aged to obtain one single point. Data for the other field ori-entation of the same temperature window are obtained by linear interpolation of the ten raw data points in the two neighboring temperature windows. Since the optical param-eters vary smoothly as temperature changes, with this proce-dure we are able to obtain a complete ramping data set with
␣= 90° and 270° from a single cooling run.
In Fig.1, for T⬎Ts, the⌬ data obtained with␣= 90° and
270° are the same, indicating the whole film is in the uniaxial SmA phase. For Ts⬎T⬎T2, a distinct difference develops
continuously between⌬90 and⌬270while ⌿90 and⌿270 re-main the same, indicating the surfaces begin to tilt synclin-icly, while the bulk is still in a SmA structure. Between T2 and Tb, the temperature variations of⌬ and ⌿ show a
no-ticeable deviation from the general trends obtained in the temperature range T2⬍T⬍Ts; we will show in later
discus-sion a nonplanar arrangement of the surface layers begins to develop in this temperature window. Here Tb is the bulk
SmA-SmC␣ⴱ transition temperature. For T⬍Tb, the
character-istic oscillations in ⌬ and ⌿ indicate the presence of the SmC␣ⴱ phase关8,24兴.
It has been demonstrated that for free standing smectic films with synclinic tilt, 兩⌬270−⌬90兩 is proportional to the total tilt angle of the film 关12,23兴. Shown in Fig. 2 is⌬270 −⌬90 as a function of temperature upon cooling from three films having 20共black dots兲, 81⫾2 共red stars兲, and 800⫾30 共green triangles兲 layers in thickness, respectively. As can be seen, for Ts⬎T⬎T1,⌬270−⌬90is independent of film
thick-ness for the range of film thickthick-ness studied, indicating the molecular tilts are localized in the surface layers. A smooth growth of ⌬270−⌬90 from 0 at Ts indicates a well-defined
continuous surface-induced tilt transition. Meanwhile, below T1,⌬270−⌬90shows a clear deviation from the trend found in the high-temperature region. This can be attributed to the changes in the surface molecular arrangements which will be addressed in detail later.
The data from the 800-layer film shows a higher ⌬270 −⌬90 value below T1 than those from the other two films. This is most likely due to the fact that the interactions of the two surfaces are much weaker in thicker films, thus causing the change of surface structures to occur at a slightly lower temperature than those in thinner films.
First, a simple power-law equation ⌬270−⌬90= A关共Ts
− T兲/Ts兴was employed to fit the data for T⬎Ts− 16 K. The
exponent  for the surface tilt transition was found to be 0.27⫾0.02. The value of  is smaller than the associated value共= 0.35兲 for the 3D XY model. This strongly suggests that the surface-induced tilt transition is in the vicinity of a mean-field tricritical point共= 0.25兲. Consequently, we fitted our results to an equation derived from the extended mean-field model关3兴, i.e.,
共⌬270−⌬90兲2= B兵关1 + 3共− t兲/t0兴1/2− 1其.
Here t =共T−Ts兲/Tsis the reduced temperature. Both B and
t0are fitting parameters. The value of t0gives crossover tem-perature in the reduced temtem-perature scale between the ordi-nary and tricritical mean-field behavior. Shown in Fig.3are the data and fitting result from the 800-layer film. The small-ness of t0共5⫾2⫻10−4兲 demonstrates that the surface transi-FIG. 2.共Color online兲 ⌬270−⌬90as a function of Ts− T from 20-共black dots兲, 81⫾2- 共red stars兲, and 800⫾30- 共green triangles兲 layer films obtained from cooling runs. Ts= 100.65 ° C for the films shown.
PAN et al. PHYSICAL REVIEW E 79, 031704共2009兲
tion is in the close vicinity of a mean-field tricritical point. For comparison, the extended mean-field theory fitting from thin films of DOBAMBC gives t0 about 1.8⫻10−2 and MBOOBC gives t0 of 1.6⫻10−3, while in earlier studies of bulk SmA-SmC 共SmCⴱ兲 transition, a value on the order of 10−3 is often found for t0 关5,6,9,13兴.
The bulk heat-capacity data of MHPBC near the SmA-SmC␣ⴱ transition can be fitted to a crossover expression for 3D XY critical to tricritical behavior, with a large cross-over temperature suggesting pronounced critical behavior 关9兴. Layer compression measurement also yields the same type of crossover behavior 关10兴. Since the surface-induced tilts occur in a constrained dimensional space, intuitively the tilt fluctuations should be much enhanced. However, x-ray reflectivity experiments have shown that surface tension sup-presses the surface fluctuations significantly and enhances the surface ordering 关26兴. Our results clearly indicate that surface tension dominates the surface-induced tilt transition. A noticeable deviation from the general trend of ⌬270 −⌬90below T1is visible from the data shown in Fig.2. Thus our low-temperature cutoff of the fitting is at about Ts− T
= 16 K. In Fig.2, the⌬270−⌬90data show a maximum near T2. If we limit ourselves to synclinic surface arrangements, this would imply a decrease in the surface-induced tilt angle for T⬍T2, which is highly unlikely. Based on our previous experience, the decrease of ⌬270−⌬90 is most likely due to the development of a nonplanar structure in the film. In order to get the surface structures for Ts− 16 K⬎T⬎Tb, rotations
of E through 360° with steps of 15° were performed at con-stant temperature. To minimize the effect of defects such as 2 walls, a clockwise rotation was done after a counter-clockwise one and vice versa.
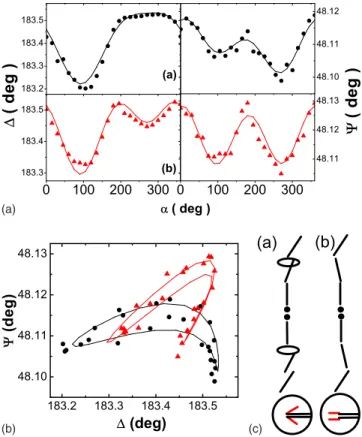
Shown in Fig.4共a兲is the␣dependence of⌬ and ⌿ from a 20-layer film at共a兲 81.5 °C 共black dots兲 and 共b兲 76 °C 共red triangles兲. Data were fitted by using the 4⫻4 matrix method 关22兴 along with the previously determined parameters 共no, ne,
and d兲. To simplify our fitting, a model with two tilted sur-face layers was used关27兴, with the outermost layers always in a synclinic arrangement and␦denoting the azimuth dif-ference between the outermost layers and the adjacent layers. From the fitting, the following values of surf, AS, and ␦ are obtained:共a兲 15° ⫾1°, 5° ⫾1°, 50° ⫾15°; 共b兲 18° ⫾1°, 7.5°⫾1°, 180° ⫾15°.surf denotes the tilt angle of the sur-face layers andASthe tilt angle of the layers adjacent to the surfaces.
As shown in Fig.4共a兲, the⌿ versus␣curve evolves from an asymmetric shape to having a twofold symmetry at
76 ° C, just above Tb. This indicates the structure is
nonpla-nar for T = 81.5 ° C. However the shapes of ⌬ versus ␣ curves at these temperatures show the typical features of a synclinic structure, i.e., a global minimum at ␣= 90° and a plateau/local minimum around ␣= 270°. These results sug-gest that the major tilted parts共the outermost layers兲 of the film are in a synclinic arrangement in the temperature win-dow studied. The layers adjacent to the surface evolve from synclinic to nonplanar and finally to anticlinic arrangements with respect to the outermost layers just above Tb.
In Fig.4共b兲, plots of⌬ versus ⌿ for the two rotations are shown. The distinct shapes of the curves clearly indicate dif-ferent surface structures at these two temperatures. The car-toons and top views of the molecular arrangements used in the fittings are given in Fig.4共c兲.
IV. DISCUSSION AND SUMMARY
We have demonstrated that while the underlying bulk SmA-SmC␣ⴱ transition shows a crossover from 3D XY to tri-critical behavior, the surface-induced tilt transition can be well described with an extended mean-field theory. The non-FIG. 3. 共Color online兲 Extended mean-field theory fitting of
共⌬270−⌬90兲2from the 800-layer film. (a)
(b) (c)
FIG. 4. 共Color online兲 共a兲 ⌬, ⌿ vs ␣ data 共symbols兲 and fits 共solid lines兲 from a 20-layer film at 共a兲 81.5 °C 共black dots兲 and 共b兲 76 ° C 共red triangles兲. 共b兲 ⌬ vs ⌿ plot for the rotation data. 共c兲 Cartoons and top views of the corresponding layer structures from the fitting. In the top view, black共longer兲 rods represent the outer-most surface layers while red rods 共shorter兲 represent the layers adjacent to the surfaces. Note: the change in ⌿ over the whole range of␣ is extremely small 共approximately 0.02°兲. Our resolution in ⌿ is about 0.002°. This is the main reason for the scattering of the⌿ vs␣ data.
SURFACE-INDUCED ORDERING EFFECT IN ONE… PHYSICAL REVIEW E 79, 031704共2009兲
planar surface structure of MHPBC appears to be the inter-mediate state between the high-temperature synclinic and lower temperature anticlinic structure, as seen from the smooth evolution of⌬270−⌬90around T1. To the best of our knowledge, this complex surface structure is most likely in-duced by the underlying SmC␣ⴱ structure occurring at the bulk transition temperature 共Tb兲. However, the relationship
between the nature of the surface transition and the underly-ing bulk transition as well as the effect of the underlyunderly-ing bulk structure on the surface structure remain to be important topics for further studies. It would be interesting to compare the behavior of surface-induced tilt transition of MHPBC to the group of materials showing significantly different cross-over behavior in the bulk, such as MHPOBC, 12BIMF10, and MHPOCBC as reported in Ref.关9兴.
From earlier studies of thin smectic liquid crystal films, it was found that the structure of the tilted surfaces may depend
on the strength of in-plane E field关15,25兴. In all the experi-ments reported in this paper, E field was fixed at 1.25 V/mm, which is strong enough to align the film, while too weak to cause any change in the tilt angle, thus the results of the surface tilt transition are not affected by our applied E field. In conclusion, a nonplanar-anticlinic surface transition was observed at temperatures higher than the bulk SmA-SmC␣ⴱ transition for MHPBC. The power-law and ex-tended mean-field fittings show the synclinic surface tilt tran-sition is close to a mean-field tricritical point, even though the bulk results yield 3D XY behavior.
ACKNOWLEDGMENT
The research was supported in part by the National Sci-ence Foundation, Solid State Chemistry Program, under Grant No. DMR-0605760.
关1兴 R. B. Meyer, L. Liebert, L. Strzelecki, and P. Keller, J. Phys. 共Paris兲, Lett. 36, L69 共1975兲.
关2兴 A. D. L. Chandani, E. Gorecka, Y. Ouchi, H. Takezoe, and A. Fukuda, Jpn. J. Appl. Phys., Part 2 28, L1265共1989兲. 关3兴 C. C. Huang and J. M. Viner, Phys. Rev. A 25, 3385 共1982兲. 关4兴 C. C. Huang and S. Dumrongrattana, Phys. Rev. A 34, 5020
共1986兲.
关5兴 C. C. Huang and S. C. Lien, Phys. Rev. A 31, 2621 共1985兲. 关6兴 M. Meichle and C. W. Garland, Phys. Rev. A 27, 2624 共1983兲. 关7兴 R. Shashidhar, B. R. Ratna, Geetha G. Nair, S. K. Prasad, Ch.
Bahr, and G. Heppke, Phys. Rev. Lett. 61, 547共1988兲. 关8兴 D. Schlauf, Ch. Bahr, and H. T. Nguyen, Phys. Rev. E 60,
6816共1999兲; P. Mach, R. Pindak, A.-M. Levelut, P. Barois, H. T. Nguyen, H. Baltes, M. Hird, K. Toyne, A. Seed, J. W. Goodby, C. C. Huang, and L. Furenlid, ibid. 60, 6793共1999兲. 关9兴 K. Ema and H. Yao, Phys. Rev. E 57, 6677 共1998兲.
关10兴 S. Shibahara, J. Yamamoto, Y. Takanishi, K. Ishikawa, H. Tak-ezoe, and H. Tanaka, Phys. Rev. Lett. 85, 1670共2000兲. 关11兴 B. Jerome, Rep. Prog. Phys. 54, 391 共1991兲.
关12兴 S. Heinekamp, R. A. Pelcovits, E. Fontes, E. Y. Chen, R. Pin-dak, and R. B. Meyer, Phys. Rev. Lett. 52, 1017共1984兲. 关13兴 Ch. Bahr, C. J. Booth, and D. Fliegner, Ferroelectrics 178, 229
共1996兲.
关14兴 X. F. Han, S. T. Wang, A. Cady, M. D. Radcliffe, and C. C. Huang, Phys. Rev. Lett. 91, 045501共2003兲.
关15兴 P. M. Johnson, D. A. Olson, S. Pankratz, Ch. Bahr, J. W. Goodby, and C. C. Huang, Phys. Rev. E 62, 8106共2000兲. 关16兴 B. K. McCoy, Z. Q. Liu, S. T. Wang, V. P. Panov, J. K. Vij, J.
W. Goodby, and C. C. Huang, Phys. Rev. E 73, 041704
共2006兲.
关17兴 X. F. Han, D. A. Olson, A. Cady, D. R. Link, N. A. Clark, and C. C. Huang, Phys. Rev. E 66, 040701共R兲 共2002兲.
关18兴 S. T. Wang, X. F. Han, Z. Q. Liu, A. Cady, M. D. Radcliffe, and C. C. Huang, Phys. Rev. E 68, 060702共R兲 共2003兲. 关19兴 K. Miyachi, M. Kabe, K. Ishikawa, H. Takezoe, and A.
Fukuda, Ferroelectrics 147, 147共1993兲.
关20兴 A. Cady, Z. Q. Liu, X. F. Han, S. T. Wang, M. Veum, N. Janarthanan, C. S. Hsu, D. A. Olson, and C. C. Huang, Phys. Rev. E 66, 061704共2002兲.
关21兴 D. A. Olson, X. F. Han, P. M. Johnson, A. Cady, and C. C. Huang, Liq. Cryst. 29, 1521共2002兲.
关22兴 D. W. Berreman, J. Opt. Soc. Am. 62, 502 共1972兲; H. Wohler, G. Hass, M. Fritsch, and D. A. Mlynski, J. Opt. Soc. Am. A 5, 1554共1988兲.
关23兴 Ch. Bahr and D. Fliegner, Phys. Rev. A 46, 7657 共1992兲. 关24兴 P. M. Johnson, S. Pankratz, P. Mach, H. T. Nguyen, and C. C.
Huang, Phys. Rev. Lett. 83, 4073共1999兲.
关25兴 D. R. Link, G. Natale, N. A. Clark, J. E. Maclennan, M. Walsh, S. S. Keast, and M. E. Neubert, Phys. Rev. Lett. 82, 2508 共1999兲.
关26兴 D. J. Tweet, R. Holyst, B. D. Swanson, H. Stragier, and L. B. Sorensen, Phys. Rev. Lett. 65, 2157共1990兲; R. Holyst, D. J. Tweet, and L. B. Sorensen, ibid. 65, 2153共1990兲.
关27兴 From our two-layer film results, ⌬270−⌬90above the
synclinic-anticlinic transition matches with the data obtained from other films nicely if plotted in Ts− T scale. Thus we concluded that the major contribution of the surface-induced tilt comes from the outermost layers.
PAN et al. PHYSICAL REVIEW E 79, 031704共2009兲