Thermal Decomposition and Oxidation of CH
3
OH
Pei-Fang Lee, Hiroyuki Matsui,* Ding-Wei Xu, and Niann-Shiah Wang*
Department of Applied Chemistry, National Chiao Tung University, 1001 Ta Hsueh Road, Hsinchu 30010, Taiwan
*
S Supporting InformationABSTRACT: Thermal decomposition of CH3OH diluted in Ar has been
studied by monitoring H atoms behind reflected shock waves of 100 ppm
CH3OH + Ar. The total decomposition rate k1 for CH3OH + M →
products obtained in this study is expressed as, ln(k1/cm3molecule−1s−1) =−(14.81 ± 1.22) − (38.86 ± 1.82) × 103/T, over 1359−1644 K. The present result on k1 is indicated to be substantially smaller than the extrapolation of the most of the previous experimental data but consistent with the published theoretical results [Faraday Discuss. 2002, 119,
191−205 and J. Phys. Chem. A 2007, 111, 3932−3950]. Oxidation of
CH3OH has been studied also by monitoring H atoms behind shock waves of (0.35−100) ppm CH3OH + (100−400) ppm O2+ Ar. For the low concentration CH3OH (below 10 ppm) + O2mixtures, the initial concentration of CH3OH is evaluated by comparing evolutions of H atoms in the same concentration of CH3OH with addition of 300 ppm H2 diluted in Ar. The branching fraction for CH3OH + Ar→1CH
2+ H2O + Ar has been quantitatively evaluated from this comparative measurements with using recent experimental result on the yield of H atoms in the reaction of 1,3CH2 + O2[J. Phys. Chem. A 2012, 116, 9245−9254]; i.e., the branching fraction for the above reaction is evaluated as, ϕ1a= 0.20± 0.04 at T = 1880−2050 K, in the 1.3 and 3.5 ppm CH3OH + 100 ppm O2samples. An extended reaction mechanism for the pyrolysis and oxidation of CH3OH is constructed based on the results of the present study combined with the oxidation mechanism of natural gas [GRI-Mech 3.0]; evolution of H atoms can be predicted very well with this new reaction scheme over a wide concentration range for the pyrolysis (0.36−100 ppm CH3OH), and oxidation (0.36−100 ppm CH3OH + 100/400 ppm O2) of methanol.
1. INTRODUCTION
Pyrolysis and oxidation of CH3OH has been studied extensively in the past several decades1−15because of the importance in the fundamental chemical kinetics, as well as the urgent worldwide demands for the renewable energy sources, however, reaction models for predicting the pyrolysis and combustion of CH3OH may need further improvement. Thermal decomposition of
CH3OH
→
CH OH3 products (1)
has been indicated to have several product channels
→ +
CH OH3 1CH2 H O2 (1a)
→CH3+OH (1b)
→CH OH2 +H (1c)
The main reaction channel for the moderate combustion condition is suggested to be reaction 1b, and substantial contribution from 1a is also indicated, but 1c is generally regarded as very small. In order to understand the roll of the reactions of1CH
2and3CH2in the initial stage of pyrolisis and oxidation of CH3OH, further investigation on the magnitude of the branching fractions of (1) is still an important task.
There is significant inconsistency among the predictions of experimental and theoretical studies on the rate and the branching fractions of (1). The total rate of (1) has been studied extensively but they are inconsistent each other in the
low temperature range (T < 1600 K), where only one direct measurement via monitoring the IR emission of CH3OH was reported.8 Also, the rate at low temperature range given by theoretical calculations14,15 is significantly smaller than extrapolation of most of the experimental results conducted at high temperature range (above 1600 K); i.e., the theoretical prediction is consistent with the results of some experimental studies,3,4but about an order of magnitude lower at 1400 K than that predicted by majority of the experiemtal studies.5−13 Branching fractions of (1b) and (1c) have been evaluated by conducting measurement of the evolutions of [OH],11 and [H],13 respectively. Experimetal difficulty in evaluating the branching fractions mainly arises from the contributions of the secondary reactions, which dominate in the evolutions of [OH] produced in the thermal decomposition of CH3OH below 1800 K as demonstrated in the previous study, even though highly diluted samples (1 ppm level diluted in Kr,∼ 1013/cm3) were employed.11Significant contribution of the secondary reactions was also involved in the measurement of (1c), where, [H] produced in highly diluted sample (1 ppm diluted in Ar) was monitored.13In order to supply reliable information on the rate and branching fractions, it is necessary to conduct experiment with using lower concentration samples to reduce the influence of the secondary reactions. Also, previous theoretical
Received: October 1, 2012
Revised: December 17, 2012
Published: December 18, 2012
calculations on the branching fractions of (1) were inconsistent with each other.14,15
The issues of this study are to conduct measurement of the
thermal decomposition rate of CH3OH (1) at the low
temperature range down to 1400 K, and reinvestigate the branching fractions of (1a) and (1c) with using lower concentrations of CH3OH (down to 0.3 ppm diluted in Ar, ∼ 1012/cm3) by conducting comparative measurement of H atoms produced in the three different mixtures (i.e., with addition of excess H2, O2, and no additives).
Highly sensitive detection system for H atoms (detection limit is about 1011/cm3) used in this study have supported these low concentration measurements; very clean experimental environment free from the production of H atoms from impurities has been achieved to satisfy the essential require-ment to conduct such studies. By using a diaphragmless type shock tube in this study, highly clean experimental condition can be achieved, i.e., H atoms produced in the shock heated pure Ar have been kept below 1011/cm3, since exposure of the experimental system to atmosphere (such a process is required in the standard type shock tube for replacing the diaphragm) can be avoided. Also, this experimental system can achieve excellent reproducibility of the shock wave velocity; by conducting comparative measurements at the same shock conditions, as described in details in the subsequent sections, it is possible to perform the experiment to evaluate the branching fractions of (1). Conducting such comparative measuremnt at the same experimental conditions is very important and useful in confirmation of the concentration of CH3OH in the sample mixture, also improvement of the S/N ratio of the signal intensity has been achieved by repetition of the experiment using the same sample gas.
Furthermore, a modified kinetic model for the pyrolysis and
oxidation of CH3OH has been constructed based on the
experimental results obtained in this study. In our previous
study of thermal decomposition of CH3OH in the low
concentration samples (0.48−10 ppm), it is demonstrated that a reaction scheme consists of 36 elementary reactions was able to reproduce the observed time dependence of H atom very well.13An extended model is constructed here based on the modification of the previous model; the experimental information for k1 and the branching fractions of reaction 1 obtained in this study and also reaction scheme for combustion of natural gas (GRI-Mech 3.0) has been included to supply more detailed secondary reactions.16 The kinetic model has been tested in this study for the evolutions of [H] over the
wider concentration ranges of CH3OH (0.35−100 ppm
CH3OH with/without addition of excess O2).
2. EXPERIMENTAL SYSTEMS
The details of the shock tube and the detection system have been presented in the literatures.13,17,18 Measurements of the time dependence of H atoms have been carried out by using an atomic resonance absorption spectrometry (ARAS) system
behind reflected shock waves. Absorption for the atomic
transition [2P−2S1/2(2p−1s)] of H atom at 121.6 nm is monitored behind reflected shock waves of a diaphragmless shock tube at NCTU (length 5.9 m and i.d. 76 mm). The VUV light from a microwave discharge lamp using a flowing gas mixture of 1% H2/He is filtered with a monochromator and detected by a solar-blind photomultiplier tube. Thermal decomposition of C2H5I,17,18
φ
→ + = ±
C H I2 5 C H2 5 I ( 0.9 0.02)
followed by a rapid reaction producing H atoms
→ +
C H2 5 C H2 4 H
is used for establishment of calibration curves. The accuracy of this calibration curve becomes very poor for [H] > 3× 10¹³ atom/cm3 because of the saturation of the absorbance. The response time of the present detection system is measured to
be 25 μs from the evolutions of H produced in thermal
decomposition of C2H5I. Experimental conditions have been chosen so that the data analysis is not influenced by the observed response time. Only for the experimental data associated with very fast rise time in the 100 ppm CH3OH, the initial part of the observed profile has been numerically deconvoluted with using observed profile for the initial rise of [H] in thermal decomposition of C2H5I, and compared to the numerical simulation.
In conducting kinetic analysis of CH3OH in the experiment
for the high concentration range (100 ppm CH3OH−Ar
mixtures), absorption by CH3OH has to be taken into account; a calibration curve of absorption by CH3OH at 121.6 nm has been separately constructed by measuring absorbance in the
temperature range T = 700−1200 K (i.e., the temperature
range where production of H atom in thermal decomposition of CH3OH is negligible) in the range of [CH3OH] = 1015−1016 molecule/cm3. It is demonstrated that [CH3OH] and the measured absorbance can be expressed by a simple Lambert− Beer’s law without obvious temperature/pressure dependence. The absorption cross section at the wavelength of H Lyman-α line is measured asσ = 1.2 × 10⁻¹⁷cm2. The net absorption by H atom was estimated by correcting the contribution of CH3OH absorption by using this cross section. Such correction
is important for 100 ppm CH3OH for analyzing the low
temperature data because the absorption intensity by H atoms is almost the same as that by CH3OH at 1400 K or below.
Because of the loss at the wall of the sample cylinder or the shock tube in the experiments using low concentration CH3OH (below 10 ppm), the net concentration of CH3OH becomes lower than the nominal value assigned by the measurement of the partial pressure at the preparation of sample mixtures. As described in details in the subsequent section, comparative measurements for [H] with/without addition of 300 ppm H2 have been conducted in this study to evaluate the net [CH3OH]0.
To conduct such comparative measurements, sample mixtures are carefully prepared so that the concentrations of CH3OH in the different sample cylinders are equal each other, i.e., CH3OH is supplied with the same pressure in the same time into three stainless-steel cylinders of the same design, then, excess H2and O2are added one by one into the different cylinders, andfinally all three sample gas are diluted by Ar with the same total pressure. The comparative measurements of the evolutions of H atoms with using these three mixtures (i.e., CH3OH + excess H2 + Ar, CH3OH + excess O2 + Ar, and
CH3OH + Ar) have been conducted at the same shock
condition. Moreover, these comparative measurements have been repeated at least two times to confirm the reproducibility of the signal intensity and to improve the S/N ratio by signal averaging treatment. The shock tube is evacuated below 5× 10⁻⁷ Torr before each run. In order to achieve very high sensitivity for detection of the H atom, baking of the shock tube and the vacuum lines has been carefully conducted until [H]
produced from the blank tests, i.e., shock heated pure Ar (as well as in 100 ppm O2+ Ar and 300 ppm H2+ Ar; only for some series) becomes below the detection limit (1 × 10¹¹ atom/cm3). Although the experimental procedure is laborious and time-consuming, the method of this study appears to be essential to guarantee the reliability of the experimental data.
He (99.9995%, AGA Specialty Gases), Ar (99.9995%, AGA Specialty Gases), H2(99.9995%, AGA Specialty Gases), and O2 (99.995%, Scott Specialty Gases) are used without further purification. CH3OH (99%, Sigma-Aldrich, Reagent Plus grade) and C2H5I (99%, Sigma-Aldrich, Reagent Plus grade) are purified by repeating degassing by successive freezing and pumping cycles.
3. RESULTS AND DISCUSSION
3.1. Measurement of k1. Thermal decomposition of
CH3OH was experimentally examined in the low concentration CH3OH samples in our previous study, i.e., the total reaction rate for (1), k1was evaluated by monitoring evolutions of H atoms in the 0.48−10 ppm CH3OH diluted in Ar over 1660− 2050 K.13In the present study, the rate constantk1is measured
in the lower temperature range, 1359−1644 K with using
higher concentration, 100 ppm CH3OH in Ar in the pressure range,P = 1.89−1.62 atm.
The experimental conditions are summarized in Table 1. In order to avoid the uncertainty induced by the saturation of ARAS signal intensity, present experimental data have been analyzed for [H] < 3× 10¹³atom/cm3.
Examples of the time dependence of H atoms observed in the 100 ppm CH3OH + Ar mixture at various temperatures are shown in Figure 1 by the black solid curve; the evolutions of H atom are associated with incubation behavior, indicating that H atom is mainly produced in the secondary reactions.
As shown in Figure 2, the sensitivity analysis indicates that evolution of H atom is sufficiently sensitive to the rate of reaction 1 under experimental conditions of 100 ppm CH3OH, while most of the secondary reactions have minor contributions even though H atoms are exclusively produced in the secondary reactions. Kinetic analysis to evaluatek1from the experimental data has been conducted by using a reaction model shown in Table S-1 in the Supporting Information. The details of the reaction scheme used in this numerical computation is
discussed in the following section; it is constructed based on the new kinetic parameters on (1) obtained in this study as will be shown in the following section, together with those of our previous study13for the main secondary reactions, also rest of the secondary reactions have been supplied from GRI-Mech 3.0.16
The result on k1 is summarized in Table 1, as well as in Figure 3 compared with those of previous studies. Uncertainty on the evaluatedk1for the low temperature data comes mostly from the contamination by noise signal. Data quality can be greatly improved by conducting repetition of the measurement at the same condition, i.e., 3 times for the worst cases of this study (experimental data at the lowest temperature, 1350−1400 K). The experimental error at 1350 K is evaluated to be±50%, but decreases to±20% at 1400 K. The present result on k1is expressed by using a linear-least-squares analysis as
= − ± − ± × − − k T ln( /cm molecule s ) (14.81 1.22) (38.86 1.82) 10 / 1 3 1 1 3 (I)
Table 1. Summary of the Experimental Condition for the 100 ppm CH3OH + Ar Mixtures and the Results ofk1for the
Reaction CH3OH + Ar → Products (1) T/K p/atm k1a 1359 1.89 2.84× 10⁻¹⁹ 1373 1.82 4.71× 10⁻¹⁹ 1402 1.83 7.49× 10⁻¹⁹ 1443 1.60 8.95× 10⁻¹⁹ 1459 1.64 1.79× 10⁻¹⁸ 1463 1.64 1.74× 10⁻¹⁸ 1502 1.70 2.51× 10⁻¹⁸ 1540 1.81 6.04× 10⁻¹⁸ 1546 1.82 5.68× 10⁻¹⁸ 1556 1.84 9.09× 10⁻¹⁸ 1584 1.82 1.62× 10⁻¹⁷ 1606 1.65 2.39× 10⁻¹⁷ 1644 1.62 4.40× 10⁻¹⁷ aUnits: cm3molecule−1s−1
Figure 1.Examples of the observed evolutions of [H] produced in the 100 ppm CH3OH + Ar mixture. Key: black solid line, observed
evolution of [H], where, experimental condition is shown by the inset; black open circle, profiles of [H] obtained by the numerical simulation by using the reaction scheme of Table S-1, Supporting Information.
Figure 2.Example of the sensitivity analysis for the evolution of [H] demonstrated in Figure1. Sensitivity coefficient is defined as SHj=dYH/
d(lnkj), whereYHis the mass fraction of H in the test sample andkj
corresponds to the rate of thejth reaction in Table S-1, Supporting Information. Key: black lines, initiation reaction, CH3OH→ products;
green lines, hydrogen abstraction from CH3OH by radical species X,
CH3OH + X→ products; blue lines, reactions of3CH2radical; purple
line, CH3+ H +M→ CH4+ M. The numbers shown in the results of
SHj correspond to the reaction number in Table S-1, Supporting
over the temperature range of 1359−1644 K.
The present result on k1 is substantially smaller than the extrapolation of the most of the previous experimental data to the low temperature range, i.e., about an order of magnitude lower than indicated in the standard kinetic database for
thermal decomposition of CH3OH at 1300−1400 K.10
Although the results of the previous two theoretical calculations14,15 are inconsistent with each other above 1700 K, the present result seems to be consistent with these theoretical calculations over the temperature range of the present study, and also consistent with the extrapolation of the experimental work by Spindler et al.4
The present result on k1 is combined with that of our previous study at higher temperature range (T = 1660−2050 K) measured in the 0.48 ppm CH3OH + 500 ppm H2+ Ar and 10 ppm CH3OH + Ar mixtures,13then, the total decomposition ratek1for CH3OH + Ar→ products (1) is expressed by
= ± − ± × − − T ln(k /cm molecule s ) (14.24 0.51) (38.86 0.80) 10 / 1 3 1 1 3 (II)
in the temperature range 1359−2050 K. The summarized
expression of the experimental result given by (II) is consistent with the theoretical calculation by Jasper et al.15for the entire temperature range as shown in Figure 3.
Pressure dependence of k1 was extensively discussed in previous works.3,4,8,10The concentration range of bath gas (Ar) corresponding to the low pressure limit was evaluated in some of the previous studies; (0.7−23) × 1018/molecules cm−3forT = 1600−2100 K,4 (0.6−3) × 1018/molecules cm−3 for T = 1400−2200 K,3 and (2−25) × 1018/molecules cm−3for T = 1400−2200 K.8 Since the concentration and the temperature ranges of this study are overlapping with these previous studies, the measured rate in this study can be regarded as in the low pressure limit.
As shown by the open circles in Figure 1, evolutions of [H] computed by using this reaction mechanism with using the summarized rate expression given by (II) appear to be in excellent agreement with the experimental results on 100 ppm CH3OH + Ar mixture over a wide temperature range. As is demonstrated in the following paragraph, the evolution of [H] can be consistently predicted by this reaction model over a wide concentration range (0.35−100 ppm CH3OH diluted in Ar).
3.2. Measurement of the Branching Fractions for (1). The issue of this section is to investigate the branching fraction of (1) by conducting comparative measurements of H atom produced in the three different mixtures of highly diluted CH3OH in Ar, with addition of excess H2, O2, and no additives, respectively. Thefirst two mixtures are used to evaluate initial concentration of CH3OH and the branching fractions (1a),
respectively; measurement in the CH3OH + Ar has been
conducted to examine the branching fraction of (1c) obtained in our previous study.13
Investigation of the branching fraction (1a) by monitoring evolutions of H atoms in the mixture of highly diluted CH3OH with much excess O2, implies to be an effective method, i.e., 1CH
2produced in (1a) is equilibriated very quickly with3CH2 by the collision of Ar19 + ⇌ + CH2 M CH M 1 2 3 (2)
followed by the reactions of3CH
2and1CH2with O2, i.e.
+ → CH2 O products 3 2 (3) + → + CH2 O H products 3 2 (3a) + → + CH2 O O products 3 2 (3b) + →
CH2 O products without H and O atoms
3 2 (3c) + → CH2 O products 1 2 (4) + → + CH2 O H products 1 2 (4a) + → + CH2 O O products 1 2 (4b) + →
CH2 O products without H and O atoms
1
2 (4c)
which have been confirmed to be very fast with substantial production of H atoms.
For the oxidation of sufficiently low concentration CH3OH, the evolution of [H] is governed by the reactions 1−5 without having the contributions of other secondary reactions;
+ ⇌ +
H O2 OH O (5)
The magnitude of the reaction rate of (5) has been well established and reliable kinetic information is available,20 whereas the reaction of CH3 (the product of reaction 1b) with O2
+ ⇌
CH3 O2 products (6)
has been confirmed to be sufficiently slow below 2000 K unless concentration of O2is very high.21Quantitative measurement for the yields of H and O atoms in the reactions of1,3CH
2+ O2 → products has been conducted recently.22
With using this experimental result, it is possible to evaluate the branching of (1a).
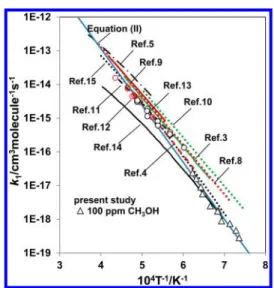
Figure 3. Comparison of the total rate constantk1 obtained in this
study to the results of the previous works. Key: black open triangle, present study (100 ppm CH3OH in Ar). The results of previous
studies are assigned by the reference number in thefigure: ref 3, green solid curve; ref 4, red dashed curve; ref 5, black dash-dotted curve; ref 9, red solid curve; ref 10, green dotted curve; ref 11, black dash curve; ref 12, red open circle (assigned ask1a); ref 13, black open circle; ref
14, black solid curve; ref 15, black dotted curve. The summary of the present study with our previous study (ref 13) given by eq II in the text is shown by the blue solid line.
Table 2. Summary of the Experimental Conditions for the Comparative Measurements of [H] Produced in the CH3OH + O2+ Ar, CH3OH + H2+ Ar, and CH3OH + Ar Mixtures
CH3OH (ppm) O2(ppm) H2(ppm) T5(K) P5(atm) ρ5(O2)a ρ5(CH3OH)a ρ5(Ar)a
0.36b 0 0 2009 1.92 0 7.01× 10¹² 7.01× 10¹⁸ 0 300 2012 1.92 0 7.01× 10¹² 7.01× 10¹⁸ 0 300 2012 1.92 0 7.01× 10¹² 7.01× 10¹⁸ 100 0 2012 1.92 7.01× 10¹⁴ 7.01× 10¹² 7.01× 10¹⁸ 100 0 2012 1.92 7.01× 10¹⁴ 7.01× 10¹² 7.01× 10¹⁸ 0 0 1950 1.98 0 7.44× 10¹² 7.44× 10¹⁸ 0 300 1950 1.98 0 7.44× 10¹² 7.44× 10¹⁸ 0 300 1954 1.98 0 7.44× 10¹² 7.44× 10¹⁸ 100 0 1945 1.97 7.42× 10¹⁴ 7.42× 10¹² 7.42× 10¹⁸ 100 0 1948 1.97 7.43× 10¹⁴ 7.43× 10¹² 7.43× 10¹⁸ 0 300 1905 2.04 0 7.87× 10¹² 7.87× 10¹⁸ 0 300 1902 2.03 0 7.86× 10¹² 7.86× 10¹⁸ 100 0 1902 2.03 7.86× 10¹⁴ 7.86× 10¹² 7.86× 10¹⁸ 100 0 1905 2.04 7.87× 10¹⁴ 7.87× 10¹² 7.87× 10¹⁸ 1.5± 0.1b 0 0 1988 1.97 0 1.09× 10¹³ 7.29× 10¹⁸ 0 0 1988 1.97 0 1.09× 10¹³ 7.29× 10¹⁸ 0 300 1988 1.98 0 1.09× 10¹³ 7.29× 10¹⁸ 0 300 1985 1.98 0 1.09× 10¹³ 7.29× 10¹⁸ 100 0 1981 1.97 7.28× 10¹⁴ 1.08× 10¹³ 7.28× 10¹⁸ 100 0 1985 1.97 7.28× 10¹⁴ 1.08× 10¹³ 7.28× 10¹⁸ 0 0 1932 2.03 0 1.16× 10¹³ 7.70× 10¹⁸ 0 300 1931 2.03 0 1.16× 10¹³ 7.70× 10¹⁸ 0 300 1928 2.02 0 1.16× 10¹³ 7.70× 10¹⁸ 100 0 1928 2.02 7.70× 10¹⁴ 1.16× 10¹³ 7.70× 10¹⁸ 100 0 1928 2.02 7.70× 10¹⁴ 1.16× 10¹³ 7.70× 10¹⁸ 0 0 1928 2.02 0 1.16× 10¹³ 7.70× 10¹⁸ 0 0 1886 2.09 0 1.22× 10¹³ 8.13× 10¹⁸ 0 300 1880 2.08 0 1.22× 10¹³ 8.13× 10¹⁸ 0 300 1883 2.09 0 1.22× 10¹³ 8.12× 10¹⁸ 100 0 1880 2.08 8.12× 10¹⁴ 1.22× 10¹³ 8.12× 10¹⁸ 100 0 1877 2.08 8.12× 10¹⁴ 1.22× 10¹³ 8.12× 10¹⁸ 0 0 1883 2.09 0 1.22× 10¹³ 8.12× 10¹⁸ 3.8b 100 0 2034 1.74 6.27× 10¹⁴ 2.20× 10¹³ 6.27× 10¹⁸ 100 0 2037 1.74 6.28× 10¹⁴ 2.20× 10¹³ 6.28× 10¹⁸ 100 0 2030 1.74 6.27× 10¹⁴ 2.20× 10¹³ 6.27× 10¹⁸ 0 0 2030 1.74 0 2.20× 10¹³ 6.27× 10¹⁸ 0 300 2030 1.74 0 2.20× 10¹³ 6.27× 10¹⁸ 100 0 1738 2.13 8.98× 10¹⁴ 3.14× 10¹³ 8.98× 10¹⁸ 100 0 1738 2.13 8.98× 10¹⁴ 3.14× 10¹³ 8.98× 10¹⁸ 100 0 1736 2.13 8.97× 10¹⁴ 3.14× 10¹³ 8.97× 10¹⁸ 0 300 1738 2.13 0 3.14× 10¹³ 8.98× 10¹⁸ 0 0 1737 2.13 0 3.14× 10¹³ 8.97× 10¹⁸ 100 0 1645 2.17 9.71× 10¹⁴ 3.40× 10¹³ 9.71× 10¹⁸ 100 0 1643 2.16 9.70× 10¹⁴ 3.40× 10¹³ 9.70× 10¹⁸ 100 0 1640 2.15 9.69× 10¹⁴ 3.40× 10¹³ 9.69× 10¹⁸ 0 300 1643 2.16 9.70× 10¹⁴ 3.40× 10¹³ 9.70× 10¹⁸ 0 0 1642 2.16 9.69× 10¹⁴ 3.40× 10¹³ 9.69× 10¹⁸ 100 400 0 1608 1.66 3.02× 10¹⁵ 7.55× 10¹⁴ 7.55× 10¹⁸ 400 0 1606 1.65 3.02× 10¹⁵ 7.55× 10¹⁴ 7.55× 10¹⁸ 400 0 1608 1.66 3.02× 10¹⁵ 7.55× 10¹⁴ 7.55× 10¹⁸ 400 0 1606 1.65 3.02× 10¹⁵ 7.55× 10¹⁴ 7.55× 10¹⁸ 400 0 1549 1.82 3.45× 10¹⁴ 8.64× 10¹⁴ 8.64× 10¹⁸ 400 0 1549 1.82 3.45× 10¹⁴ 8.64× 10¹⁴ 8.64× 10¹⁸ 400 0 1457 1.62 3.27× 10¹⁵ 8.17× 10¹⁴ 8.17× 10¹⁸ 400 0 1453 1.62 3.26× 10¹⁵ 8.16× 10¹⁴ 8.17× 10¹⁸
aUnits: molecules cm−3bConcentration is determined byfitting the evolution of H atom obtained by numerical simulation to the observed profile in
The branching fraction of (1c) was measured in our previous study13by using 1 ppm CH3OH diluted in Ar; the experimental result was summarized by,
= − ± × − ±
k k T
log( 1c/ )1 ( 2.88 1.88) 10 /3 (0.23 1.02)
(III)
Since the contribution of the secondary reactions in producing H atoms in the thermal decomposition of 1 ppm CH3OH was not sufficintly low enough, the branching fraction of (1c) is reinvestigated in this comparative study by using several sample mixtures (0.35, 1.5, and 3.6 ppm CH3OH in Ar) to reduce the possible uncertainty induced by the contribution of the secondary reactions in the numerical analysis.
Experimental conditions and the compositions of the
mixtures of CH3OH + H2 + Ar, CH3OH + O2 + Ar and
CH3OH + Ar used in this study are summarized in Table 2. Examples of such comparative measurements of H atoms in these mixtures are shown in Figure 4 for the case of 0.36 ppm CH3OH in Ar.
If the initial concentration of CH3OH, [CH3OH]0 is sufficiently low, the asymptote of [H]/[CH3OH]0 should be
approximately equal to 2, regardless of the branching fractions of (1), because the evolutions of [H] in such a low concentration of CH3OH with excess H2 can be accurately evaluated by taking into account the reactions of the products of (1) with H2, i.e. + ⇌ + OH H2 H H O2 (7) + ⇌ + CH2 H CH H 3 2 3 (8) + ⇌ + CH2 H CH H 1 2 3 (9) + ⇌ + CH3 H2 CH4 H (10)
In the present experiment, [CH3OH]0is simply evaluated by searching the profile of H atoms of kinetic simulation in the mixture of CH3OH + 300 ppm H2+ Ar, to achieve the bestfit to the observed profile of H atom, as are shown by the blue open circles and blue solid lines in Figure 4, respectively. It is worth mentioning that reaction 9 dominates over reaction 8 in the reaction of CH2with H2at elevated temperature range of 1800−2000 K, even though the concentration of1CH
2is only 4−5% of3CH2.23
Performance of the cross-check for the initial concentration of CH3OH conducted in this way should be very important to evaluate the branching fractions of (1) when the concentration of CH3OH is low; the evaluated [CH3OH]0by this method of analysis is found to be much lower than that initially assigned by the measurement of the partial pressure at the preparation of the sample mixtures.
The profiles of H atom produced in the 0.36 ppm CH3OH + Ar mixture are shown by the black lines in Figure 4, compared to those of kinetic simulation shown by black open circles. It is demonstrated that reasonable agreement is attained between the observed and computed profiles of [H], however, the signal intensity is not sufficiently strong enough, also, overlapped with substantial noise signal, therefore, the quantitative examination for the branching fraction of (1c) is conducted with using much higher concentration of CH3OH as is shown in the following paragraph.
The observed evolutions of [H] produced in the mixture of 0.36 ppm CH3OH + 100 ppm O2+ Ar are demonstrated by the red solid curve in Figure 4. For such low concentration CH3OH with much excess O2, the evolution of H atom can be well predicted by taking account the reactions 1 − 5 only. Then, analytical solution is given by assuming quasi-equilibrium between 1CH2 and 3CH2, i.e., [1CH2]/[3CH2] = Kc2 (an equilibrium constant of reaction 2);
ϕ ϕ ϕ = − − − − + ′ ′ − − − − − − ′ − − − ′ ′ − R R R R R R R R R R R R R R R R R
[H]/[CH OH] 2 [exp( t) exp( t)]
/( ) ( )( ) {[exp( t) exp( t)]/( ) [exp( t) exp( t)]/( )}/( ) 3 0 1c 1 1 5 5 1 1a 1 3a 3 1 5 5 1 3 5 5 3 3 1 (IV) where,R1=k1[M],R3=k3[O2],R3′ = R3(1 +α)/(1 + Kc2),α = (k4/k3)Kc2,R5=k5[O2],ϕ1a=k1a/k1,ϕ1c=k1c/k1,ϕ3a=k3a/k3, ϕ4a=k4a/k4, andϕ3a′ = (ϕ3a+αϕ4a)/(1 +α).
Asϕ1chas been confirmed to be very small, the evolution of H atoms is mainly governed by the second term in eq IV, i.e., the analytical solution clearly demonstrates that the magnitude of [H] in the low concentration CH3OH + excess O2is mainly determined by the branching fraction of (1a). The rates and the
Figure 4.Examples of the comparative measurement of [H] produced in the mixtures of 0.36 ppm CH3OH + 300 ppm H2+ Ar, 0.36 ppm
CH3OH + 100 ppm O2+ Ar, and 0.36 ppm CH3OH + Ar compared
with kinetic simulation. Experimental conditions: (A) (T = 2011 ± 2) K,P = 1.92 atm; (B) (T = 1950 ± 5) K, P = 1.98 atm; (C) (T = 1903 ± 3) K, P = 2.03 atm. Key: blue solid curve, observed evolution of [H] in the mixture of 0.36 ppm CH3OH + 300 ppm H2+ Ar; red solid
curve, observed evolution of [H] in the mixture of 0.36 ppm CH3OH
+100 ppm O2+ Ar; black solid curve, observed evolution of [H] in the
mixture of 0.36 ppm CH3OH + Ar; blue open circle, computed
evolution of [H] in the mixture of 0.36 ppm CH3OH + 300 ppm H2+
Ar; red open circle and red cross, computed evolution of [H] withϕ1a
= 0.2 and 0.4, respectively, in the mixture of 0.36 ppm CH3OH + 100
ppm O2 + Ar; black open circle, computed evolution of [H] in the
yields of producing H and O atoms in the reactions of1,3CH 2+ O2have been directly measured at high temperature range,22 i.e.,k3′/cm3molecule−1s−1= 2.74× 10⁻¹¹exp(−874/T), ϕ3a′ = 0.59 and ϕ3b′ = 0.25, where k3′, ϕ3a′, and ϕ3b′ denote the effective reaction rate of the CH2 + O2 reaction, and the production yields of H and O atoms, respectively, under the quasi-equilibrium between1CH
2and3CH2.
Construction of the reaction model available for the variety of products (other than H atom) is also one of the main issues of this study. For the reaction of3CH2+ O2, there are many product channels as shown below; although the product branching fractions have not fully understood, magnitudes of the branching of the following reactions have been estimated by using the results of the measured yields of H and O atoms22 together with the product branching fractions for CO2, CO and
H2CO measured at room temperature24 (assuming these
product branching ratios have no temperature dependence),
+ → + + CH2 O OH H CO 3 2 (3a-1) + → + CH2 O 2H CO 3 2 2 (3a-2) + → + CH2 O O H CO 3 2 2 (3b) + → + CH2 O H CO 3 2 2 2 (3c-1) + → + CH2 O H O CO 3 2 2 (3c-2)
where, the branching fractions of product channels in (4b)
+ → +
CH2 O O H CO
1
2 2 (4b)
has been tentatively assumed to be unity, because1CH 2+ O2 should correlate directly only to (4b) along the triplet surface; i.e., the other product channels in (4) may be minor. The kinetic parameters of the reactions of CH2+ O2estimated in this study are included in Table S-1, Supporting Information. Even if such simplified assumption for the branching fractions is not employed, the evolution of [H] can be well reproduced in the kinetic simulation as long as the branching ratios for (3) and (4) satisfy the observed yield for H atoms (ϕ3a′ = 0.59).22 Because of the minor contribution of1CH2in the reaction of CH2with O2, uncertainty for the product branching in reaction 4 does not bring serious error in predicting oxidation of CH3OH.
It is confirmed that the results of the numerical computation with using the reaction scheme in Table S-1 (Supporting Information) agree completely with the analytical solution given by (IV) for the 0.36 ppm CH3OH + 100 ppm O2diluted in Ar. In Figure 4, the result of kinetic analysis assumingϕ1a= 0.2 is shown by the red circles, and it appears to give reasonable agreement with observed profile of H, whereas, the result with assumingϕ1a= 0.4 (shown by red crosses) apparently does not fit to the experiment.
An example of the computed sensitivity coefficient of H atom with this reaction scheme is shown in Figure 5. It is clearly demonstrated that the evolution of [H] is mainly dependent on the reactions 1, 3, 4 and 5. The branching fraction of (1a) is very sensitive, as indicated in eq IV, to the observed profile of [H] in the mixture of CH3OH + O2+ Ar; i.e., the evolution of H atom produced in the oxidation of highly diluted CH3OH mostly depends on the reactions of CH2, the direct product of (1a), but CH3, the product of (1b), does not contribute at all in the present experimental condition.
The experimental results in the 0.36 ppm CH3OH + 100
ppm O2 mixture have not been included in the present
conclusion of ϕ1a (although estimated ϕ1a seems to be
reasonable), because the evolutions of [H] observed in this sample, as shown in Figure 4, appear to include substantial uncertainty.
The magnitude ofϕ1ais evaluated by using the experimental data with higher concentrations of CH3OH (1.5 and 3.8 ppm
CH3OH + 100 ppm O2 + Ar) showing better S/N ratio.
Examples of the comparison of kinetic analysis with observed evolution of [H] are demonstrated in Figure 6 (1.5 ppm CH3OH + 100 ppm O2+ Ar). In these higher concentration samples of CH3OH, the analytical solution (IV) cannot be applied anymore, because the contributions of the secondary reactions are too large; kinetic analysis has been conducted by numerical computation with using the reaction scheme of Table S-1, Supporting Information.
The results of ϕ1a evaluated in the samples of 1.5 and 3.6 ppm CH3OH + 100 ppm O2in Ar are summarized in Table 3. As a summary, the branching fraction of (1a) shown in Table 3 is given byϕ1a= 0.20± 0.04 (T = 1645−2035 K): temperature and pressure dependence ofϕ1ais not indicated.
The observed profiles of H atom produced in the 1.5 ppm CH3OH diluted in Ar are also shown by the black curves in Figure 6. It is demonstrated that observed evolutions of [H] can be reproduced very well by using the present kinetic model (given by the black circles in Figure 6). The same conclusion
has been derived for the 3.8 ppm CH3OH + Ar sample
mixtures. The numerical computation with an assumption,ϕ1c = 0, cannot reproduce the observed profile of [H] well. This may support the validity of the employed branching fraction of (1c) given by eq III.
From the present results on ϕ1a and ϕ1c, the branching fraction of (1b),ϕ1bis evaluated with using a formula,ϕ1b= 1 − ϕ1a− ϕ1c, and compared to those of the previous studies in Figure 7. The present experimental result onϕ1bis larger than the previous experimental result below 1800 K, but consistent
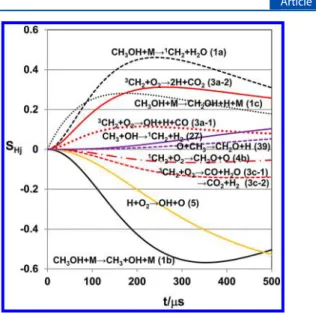
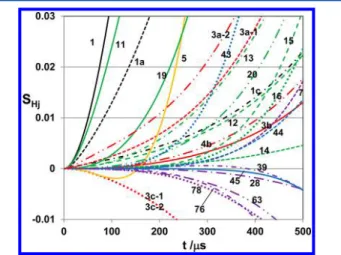
Figure 5.An example of the sensitivity analysis of H atom produced in the 0.36 ppm CH3OH + 100 ppm O2+ Ar mixture. Key: black curve,
thermal decomposition of CH3OH (1); red curve, reactions of CH2+
O2, (3) and (4); orange curve, H + O2⇌ OH + O (5); purple curve,
other second reactions. The reaction number attached to the calculated sensitivity coefficient corresponds to those in Table S-1, Supporting Information. Condition:T = 1950 K; P = 1.97 atm.
at higher temperature range.11The theoretical result by Jasper et al.15 is found to agree with the present study for all the temperature range studied, but the theoretical calculation by Xia et al.14is much smaller than all other studies as shown in the figure. Theoretical calculations indicate that ϕ1a has pressure dependence,14,15 The comparison of the present study (P = ca. 2 atm.) with previous experimental results (P =
0.4−1.1 atm.) indicates that the pressure dependence of ϕ1a should be small.
Arrhenius parameters of reaction 1a, 1b, and 1c have been evaluated based on the present experimental results onk1,ϕ1a, and ϕ1c, and included in the reaction scheme in Table S-1 (Supporting Information), where pressure dependence of the branching fractions has been ignored.
3.3. Production of H atoms in the oxidation of CH3OH at higher concentration. As demonstrated already in Figure 1, the reaction scheme of Table S-1, Supporting Information, appears to be successful in predicting evolutions of [H] produced in the pyrolysis of CH3OH for the sample of 100 ppm CH3OH in Ar. It may be also important to test this kinetic
model for the oxidation of CH3OH at the extended
concentration.
For this purpose, evolutions of [H] in the 100 ppm CH3OH + 400 ppm O2have been measured in this study and compared to those of the numerical simulation. The experimental conditions are also included in Table 2. Examples of the evolution of [H] measured at 1455, 1548, and 1763 K are shown by the red solid curves in Figure 8. The result of kinetic simulation with using the present reaction model is expressed by the red open circles showing that the agreement between the experiment and kinetic simulation is satisfactory. However, the computed evolutions of [H] assumingϕ1a= 0.4 (red crosses) are almost the same with those ofϕ1a= 0.2 (red circles). It is suggested that the sensitivity for the branching fractions of thermal decomposition of CH3OH becomes obscured by the increment of the contributions of the secondary reactions.
An example of the sensitivity analysis for the oxidation of such high concentration CH3OH is shown in Figure 9. Thermal decomposition of CH3OH (1) is the most sensitive to the evolution of [H] as shown by the black curves; also contributions of the secondary reactions increases, especially, reactions of hydrogen abstraction from CH3OH by the attack of radical species, + ⇌ + OH CH OH3 CH OH2 H O2 (11) + ⇌ + OH CH OH3 CH O3 H O2 (12) + ⇌ + CH3 CH OH3 CH OH2 CH4 (13) Figure 6.Comparison of the observed [H] produced in the mixtures
of 1.5 ppm CH3OH + 300 ppm H2+ Ar, 1.5 ppm CH3OH + 100 ppm
O2+ Ar, and 1.5 ppm CH3OH + Ar. Experimental conditions: (A) (T
= 1985± 2) K, P = 1.92 atm; (B) (T = 1930 ± 2) K, P = 2.02 atm; (C) (T = 1903 ± 3) K, P = 2.03 atm. Key: blue solid curve, observed evolution of [H] in the mixture of 1.5± 0.1 ppm CH3OH + 300 ppm
H2+ Ar; red solid curve, observed evolution of [H] in the mixture of
1.5 ± 0.1 ppm CH3OH + 100 ppm O2 + Ar; black solid curve,
observed evolution of [H] in the mixture of 1.5± 0.1 ppm CH3OH +
Ar; blue open circle, computed evolution of [H] in the mixture of 1.5 ± 0.1 ppm CH3OH + 300 ppm H2+ Ar; red open circle, computed
evolution of [H] withϕ1aindicated in thefigure; red cross, computed
evolution of [H] with ϕ1a = 0.4 in the mixture of 1.5 ± 0.1 ppm
CH3OH +100 ppm O2+ Ar; black open circle, computed evolution of
[H] in the mixture of 1.5± 0.1 ppm CH3OH + Ar.
Table 3. Summary of the Branching Fraction of (1a)
Measured in the 1.5± 0.1 and 3.8 ppm CH3OH +100 ppm
O2Mixtures CH3OH (ppm) O2(ppm) T5(K) P5(atm) ϕ1a 3.8 100 2035 1.74 0.15 3.8 100 1738 2.13 0.23 3.8 100 1645 2.17 0.17 1.6 100 1985 1.97 0.23 1.5 100 1930 2.02 0.23 1.4 100 1881 2.08 0.19
Figure 7.Summary of the branching fractionϕ1b. Open circle: present
study (ϕ1bis evaluated by assumingϕ1b= 1− ϕ1a− ϕ1c, whereϕ1cis
given by eq III in the text). The pressure range of this study is 1.74− 2.08 atm. Cross: experimental data of ref 11 (P = 0.4−1.1 atm.). Dotted line: theoretical calculation of ref 14 (P = 1 atm). Solid line: theoretical calculation of ref 15 (P = 1 atm).
+ ⇌ + CH3 CH OH3 CH O3 CH4 (14) + ⇌ + H CH OH3 CH OH2 H2 (15) + ⇌ + H CH OH3 CH O3 H2 (16) + ⇌ + CH2 CH OH CH O CH 3 3 3 3 (17) + ⇌ + CH2 CH OH CH CH OH 1 3 3 2 (18) + ⇌ + O CH OH3 OH CH OH2 (19) + ⇌ + O CH OH3 OH CH O3 (20)
are the most important secondary reactions. The reactions 11− 20 accelerate both consumption of CH3OH and formation of CH2O, i.e., CH2OH or CH3O radicals produced in (11)−(20) immediately decompose into H + CH2O at elevated
temper-ature. Some of these reactions exhibit substantial sensitivity as is clearly demonstrated by the green curves in Figure 9.
The Arrhenius rate parameters for (11)−(16) were evaluated by conducting ab initio calculation of the potential energies of the transition states with TST theory by Jodkowsky et al.,25 indicating that H abstraction from theα-site carbon atom (i.e.,
production of CH2OH) is the main channel. Direct
experimental information above 1000 K is available only for the reactions of OH + CH3OH→ products; Srinivasan et al.11 conducted OH absorption measurement in thermal decom-position of CH3OH and supplied the total rate of the OH + CH3OH reaction, i.e.,k11 + k12. The experimental result11 is substantially lower than the theoretical calculation of Jodkowsky et al.,25however, it is confirmed that difference of the magnitude of the rate parameters does not influence the evolution of [H] too much.
Contribution of dehydration reaction of CH3OH by CH2 may be one of the unique features of the CH3OH kinetic process.3CH
2+ CH3OH reaction 17 was studied theoretically by Li et al.26 This theoretical study suggests that the main product of reaction 17 is CH3 + CH3O; this is in distinct contrast to the other dehydration reactions, eqs 11−16, 19, and 20, and the kinetic parameterfitted to this theoretical result is employed in the present model; however, the1CH2+ CH3OH reaction, reaction 18, may dominate in the entire reactions of
CH2 + CH3OH at high temperature range, and the
contribution of reaction 17 in the oxidation process may be minor. Although the estimated rate by Tsang27is much lower than that given by Li et al., the evolutions of [H] calculated by using these two rates do not show clear difference each other. Sensitivity analysis suggests that the hydrogen abstraction reactions from the stable reaction intermediate, CH2O, have also some contributions as shown by the blue curves in Figure 9. It is interesting that the reactions of1,3CH2+ O2still keeps substantial sensitivity as shown by red curves in Figure 9 even for the 100 ppm CH3OH; this implies to be also the unique
feature of the kinetic mechanism of CH3OH oxidation
compared to other hydrocarbon fuels. 4. CONCLUSIONS
Reaction kinetics of the pyrolysis and oxidation of CH3OH are examined by analyzing evolutions of [H] over a wide
concentration range of CH3OH (0.35−100 ppm). Main
conclusions of this study are summarized as follows.
(i). The total decomposition rate k1 for CH3OH + Ar → products (1) is expressed as = − ± − ± × − − k T ln( /cm molecule s ) (14.29 0.51) (38.86 0.80) 10 / 1 3 1 1 3 (II)
in the temperature range 1359−2050 K. The present result on k1is about an order of magnitude lower than that indicated by most of the previous experimental studies at the lowest temperature range, but theoretical calculation by Jasper et al.15 is consistent with the present experimental study over the entire temperature range.
(ii). Comparative measurement of [H] produced in the mixtures of highly diluted CH3OH in Ar, with excess H2and O2 appears to be a sensitive method to evaluate the branching fractions of thermal decomposition of CH3OH, since the reaction of CH2with O2dominates for production of H atoms in the oxidation of low concentration CH3OH, even though the branching fraction of producing CH2radical is low. The result
Figure 8.Examples of the observed evolution of [H] produced in the mixtures of 100 ppm CH3OH + 400 ppm O2 + Ar compared with
kinetic simulation. Key: red solid line, present experiment; red circle, numerical simulation by using the reaction scheme of Table S-1 Supporting Information (with ϕ1a = 0.2); red cross, numerical
simulation by using the reaction scheme of Table S-1, Supporting Information (withϕ1a= 0.4).
Figure 9.Example of the sensitivity analysis of H atom produced in the 100 ppm CH3OH + 400 ppm O2+ Ar mixture. Key: black curve,
thermal decomposition of CH3OH (1); red curve, reactions of CH2+
O2, (3) and (4); orange curve, H + O2⇌ OH + O (5); green curve,
dehydration reaction X + CH3OH ⇌ XH + CH2OH; blue curve,
dehydration reaction X + CH2O⇌ XH + CHO; purple curve, other
reactions, where, X denotes reactive radical species such as H, O, OH, CH3, etc. The reaction number attached to the calculated sensitivity
coefficient corresponds to those in Table S-1, Supporting Information. Condition;T = 1548 K, P = 1.82 atm.
of this study on ϕ1a (= 0.20) is consistent with previous experimental and theoretical studies.11,15 Also the present comparative measurement suggests the validity of the branching fraction for (1c) measured in the previous work,13
= ± × − ±
k k T
log( 1c/ )1 (2.88 1.88) 10 /3 (0.23 1.02)
(III)
However, expression III may not be conclusive due to the substantial contributions of the secondary reactions into the evolution of [H].
(iii). On the basis of the results onk1andϕ1aobtained here, an extended reaction model for the pyrolysis and oxidation of CH3OH has been proposed to test over a wide concentration; it is confirmed that evolutions of [H] in the pyrolysis of (0.36
−100 ppm) CH3OH and oxidation of (0.36−100 ppm)
CH3OH + 100/400 ppm O2 can be well predicted by this
kinetic model. It is worth mentioning however that many of the kinetic parameters of the key reactions such as the branching fractions for 3CH
2+ O2 → products (3) have not been well established. The reaction scheme tested in this study should be optimized against evolutions of the species other than H atoms so as to guarantee the validity of the present reaction model. Further examination is desirable to test and improve the reaction model by conducting measurement of the stablefinal products (CO, CH2O, H2O) over a wide concentration range. Such work will supply important information to examine the key secondary reactions.
■
ASSOCIATED CONTENT*
S Supporting InformationReaction mechanism used for the analysis of the evolutions H atom in this study (Table S-1). This material is available free of charge via the Internet at http://pubs.acs.org.
■
AUTHOR INFORMATIONCorresponding Author
*E-mail: (N.-S.W.) nswang@nctu.edu.tw; (H.M.) matsui@tut. ac.jp.
Notes
The authors declare no competingfinancial interest.
■
ACKNOWLEDGMENTSThis study was supported by National Science Council of Taiwan under Grant No. NSC 100-2113-M-009-007. H.M. deeply acknowledge the supports by National Science Council of Taiwan and National Chiao Tung University.
■
REFERENCES(1) Arnowitz, D.; Naegeli, D. W.; Glassman, I.J. Phys. Chem. 1977, 81, 2555−2559.
(2) Tsuboi, T.; Katoh, M.; Kikuchi, S.; Hashimoto, K.Jpn. J. Appl. Phys. 1981, 20, 985−992.
(3) Dombrowsky, Ch.; Hoffmann, A.; Klatt, M.; Wagner, H. Gg.Ber. Bunsen-Ges. Phys. Chem. 1991, 95, 1685−1687.
(4) Spindler, K.; Wagner, H. Gg.Ber. Bunsen-Ges. Phys. Chem. 1982, 86, 2−13.
(5) Cribb, P. H.; Dove, J. E.; Yamazaki, S. Symp. (Int.) Combust., (Proc.) 1985, 20th, 779−787.
(6) Hidaka, Y.; Oki, T.; Kawano, H.J. Phys. Chem. 1989, 98, 7134− 7139.
(7) Norton, T. S.; Dryer, F. L.Int. J. Chem. Kinet. 1990, 22, 219−241. (8) Koike, T.; Kudo, M.; Maeda, I.; Yamada, H.Int. J. Chem. Kinet. 2000,32, 1−6.
(9) Krasnoperov, I. N.; Michael, J. V.J. Phys. Chem. A 2004, 108, 8317−8323.
(10) Baulch, D. L.; Bowman, C. T.; Cobos, C. J.; Cox, R. A.; Just, Th.; Kerr, J. A.; Pilling, M. J.; Stocker, D.; Troe, J.; Tsang, W.; et al.J. Phys. Chem. Ref. Data 2005, 34, 1059−1061.
(11) Srinivasan, N. K.; Su, M. -C.; Michael, J. V.J. Phys. Chem. A 2007,111, 3951−3958.
(12) Vasudevan, V.; Cook, R. D.; Hanson, R. K.; Bowman, C. T.; Golden, D. M.Int. J. Chem. Kinet. 2008, 40, 488−495.
(13) Lu, K. W.; Matsui, H.; Huang, C.-L.; Raghunath, P.; Wang, N.-S.; Lin, M. C.J. Phys. Chem. A 2010, 114, 5493−5502.
(14) Xia, W. S.; Zhu, R. S.; Lin, M. C.; Mebel, A. M.Faraday Discuss. 2002,119, 191−205.
(15) Jasper, A. W.; Klippenstein, S. J.; Harding, L. B.; Ruscic, B.J. Phys. Chem. A 2007, 111, 3932−3950.
(16) Smith, G. P.; Golden, D. M.; Frenklach, M.; Moriarty, N. W.; Eiteneer, B.; Goldenberg, M.; Bowman, C. T.; Hanson, R. K.; Song, S.; Gardiner, W. C., Jr.; Lissianski, V. V.et al. http://www.me.berkeley. edu/gri mech.
(17) Wu, C.-W.; Lee, Y.-P.; Xu, S.; Lin, M. C.J. Phys. Chem. A 2007, 111, 6693−6703.
(18) Yamauchi, N.; Miyoshi, A.; Kosaka, K.; Koshi, M.; Matsui, H.J. Phys. Chem. A 1999, 103, 2723−2733.
(19) Langford, A. O.; Petek, H.; Moore, C. B.J. Chem. Phys. 1983, 78, 6650−6659.
(20) Yu, E.-L.; Frenklach, M.; Masten, D. A.; Hanson, R. K.; Bowman, C. T.J. Phys. Chem. 1994, 98, 4770−4771.
(21) Yu, C.-L.; Wang, C.; Frenklach, M. J. Phys. Chem. 1995, 99, 14377−14387. Michel, J. V.; Kumaran, S. S.; Su, M.-C. J. Phys. Chem. A 1999,103, 5942−5948. Zhy, R.; Hsu, C.-C.; Lin, M. C. J. Chem. Phys. 2001,115, 195−203. Herbon, J. T.; Hanson, R. T.; Bowman, C. T.; Golden, D. M.Proc. Comb. Inst 2005, 30, 955−963. Srinivasan, N. K.; Su, M.-C.; Sutherland, J. W.; Michael, J. V.J. Phys. Chem. A 2005, 109, 7902−7914. Srinivasan, N. K.; Su, M.-C.; Michael, J. V. J. Phys. Chem. A 2007, 111, 11589−11591.
(22) Lee, P.-F.; Matsui, H.; Chen, W.-Y.; Wang, N.-S.J. Phys. Chem. A 2012, 116, 9245−9254.
(23) Lee, P.-F.; Matsui, H.; Wang, N.-S.J. Phys. Chem. A 2012, 116, 1891−1896. Friedrichs, G.; Wagner, H. G. Z. Phys. Chem. 2001, 215, 1601−1623.
(24) Alvarez, R. A.; Moore, C. B.J. Phys. Chem. 1994, 98, 174−183. (25) Jodkowski, J. T.; Rayez, M.-T.; Rayez, J.-C.; Berces, T.; Doke, S. J.J. Phys. Chem. A 1999, 103, 3750−3765.
(26) Li, J.; Song, X.; Peng, Z.; Hou, H.; Wang, B.J. Phys. Chem. A 2008,112, 12492−12497.
![Figure 1. Examples of the observed evolutions of [H] produced in the 100 ppm CH 3 OH + Ar mixture](https://thumb-ap.123doks.com/thumbv2/9libinfo/7957583.158031/3.938.494.842.390.644/figure-examples-observed-evolutions-produced-ppm-ch-mixture.webp)
![Table 2. Summary of the Experimental Conditions for the Comparative Measurements of [H] Produced in the CH 3 OH + O 2 + Ar, CH 3 OH + H 2 + Ar, and CH 3 OH + Ar Mixtures](https://thumb-ap.123doks.com/thumbv2/9libinfo/7957583.158031/5.938.100.846.142.1104/table-summary-experimental-conditions-comparative-measurements-produced-mixtures.webp)
![Figure 4. Examples of the comparative measurement of [H] produced in the mixtures of 0.36 ppm CH 3 OH + 300 ppm H 2 + Ar, 0.36 ppm](https://thumb-ap.123doks.com/thumbv2/9libinfo/7957583.158031/6.938.99.429.469.899/figure-examples-comparative-measurement-produced-mixtures-ppm-ch.webp)