Research Article
Local Packing Density Is the Main Structural Determinant of the
Rate of Protein Sequence Evolution at Site Level
So-Wei Yeh,
1,2Tsun-Tsao Huang,
1,2Jen-Wei Liu,
1,2Sung-Huan Yu,
1,2Chien-Hua Shih,
1,2Jenn-Kang Hwang,
1,2and Julian Echave
31Institute of Bioinformatics and Systems Biology, National Chiao Tung University, Hsinchu 30050, Taiwan
2Center for Bioinformatics Research, National Chiao Tung University, Hsinchu 30050, Taiwan
3Escuela de Ciencia y Tecnolog´ıa, Universidad Nacional de San Mart´ın, Mart´ın de Irigoyen 3100,
San Mart´ın, 1650 Buenos Aires, Argentina
Correspondence should be addressed to Jenn-Kang Hwang; [email protected] and Julian Echave; [email protected]
Received 28 February 2014; Revised 6 June 2014; Accepted 9 June 2014; Published 9 July 2014 Academic Editor: Liam McGuffin
Copyright © 2014 So-Wei Yeh et al. This is an open access article distributed under the Creative Commons Attribution License, which permits unrestricted use, distribution, and reproduction in any medium, provided the original work is properly cited. Functional and biophysical constraints result in site-dependent patterns of protein sequence variability. It is commonly assumed that the key structural determinant of site-specific rates of evolution is the Relative Solvent Accessibility (RSA). However, a recent study found that amino acid substitution rates correlate better with two Local Packing Density (LPD) measures, the Weighted Contact Number (WCN) and the Contact Number (CN), than with RSA. This work aims at a more thorough assessment. To this end, in addition to substitution rates, we considered four other sequence variability scores, four measures of solvent accessibility (SA), and other CN measures. We compared all properties for each protein of a structurally and functionally diverse representative dataset of monomeric enzymes. We show that the best sequence variability measures take into account phylogenetic tree topology. More importantly, we show that both LPD measures (WCN and CN) correlate better than all of the SA measures, regardless of the sequence variability score used. Moreover, the independent contribution of the best LPD measure is approximately four times larger than that of the best SA measure. This study strongly supports the conclusion that a site’s packing density rather than its solvent accessibility is the main structural determinant of its rate of evolution.
1. Introduction
The evolutionary divergence of protein amino acid sequences is subject to purifying selection against amino acid substi-tutions imposed by functional and biophysical constraints [1–6]. Due to such constraints, the sites (residues) of a protein amino acid sequence differ in their evolutionary rate (the number of amino acid substitutions per unit of evolutionary time). As a result, multiple alignments of evo-lutionary related (homologous) proteins show clear site-dep-endent conservation patterns. Typically, only a few sites are directly related to function and their high conservation is due to direct function-specific selection. Mutations at most other sites affect fitness indirectly through their effect on the protein’s folding, stability, structure, or dynamics [6]. Here,
we focus on the effect of structural constraints on site-specific sequence divergence.
There are two structural properties that have emerged as the best candidates to account for site-specific rates of evolution: Solvent Accessibility (SA) and Local Packing Density (LPD). Several studies have shown that site-specific substitution rates correlate with SA, measured by the Relative Solvent Accessibility (RSA) [7–11]. Generally, RSA is considered to be the main structural determinant of evolutionary rate at site level. However, site-specific sequence variability has also been reported to correlate significantly with LPD, measured using either the Contact Number (CN) [9,11,12] or the Weighted Contact Number (WCN) [11,13].
Of the cited studies, the only two that compared SA and LPD measures as determinants of site-specific evolutionary
Volume 2014, Article ID 572409, 10 pages http://dx.doi.org/10.1155/2014/572409
rates found opposite results [9,11]. Franzosa and Xia consid-ered several structural measures regarding their correlation with rates of evolution and found RSA and CN to be the best correlates, with RSA performing slightly better but CN making a significant independent contribution [9]. Moreover, they found that the other structural measures had either no effect or no independent effect on sequence variability. In contrast, Yeh et al. compared RSA with two LPD measures, WCN and CN, on a larger and more divergent dataset of proteins with much better signal and found that both LPD measures correlate better with evolutionary rates than RSA [11]. Moreover, they showed that once LPD is controlled for, the independent contribution of RSA is very small. Furthermore, we recently developed a mechanistic model of protein evolution that explains why rate of evolution is related to LPD [14]. The purpose of the present work is to perform a thorough assessment of the thesis that the packing density of a protein site rather than its solvent accessibility is the main structural determinant of its sequence variability.
There are different ways to quantify sequence variabil-ity, SA, and LPD. In a previous study [11], we quantified sequence variability using rates of evolution, RSA values were calculated following Ramsey et al. [10], and we used two LPD measures: WCN and CN with 13 ˚A cut-off radius. To further assess the packing density versus solvent accessibility as determinants of evolutionary rates issue, here we consider other measures of sequence variability, SA, and LPD. First, we considered five popular measures of sequence variabil-ity/conservation that differ methodologically and conceptu-ally [15–17]. Second, we considered four measures of SA: the Absolute Solvent Accessibility (ASA) and the three different measures of RSA [18]. Finally, we considered the effect of changing the cut-off radius used in the definition of CN. Given a sequence or structural measure𝑋𝑠 for each site of a protein’s sequence, one can obtain a site-dependent profile 𝑋 = (𝑋1, 𝑋2, . . . , 𝑋𝑁) for a protein of length 𝑁. The sequence and structure profiles we consider are summarized inTable 1. We compared sequence and structural profiles for a diverse representative dataset of monomeric enzymes. For each protein, we compared site-dependent structural profiles with sequence variability profiles, quantified their similari-ties, and analyzed the resulting data to address the two ques-tions. First, what are the best measures of sequence variability for the sake of studying the sequence-structure evolutionary relationship at site level? Second, what are the structural measures that best quantify the structural evolutionary con-straints on sequence divergence? More specifically, does this more thorough analysis support the conclusion that LPD measures outperform SA measures as quantifiers of site-specific evolutionary constraints on sequence divergence?
We found significant sequence-structure correlations regardless of the specific method used to estimate LPD, SA, and sequence variability. Among the sequence variability measures, the ones that take into account the topology of the phylogenetic tree lead to significantly higher sequence-structure correlations with all structural profiles. Regarding structural properties, LPD measures clearly outperform SA measures as predictors of sequence variability, regardless of the specific sequence variability measure used. Therefore,
this study provides strong support to our previous finding that site-specific evolutionary rates are determined mainly by packing density rather than solvent accessibility [11].
2. Materials and Methods
2.1. Dataset. We used the nonredundant dataset of 216
mono-meric enzymes of our previous study [11]. The pairwise seq-uence identity of all pairs of proteins of the dataset is less than 25%. The X-ray structures have less than five missing residues, and they are monomeric (i.e., their biological unit is a single chain). The lengths range from 96 to 1287 sites, with a mean of 361 sites. There are enzymes of all six main EC classes [19] and domains of all main SCOP structural classes [20]. Details of the dataset can be found in Table S1 in Supplementary Mate-rial available online athttp://dx.doi.org/10.1155/2014/572409. This set is representative of soluble globular monomeric enzymes.
2.2. Multiple Sequence Alignment. For each protein of the
da-taset, a multiple sequence alignment (MSA) was obtained fol-lowing the ConSurf protocol [21,22]. First, PSI-BLAST [23] with an𝐸-value cut-off of 10−3and three iterations was used to retrieve homologous sequences from the Clean Uniprot database [24]. Second, all sequences that satisfy the following criteria were removed: (1) sequences with more than 95% identity to the query sequence; (2) sequences shorter than 60% of the query sequence; (3) fragment sequences that over-lap by under 10%. Third, CD-HIT [25] was used to select up to maximum 300 most significant representative sequences. Finally, the MSA was obtained using MUSCLE [26].
2.3. Sequence Profiles. For each protein, we used its MSA to
calculate five sequence variability profiles separately, which are summarized inTable 1and described here.
ConSurf.𝐶𝑆 = (𝐶𝑆1, 𝐶𝑆2, . . . , 𝐶𝑆𝑁), where 𝐶𝑆𝑖is the relative rate of evolution of site𝑖 and 𝑁 is the number of sites. Given the MSA, the site-specific relative rates are calculated using Rate4Site [27, 28]. Rate4Site builds the phylogenetic tree using the neighbor-joining algorithm and estimates the rates using an empirical Bayesian method and the JTT substitution matrix.
Real-Valued Evolutionary Trace.𝐸𝑇 = (𝐸𝑇1, 𝐸𝑇2, . . . , 𝐸𝑇𝑁) is
a profile of scores that measures the variability of each site taking into account the topology of the phylogenetic tree and the variability within groups of sequences defined by such topology [29]. Given the MSA, the tree’s topology is obtained using the UPGMA algorithm [30]. The tree is used to define groups of sequences, the Shannon entropy is used to measure within-group variability, and ET is a sum of such entropies with group-dependent weights. Branch-lengths are not taken into account in the calculation.
Karlin & Brocchieri Sum-of-Pairs.𝐾𝐵𝑆𝑃 = (𝐾𝐵𝑆𝑃1, 𝐾𝐵𝑆𝑃2,
. . . , 𝐾𝐵𝑆𝑃𝑁) consists of conservation scores obtained by
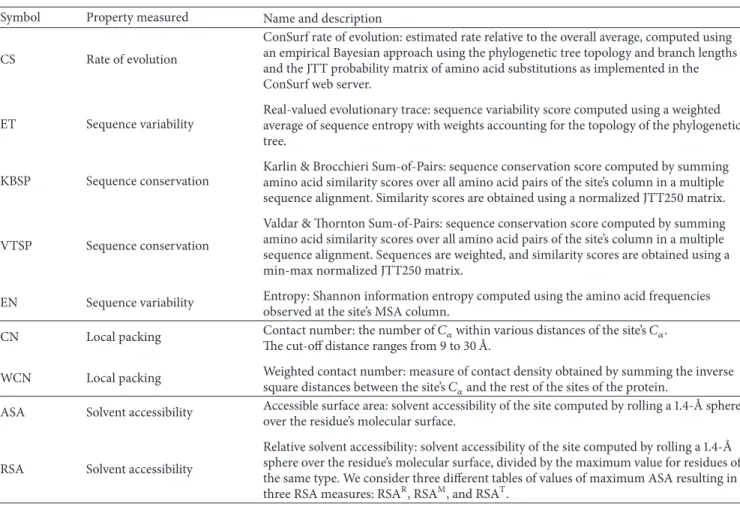
Table 1: Site-specific properties. Symbol Property measured Name and description
CS Rate of evolution
ConSurf rate of evolution: estimated rate relative to the overall average, computed using an empirical Bayesian approach using the phylogenetic tree topology and branch lengths and the JTT probability matrix of amino acid substitutions as implemented in the ConSurf web server.
ET Sequence variability
Real-valued evolutionary trace: sequence variability score computed using a weighted average of sequence entropy with weights accounting for the topology of the phylogenetic tree.
KBSP Sequence conservation
Karlin & Brocchieri Sum-of-Pairs: sequence conservation score computed by summing amino acid similarity scores over all amino acid pairs of the site’s column in a multiple sequence alignment. Similarity scores are obtained using a normalized JTT250 matrix.
VTSP Sequence conservation
Valdar & Thornton Sum-of-Pairs: sequence conservation score computed by summing amino acid similarity scores over all amino acid pairs of the site’s column in a multiple sequence alignment. Sequences are weighted, and similarity scores are obtained using a min-max normalized JTT250 matrix.
EN Sequence variability Entropy: Shannon information entropy computed using the amino acid frequencies observed at the site’s MSA column.
CN Local packing Contact number: the number of𝐶𝛼within various distances of the site’s𝐶𝛼.
The cut-off distance ranges from 9 to 30 ˚A.
WCN Local packing Weighted contact number: measure of contact density obtained by summing the inverse square distances between the site’s𝐶𝛼and the rest of the sites of the protein.
ASA Solvent accessibility Accessible surface area: solvent accessibility of the site computed by rolling a 1.4- ˚A sphere over the residue’s molecular surface.
RSA Solvent accessibility
Relative solvent accessibility: solvent accessibility of the site computed by rolling a 1.4- ˚A sphere over the residue’s molecular surface, divided by the maximum value for residues of the same type. We consider three different tables of values of maximum ASA resulting in three RSA measures: RSAR, RSAM, and RSAT.
substitution matrix over all pairs of sequences of the MSA [31]. In this study, we used the JTT250 substitution matrix [16].
Valdar & Thornton Sum-of-Pairs.𝑉𝑇𝑆𝑃 = (𝑉𝑇𝑆𝑃1, 𝑉𝑇𝑆𝑃2,
. . . , 𝑉𝑇𝑆𝑃𝑁) consists of conservation scores obtained by adding over sequence pairs the amino acid similarity scores from a normalized substitution matrix [32]. The difference between the VTSP and the KBSP is that VTSP uses a different procedure to normalize the substitution matrix and weights sequences to reduce possible biases introduced by closely related sequences. We used the JTT250 substitution matrix [16].
Entropy.𝐸𝑁 = (𝐸𝑁1, 𝐸𝑁2, . . . , 𝐸𝑁𝑁) consists of variability
scores measured by Shannon’s information entropy obtained from the site-specific amino acid frequencies [33]. The entropy at each sequence position is defined as 𝐸𝑁𝑖 = − ∑𝑎𝑓𝑖𝑎ln𝑓𝑖𝑎, where𝑓𝑖𝑎 is the frequency of an amino acid type 𝑎 at sequence position 𝑖. The entropy is zero for a completely conserved site and increases with
variability.
2.4. Structural Profiles. For each protein, we used its PDB file
[34] to calculate the structural profiles summarized inTable 1
and described here.
2.4.1. Local Packing Density
Weighted Contact Number. 𝑊𝐶𝑁 = (𝑊𝐶𝑁1, 𝑊𝐶𝑁2, . . . ,
𝑊𝐶𝑁𝑁) is a local packing density profile defined in [35].
WCN of residue𝑖 is 𝑊𝐶𝑁𝑖= ∑𝑁𝑗 ̸= 𝑖1/𝑟2𝑖𝑗, where𝑟𝑖𝑗is the dis-tance between the𝐶𝛼of residues𝑖 and 𝑗 and 𝑁 is the number of residues.
Contact Number. 𝐶𝑁 = (𝐶𝑁1, 𝐶𝑁2, . . . , 𝐶𝑁𝑁) is a local
packing density profile. The CN of a site is defined as the num-ber𝐶𝛼within a spherical neighbourhood of cut-off radius𝑟0. We calculated CN values with𝑟0ranging from 9 to 30 ˚A, with an interval of 1 ˚A to find the optimum cut-off radius.
2.4.2. Solvent Accessibility
Absolute Solvent Accessibility. 𝐴𝑆𝐴 = (𝐴𝑆𝐴1, 𝐴𝑆𝐴2, . . . ,
𝐴𝑆𝐴𝑁) is a solvent accessibility profile. The absolute solvent accessibility of a site is computed by rolling a 1.4 ˚A sphere, simulating a water molecule, over the residue’s molecular surface. We used the program DSSP [36].
Relative Solvent Accessibility Profile.𝑅𝑆𝐴 = (𝑅𝑆𝐴1, 𝑅𝑆𝐴2, . . . ,
𝑅𝑆𝐴𝑁) consists of site-specific measures of solvent accessibil-ity. The Relative Solvent Accessibility (RSA) of a residue is its ASA divided by the maximum ASA for the given amino acid
type. We used three different values of the maximum ASA: those of Rose et al. [37], Miller et al. [38], and Tien et al. [18], leading to, respectively, three different RSA profiles: RSAR, RSAM, and RSAT.
2.5. Profile Comparison. For each protein, we compared
all sequence profiles with all structural profiles. To reduce noise, all profiles were smoothed using a sliding window of size three as recommended in Pei and Grishin [15]. The similarity between two profiles was quantified using Pearson’s correlation coefficient, which ranges from −1 for perfectly anticorrelated profiles to 1 for perfectly correlated ones. For unrelated profiles, the expected value is 0. Since KBSP and VTSP are measures of conservation rather than variability, we changed their sign, so that the most conserved sites have lower score. We did the same for WCN and CN so that the sites with higher local packing density, which are expected to be more conserved, get the lowest score. In this way, all significant relationships will result in positive correlations.
Pearson correlations are especially useful for linear rela-tionships between the variables compared. In the present case, their use is justified because site-specific rates of evolution are linearly related to both RSA and LPD [9,10,
14]. However, in order to further support the conclusions regardless of whether the relationship is linear or not, we also calculated the rank-based Spearman correlation coefficients between the different profiles and performed nonparametric rank-based statistical assessments described next.
2.6. Statistical Assessment to Compare Two Predictor Vari-ables. Given a reference sequence (structure) profile𝑦, we
compared two structural (sequence) profiles𝑥1and𝑥2using their Pearson or Spearman correlation coefficients𝜌(𝑦, 𝑥1) and 𝜌(𝑦, 𝑥2). To assess whether 𝜌(𝑦, 𝑥1) > 𝜌(𝑦, 𝑥2), we performed three statistical tests. First, we used a paired𝑡-test to assess whether the means over proteins satisfy⟨𝜌(𝑦, 𝑥1)⟩ > ⟨𝜌(𝑦, 𝑥2)⟩. Second, we calculated the proportion proteins for which𝜌(𝑦, 𝑥1) > 𝜌(𝑦, 𝑥2) and used a binomial test to assess whether such proportion is larger than 50%. Third, we tested whether𝜌(𝑦, 𝑥1) > 𝜌(𝑦, 𝑥2) using Wilcoxon’s signed-rank test with matched pairs. Wherever we use the term “significant” we mean that the𝑃 value of the test that gives the worst𝑃 value is smaller than 0.01.
We note here that the𝑃 value of the 𝑡-test is strictly valid only under the assumption of a normal distribution of the random variable considered, which in the present case is a good approximation. Despite this, we note that in general the 𝑡-test is robust with respect to departures from normality. Therefore the𝑡-test is suitable for the present case. In spite of this, for the sake of a more thorough assessment, we also used the binomial test and Wilcoxon’s test that do not depend on any assumptions about the form of the underlying distributions.
2.7. Statistical Assessment of the Redundant and Independent Contributions of LPD and RSA to Rates of Evolution. To
address the issue of the relative importance of WCN (the best LPD measure) and RSAT (the best RSA measure) as
predictors of CS (the best sequence variability measure), we used a variance partitioning analysis in which the overall explained variance is split into overlapping and unique contributions of WCN and RSAT. For the case of a linear fit CS ∼ WCN + RSAT, the variance of CS explained together by WCN and RSATis the square of the bivariate correlation coefficient𝑅2. This can be partitioned into the sum of three contributions:
𝑅2= 𝜌2(CS, WCN or RSAT)
+ 𝜌2(CS, WCN | RSAT) + 𝜌2(CS, RSAT| WCN) .
(1) The first term accounts for the redundant contribution of the independent variables and is due to the fact that they correlate with each other. The last two terms are the square semipartial correlations of CS with each of the independent variables controlling the other and they represent their unique contributions [11,39,40]. Another way to interpret this partitioning is that the unique contribution of a variable is the increase in𝑅2that results from adding that variable to the linear fit.
3. Results and Discussion
For each of the 216 proteins of our dataset, we obtained the structure from the Protein Data Bank [34] and built a multiple sequence alignment. Given a protein, we calculated all the site-dependent sequence and structural profiles sum-marized inTable 1and described inSection 2. The sequence variability profiles are the ConSurf rate of evolution (CS), the Evolutionary Trace score (ET), the Karlin & Brocchieri of-Pairs score (KBSP), the Valdar & Thornton Sum-of-Pairs score (VTSP), and the Shannon Entropy (EN). The structural profiles are the Weighted Contact Number (WCN), the simpler Contact Number (CN) with varying cut-off radii, the Absolute Solvent Accessibility (ASA), and three measures of Relative Solvent Accessibility: RSAR, RSAM, and RSAT.
For each protein, we calculated Pearson’s correlation coef-ficients between each sequence profile and each structural profile.Table 2shows the average over proteins of such corre-lations. Similar results are found using Spearman correlations (Table S8). All values are significantly positive. Therefore, in general, all structural profiles are significantly correlated with all sequence profiles. However, there are significantly different sequence-structure correlations depending on the sequence and structural measures compared.
3.1. Comparison of Sequence Measures. What are the
seq-uence variability measures resulting in higher seqseq-uence- sequence-structure correlations? Table 2 (reading it rowwise) and
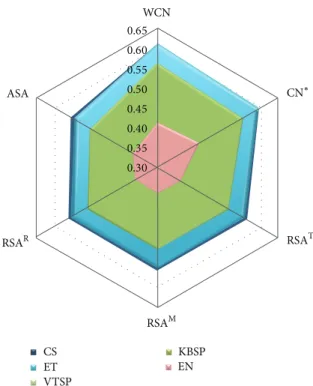
Figure 1show the effect of different sequence measures on average sequence-structure correlations. The five sequence profiles cluster into three groups. For all structural measures, Shannon’s entropy EN gives by far the worst sequence-structure correlations. The Sum-of-Pairs scores KBSP and VTSP give almost identical sequence-structure correlations,
Table 2: Mean structure-sequence Pearson correlations. Property Profile CS ET KBSP VTSP EN LPD WCN 0.608 0.609 0.567 0.567 0.413 CN∗ 0.596 0.596 0.551 0.551 0.422 SA RSAT 0.559 0.553 0.508 0.507 0.365 RSAM 0.558 0.551 0.505 0.504 0.364 RSAR 0.557 0.551 0.505 0.504 0.364 ASA 0.551 0.542 0.497 0.496 0.371
∗For each sequence variability profile, the cut-off radius of CN was chosen
to maximize the CN-sequence average correlation coefficients. The cut-off radii for CS, ET, KBSP, VTSP, and EN are 19 ˚A, 19 ˚A, 18 ˚A, 18 ˚A, and 20 ˚A, respectively. Values are the structure-sequence Pearson correlation coefficients averaged over all proteins of the dataset.
much better than EN. CS and ET lead to the highest sequence-structure correlations, with CS either similar to or slightly better than ET depending on structural measure. As we will see in the next section, the best solvent accessibility measure is RSAT and the best packing density measure is WCN. Regarding the correlation with RSAT, the means follow the order CS≅ ET > KBSP ≅ VTSP > EN, as can be seen from
Table 2. This order is supported by all statistical tests (Table S2). Further, a protein-by-protein comparison shows that CS and ET have higher correlations with RSAT than KBSP and VTSP for more than 70% of the proteins and the latter are better than EN for more than 80% of the cases, both values being significantly larger than 50% according to a binomial test (Table S2). A similar assessment shows that, with respect to their correlations with WCN, sequence profiles, again, follow the order CS≅ ET > KBSP ≅ VTSP > EN, as seen in
Table 2, and supported by all statistical tests (Table S3). The same conclusions are reached using Spearman coefficients (see Figure S1, Table S8, Table S9, and Table S10).
To interpret the previous results, we notice that CS and ET are the only methods that take into account the topology of the phylogenetic tree, which seems to be the key factor responsible for the improvement over the Sum-of-Pairs methods KBSP and VTSP. Entropy, EN, which takes into account neither the tree topology nor the substitution proba-bilities, gives very poor sequence-structure correlations. Even though difference between CS and ET is in general not statistically significant, CS does give slightly better results (see
Figure 1and Figure S1). Moreover, while ET is an empirical score, CS has a clear evolutionary meaning, since it is the site-specific rate of evolution inferred using a robust Bayesian approach and an explicit evolutionary model. Therefore, we consider CS to be the best measure of sequence variability for the purpose of studying the sequence-structure evolutionary relationship.
3.2. Comparison of Structural Measures. What are the
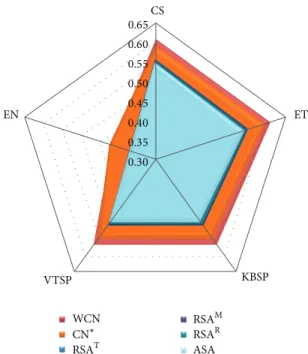
struc-tural properties correlating better with sequence variability measures? Inspection ofTable 2(columnwise) andFigure 2
shows clearly that LPD measures (WCN and CN∗) correlate, on average, better with all sequence variability measures than
0.65 0.60 0.55 0.50 0.45 0.40 0.35 0.30 WCN ASA RSAR RSAM RSAT CN∗ CS ET VTSP KBSP EN
Figure 1: Comparison of sequence variability profiles by their average Pearson’s correlation coefficients with different structural profiles. The sequence variability scores (listed in the figure legend) are ConSurf rate of evolution (CS), Evolutionary Trace score (ET), Karlin & Brocchieri Sum-of-Pairs score (KBSP), Valdar & Thornton Sum-of-Pairs score (VTSP), and Entropy (EN). The structural properties (the apices of the hexagon) are Weighted Contact Num-ber (WCN), Contact NumNum-ber (CN), Relative Solvent Accessibility (RSA), and Absolute Solvent Accessibility (ASA). The asterisk mark on CN means that the cut-off radius was chosen to maximize each CN-sequence average correlation. The cut-off radii for CS, ET, KBSP, VTSP, and EN are 19 ˚A, 19 ˚A, 18 ˚A, 18 ˚A, and 20 ˚A, respectively. Superscript letters distinguish RSA profiles obtained using different methods.
SA measures (ASA, RSAR, RSAM, and RSAT). Similar results are seen using Spearman correlations (Table S8 and Figure S2). In the following sections, we perform a more detailed comparison.
3.2.1. Comparison of Solvent Accessibility (SA) Measures.
What is the best solvent accessibility measure? FromTable 2
and Figure 2, it is clear that all SA measures give similar sequence-structure correlations for all sequence variability measures. Except for EN, which is a poor sequence variability score, RSA measures are larger than ASA (seeTable 2), which is supported by all statistical tests (Table S4). Among the relative SA measures, RSAR, RSAM, and RSAT, differences are very small. However, all statistical tests indicate that the best RSA-sequence correlation is obtained using RSAT, based on the recent maximum allowed ASA proposed by Tien et al. [18] (Table S4). Thus, regarding sequence-structure correlations, RSAT is the best measure of solvent accessibility. The same conclusions follow from similar analyses of Spearman corre-lations (Table S8, Figure S2, and Table S11).
CS EN VTSP KBSP ET RSAR RSAM RSAT CN∗ WCN ASA 0.65 0.60 0.55 0.50 0.45 0.40 0.35 0.30
Figure 2: Comparison of structural profiles by their average Pearson’s correlation coefficients with different sequence variabil-ity profiles. The sequence variabilvariabil-ity measures (the axes of the pentagon) are ConSurf rate of evolution (CS), Evolutionary Trace score (ET), Karlin & Brocchieri Sum-of-Pairs score (KBSP), Valdar & Thornton Sum-of-Pairs score (VTSP), and Entropy (EN). The structural properties (listed in the figure legend) are Weighted Contact Number (WCN), Contact Number (CN), Relative Solvent Accessibility (RSA), and Absolute Solvent Accessibility (ASA). The asterisk mark on CN means that the cut-off radius was chosen to maximize each CN-sequence average correlation. The cut-off radii for CS, ET, KBSP, VTSP, and EN are 19 ˚A, 19 ˚A, 18 ˚A, 18 ˚A, and 20 ˚A, respectively. Superscript letters distinguish RSA profiles obtained using different methods.
3.2.2. Comparison of Local Packing Density (LPD) Measures.
What is the best LPD measure? InTable 2andFigure 2, we show the mean sequence-structure correlations for WCN and CN∗ with the different sequence variability measures. WCN is a parameter-free measure. CN, on the other hand, depends on a cut-off radius. CN∗was obtained by varying the cut-off radius and finding the maximum (Table S5).Table 2
and Figure 2 show that, except for the poorest sequence variability score EN, WCN correlates, on average, better than CN∗ for all other site-dependent sequence profiles (Table S6). Moreover, for more than 50% of the proteins, WCN outperforms CN∗for all sequence variability measures except EN (Table S6). Similar conclusions follow from analyses of Spearman correlations (Figures S2, Table S8, Table S12, and Table S13). To summarize, WCN is a better LPD measure than CN to study the LPD-sequence relationship.
3.2.3. Weighted Contact Number (WCN) versus Relative Sol-vent Accessibility (RSA). To complete this study, we
per-form a more detailed comparison between the best LPD measure (WCN) and the best SA measure (RSAT).Table 2,
Table 3: Comparison between WCN and RSAT using sequence profiles as reference. Reference WCN RSAT Δ1 %2 CS 0.608 0.559 0.049∗ 79† ET 0.609 0.553 0.056∗ 80† KBSP 0.567 0.508 0.059∗ 82† VTSP 0.567 0.507 0.060∗ 83† EN 0.413 0.365 0.048∗ 77†
1Difference between the mean correlations of WCN and RSAT
.
2The percentage of cases for WCN> RSAT. ∗𝑃 value ≪ 10−3according to a paired𝑡-test. †𝑃 value ≪ 10−3according to a binomial test.
𝜌 (CS, W CN) 𝜌 (CS, RSA) 1 0.8 0.6 0.4 0.2 0 0 0.2 0.4 0.6 0.8 1 79% 21%
Figure 3: Local packing density versus solvent accessibility as deter-minants of site-specific evolutionary rates. Points above (below) the diagonal are proteins for which WCN (RSAT) correlates better than
RSAT(WCN) with the site-specific rates of amino acid substitution as estimated using the phylogenetic-based approach ConSurf (CS). The percentages of points above and below the diagonals are shown.
Table 3, andFigure 2clearly show that the mean WCN-seq-uence correlation coefficients are larger than mean RSAT -sequence correlations for all measures of -sequence variability. This is supported by all statistical tests (Table S7). Similar conclusions are reached from analyses based on Spearman correlations (Table S8, Figure S2, and Table S14).
Since CS is the best sequence variability measure, we compared WCN-CS and RSAT-CS correlations protein-by-protein. Results are shown inFigure 3. Counting the number of cases above and below the diagonal, we found that𝜌(CS, WCN) > 𝜌(CS, RSAT) for 171/216 = 79% of cases, and
Table 3 indicates that the proportion is significantly larger than 50% (supported by a binomial test, Table S7). The mean sequence-structure correlations are⟨𝜌(CS, WCN)⟩ = 0.61 and ⟨𝜌(CS, RSA)⟩ = 0.56. Therefore, both the number of cases and the mean values support that WCN correlates better with
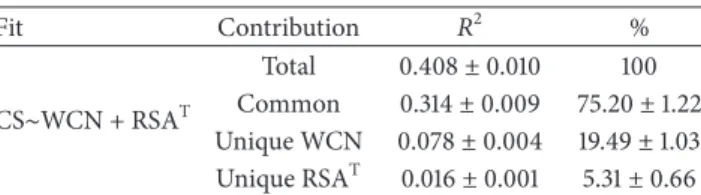
Table 4: Variance partitioning. Fit Contribution 𝑅2 % CS∼WCN + RSAT Total 0.408± 0.010 100 Common 0.314± 0.009 75.20± 1.22 Unique WCN 0.078± 0.004 19.49± 1.03 Unique RSAT 0.016± 0.001 5.31± 0.66
NOTE: fit is the bivariate linear fit considered,𝑅2is the explained variance averaged over the dataset of 216 enzymes± its standard deviation, and % is the proportion of explained variance accounted for by the given contribution.
site-specific evolutionary rates than RSA. This is further sup-ported by analysis based on Spearman correlations (Figure S3, Table S14).
3.2.4. Joint and Unique Contributions of WCN and RSA.
Despite LPD measures being better than SA measures, it is possible that both contribute significantly as determinants of the rate of evolution. Therefore, to finish, we consider the extent to which WCN and RSAT provide overlapping and independent contributions to the explained variance of CS. For this purpose, we performed a variance partitioning analysis based on semipartial correlations (seeSection 2). In a previous study, we used such analysis to compare WCN and RSAM [11]. Here, we showed that the best SA measure is RSAT, so that it is necessary to repeat the analysis. Results are shown inTable 4. The total explained variance is 𝑅2 = 0.408. As a result of the large WCN-RSAT correlations, the
redundancy term is the largest. WCN accounts uniquely for 19.5% of the explained variance, while RSA’s unique contribution is 5.3%. Therefore, the unique contribution of the best LPD measure, WCN, is almost four times larger than the unique contribution of the best SA measure, RSAT. Another way to interpret these results is that going from a one-variable CS ∼WCN linear fit to a two-variable CS ∼ WCN+RSATfit increases the explained variance only by 5.3%
(from𝑅2= 0.392 to 𝑅2= 0.408) at the cost of introducing an extra parameter and possibly overfitting. Similar results are obtained using Spearman correlations (Table S15).
4. Conclusion
Franzosa and Xia studied many structural measures that characterize the microenvironment of protein sites looking for the main structural determinants of evolutionary rate at site level [9]. They found that the only two structural properties with significant independent contributions are RSA, a measure of solvent accessibility, and CN (with a 13 ˚A cut-off radius), a measure of packing density. They concluded that, in agreement with the well-known observation that surface sites evolve more rapidly than buried ones, the main determinant is RSA, with CN having a smaller but significant independent contribution. In contrast, in recent study, Yeh et al. found that site-specific amino acid substitution rates correlate better with two LPD measures, WCN and CN, than with RSA, suggesting that packing density rather than solvent accessibility would be the main structural constraint
[11]. Taking into account the conflicting conclusions of these two studies and considering that there are different ways of scoring sequence variability, packing density, and solvent accessibility, here we performed a more thorough assessment. To this end, we considered five different measures of sequence variability and four measures of solvent accessibility and varied the cut-off radius used to calculate CN. We performed a protein-by-protein comparison of these properties on a representative dataset of 216 structurally and functionally diverse monomeric globular enzymes.
There are several ways to quantify sequence variability. We compared five sequence variability profiles, CS, ET, KBSP, VTSP, and EN, with four solvent accessibility profiles and two local packing density profiles. We found that CS and ET profiles correlate with all structural profiles better than Sum-of-Pairs similarity scores (KBSP and VTSP), which in turn outperform the simple entropy conservation score (EN). The key factor that differentiates CS and ET from the other methods is that they take into account the topology of the phylogenetic tree. Since CS gives slightly better results and, moreover, has a clear evolutionary interpretation—it is the profile of site-specific evolutionary rates—we think that it should be the method of choice, at least for the purpose of investigating the evolutionary sequence-structure relationship.
The main finding of the present work is that LPD measures (WCN and CN) clearly outperform all of the SA measures (ASA, RSAR, RSAM, and RSAT) for all five of the sequence variability measures. Moreover, WCN is the best LPD measure and RSAT the best SA measure. A variance partitioning analysis based on a bivariate fit of evol-utionary rate (CS) as a function of both variables shows that WCN has an independent contribution four times larger than RSA. Therefore, the present assessment provides very strong support for the conclusion of Yeh et al. that the main structural determinant of sequence variability is packing density rather than solvent accessibility [11].
From a fundamental point of view, LPD and RSA suggest different mechanisms for the link between structural con-straints and sequence variability. RSA is related to overall protein stability, which would suggest a connection between the effect of a mutation and global stability. On the other hand, LPD is related to the interaction energy of a protein site with its local environment [41]. We have recently developed a mechanistic model of evolution that shows that LPD is directly proportional to the mutational stress introduced by a mutation on the protein’s active structure. This model pro-vides an explanation for the sequence-LPD link and predicts a linear relationship [14]. Therefore, the findings of the present thorough analysis further support such mechanistic model, which may provide a breakthrough in our understanding of the biophysical mechanism by which protein structure constrains sequence divergence.
In addition to fundamental issues, the present conclu-sions could be applied to the development of better structure-based models of sequence evolution. For example, Scherrer et al. have developed sequence evolution models that take into account the site-specific RSA values [42]. The present
work suggests the development of similar models based on WCN. It would be interesting to see whether WCN-based evolutionary models outperform RSA-WCN-based ones. A secondary issue to note in this respect is that, in contrast with RSA, WCN is easier to calculate, since it depends just on the alpha-carbon coordinates, in contrast with RSA, which considers all of the protein’s atoms. However, a very recent study shows that it might be possible to obtain RSA measures from coarse-grained representations, which would tackle this computational-cost problem [43].
The fact that using a weighted contact number, WCN, improves over the simpler CN measure of local packing density immediately suggests that other weighting schemes may further improve the structure-sequence correlations. WCN uses1/𝑑2𝑖𝑗weights. The first obvious generalization is to use other powers,1/𝑑𝑛𝑖𝑗; we have tried this and it turns out that𝑛 = 2 results in the best sequence-structure correlations (unpublished results). Another choice would be to use decay-ing exponential weights, 𝑒−𝑎𝑑𝑖𝑗; this does not improve the sequence-structure agreement either (unpublished results). A third possibility would be to use statistical potentials as weights. We used them in the past in a structure-based model of evolution that predicts successfully the site-specific patterns of amino acid replacement but fails to account for the evolutionary rate variation among sites [44–46]. The reason why an inverse squared distance weighting of contacts leads to the LPD measure that best correlates with site-specific rate of evolution is not clear yet and requires further research. Another issue, suggested by one of the reviewers, is the inclusion of correlations of pairs or higher groups of atoms; we think this is a good idea that might deserve further investigation. To finish this paragraph, we mention that a strategy that does significantly improve over WCN as calculated here is to use a two-nodes-per-site representation including for each site its𝐶𝛼and a second node representing the side chain located either at the𝐶𝛽 or at the center-of-mass of the side chain and calculating WCN for the node representing the side chain rather than𝐶𝛼. This makes sense, since it is the side chain and not the backbone atom which is mutated. Another approach which leads to similar results is to use an anisotropic weighting function that takes into account not only the distance between the reference site and its neighbors but also its relative orientation with respect to a unit vector directed from the site’s 𝐶𝛼 to its 𝐶𝛽 or side-chain center of mass. These results go beyond the scope of the present work and will be published elsewhere.
To finish, we discuss the scope of the present conclusions. We have used only monomeric enzymes. The set is repre-sentative of the whole set of monomeric enzymes of known structures, since, starting from this set, we picked them randomly with the only condition of filtering out enzymes with more than 25% sequence identity to avoid redundan-cies. Above that sequence-identity threshold, proteins are expected to have essentially the same structures, so that there would be no further gain in including them. The protocol used to build this set guarantees that it is representative of the whole set of monomeric enzymes, in the sense of including the different functional and structural classes in the same
proportion as in the whole set. This, together with the fact that the uncertainty of a statistical analysis depends on the size of the sample but has no relationship to the size of the population from which the sample was drawn, means that the present conclusions are expected to hold for monomeric enzymes in general and probably for globular monomeric proteins that are not enzymes but have a similar organization, for example, myoglobin, which is monomeric and globular and has an active site. Using monomeric globular proteins, we avoided constraints due to interaction between subunits in multimeric proteins. For the latter, coupling between sub-units may affect the correlation between LPD and sequence variability [47]. Thus, an extension of the present study to multimeric proteins might be useful to gain insight into the coevolution between protein subunits. Further research would also be needed for monomeric proteins whose func-tion is related to protein-protein or protein-nucleic acid interactions, which may impose additional constraints.
Conflict of Interests
The authors declare that there is no conflict of interests regarding the publication of this paper.
Authors’ Contribution
So-Wei Yeh and Tsun-Tsao Huang contributed equally to this paper.
Acknowledgments
The authors acknowledge the useful and creative suggestions by one of the reviewers. This research was supported in part by the Academic Summit Program of National Science Council with Grant no. NSC-102-2745-B-009-001 and the “Center for Bioinformatics Research of Aiming for the Top University Program” of the National Chiao Tung University and Ministry of Education, Taiwan. Julian Echave is a researcher of CONICET.
References
[1] C. P´al, B. Papp, and M. J. Lercher, “An integrated view of protein evolution,” Nature Reviews Genetics, vol. 7, no. 5, pp. 337–348, 2006.
[2] J. L. Thorne, “Protein evolution constraints and model-based techniques to study them,” Current Opinion in Structural
Biol-ogy, vol. 17, no. 3, pp. 337–341, 2007.
[3] C. L. Worth, S. Gong, and T. L. Blundell, “Structural and functional constraints in the evolution of protein families,”
Nature Reviews Molecular Cell Biology, vol. 10, no. 10, pp. 709–
720, 2009.
[4] C. O. Wilke and D. A. Drummond, “Signatures of protein biophysics in coding sequence evolution,” Current Opinion in
Structural Biology, vol. 20, no. 3, pp. 385–389, 2010.
[5] J. A. Grahnen, P. Nandakumar, J. Kubelka, and D. A. Liberles, “Biophysical and structural considerations for protein sequence evolution,” BMC Evolutionary Biology, vol. 11, no. 1, article 361, 2011.
[6] D. A. Liberles, S. A. Teichmann, I. Bahar et al., “The interface of protein structure, protein biophysics, and molecular evolution,”
Protein Science, vol. 21, no. 6, pp. 769–785, 2012.
[7] C. D. Bustamante, J. P. Townsend, and D. L. Hartl, “Sol-vent accessibility and purifying selection within proteins of
Escherichia coli and Salmonella enterica,” Molecular Biology and Evolution, vol. 17, no. 2, pp. 301–308, 2000.
[8] A. M. Dean, C. Neuhauser, E. Grenier, and G. B. Golding, “The pattern of amino acid replacements in𝛼/𝛽-barrels,” Molecular
Biology and Evolution, vol. 19, no. 11, pp. 1846–1864, 2002.
[9] E. A. Franzosa and Y. Xia, “Structural determinants of protein evolution are context-sensitive at the residue level,” Molecular
Biology and Evolution, vol. 26, no. 10, pp. 2387–2395, 2009.
[10] D. C. Ramsey, M. P. Scherrer, T. Zhou, and C. O. Wilke, “The relationship between relative solvent accessibility and evolutionary rate in protein evolution,” Genetics, vol. 188, no. 2, pp. 479–488, 2011.
[11] S.-W. Yeh, J.-W. Liu, S.-H. Yu, C.-H. Shih, J.-K. Hwang, and J. Echave, “Site-specific structural constraints on protein sequence evolutionary divergence: local packing density vs. solvent exposure,” Molecular Biology and Evolution, vol. 31, no. 1, pp. 135–139, 2014.
[12] H. Liao, W. Yeh, D. Chiang, R. L. Jernigan, and B. Lustig, “Protein sequence entropy is closely related to packing density and hydrophobicity,” Protein Engineering, Design and Selection, vol. 18, no. 2, pp. 59–64, 2005.
[13] C. Shih, C. Chang, Y. Lin, W. Lo, and J. Hwang, “Evolutionary information hidden in a single protein structure,” Proteins:
Structure, Function and Bioinformatics, vol. 80, no. 6, pp. 1647–
1657, 2012.
[14] T. T. Huang, M. L. del Valle Marcos, J. K. Hwang, and J. Echave, “A mechanistic stress model of protein evolution accounts for site-specific evolutionary rates and their relationship with packing density and flexibility,” BMC Evolutionary Biology, vol. 14, article 78, 2014.
[15] J. Pei and N. V. Grishin, “AL2CO: calculation of positional conservation in a protein sequence alignment,” Bioinformatics, vol. 17, no. 8, pp. 700–712, 2001.
[16] W. S. J. Valdar, “Scoring residue conservation,” Proteins:
Struc-ture, Function and Genetics, vol. 48, no. 2, pp. 227–241, 2002.
[17] F. Johansson and H. Toh, “A comparative study of conservation and variation scores,” BMC Bioinformatics, vol. 11, article 388, 2010.
[18] M. Z. Tien, A. G. Meyer, D. K. Sydykova, S. J. Spielman, and C. O. Wilke, “Maximum allowed solvent accessibilites of residues in proteins,” PloS ONE, vol. 8, no. 11, Article ID e80635, 2013. [19] International Union of Biochemistry and Molecular Biology,
Nomenclature Committee, and Edwin Clifford Webb, Enzyme
Nomenclature 1992: Recommendations of the Nomenclature Committee of the International Union of Biochemistry and Molecular Biology on the Nomenclature and Classification of Enzymes, International Union of Biochemistry and Molecular
Biology by Academic Press, 1992.
[20] A. G. Murzin, S. E. Brenner, T. Hubbard, and C. Chothia, “SCOP: a structural classification of proteins database for the investigation of sequences and structures,” Journal of Molecular
Biology, vol. 247, no. 4, pp. 536–540, 1995.
[21] O. Goldenberg, E. Erez, G. Nimrod, and N. Ben-Tal, “The ConSurf-DB: pre-calculated evolutionary conservation profiles of protein structures,” Nucleic Acids Research, vol. 37, no. 1, pp. D323–D327, 2009.
[22] H. Ashkenazy, E. Erez, E. Martz, T. Pupko, and N. Ben-Tal, “ConSurf 2010: calculating evolutionary conservation in sequence and structure of proteins and nucleic acids,” Nucleic
Acids Research, vol. 38, no. 2, pp. W529–W533, 2010.
[23] S. F. Altschul, T. L. Madden, A. A. Sch¨affer et al., “Gapped BLAST and PSI-BLAST: a new generation of protein database search programs,” Nucleic Acids Research, vol. 25, no. 17, pp. 3389–3402, 1997.
[24] UniProt Consortium, “The universal protein resource (UniProt),” Nucleic Acids Research, vol. 35, pp. D193–D197, 2007.
[25] W. Li and A. Godzik, “Cd-hit: a fast program for clustering and comparing large sets of protein or nucleotide sequences,”
Bioinformatics, vol. 22, no. 13, pp. 1658–1659, 2006.
[26] R. C. Edgar, “MUSCLE: multiple sequence alignment with high accuracy and high throughput,” Nucleic Acids Research, vol. 32, no. 5, pp. 1792–1797, 2004.
[27] T. Pupko, R. E. Bell, I. Mayrose, F. Glaser, and N. Ben-Tal, “Rate4Site: an algorithmic tool for the identification of func-tional regions in proteins by surface mapping of evolutionary determinants within their homologues,” Bioinformatics, vol. 18, supplement 1, pp. S71–S77, 2002.
[28] I. Mayrose, D. Graur, N. Ben-Tal, and T. Pupko, “Comparison of site-specific rate-inference methods for protein sequences: empirical Bayesian methods are superior,” Molecular Biology
and Evolution, vol. 21, no. 9, pp. 1781–1791, 2004.
[29] I. Mihalek, I. Reˇs, and O. Lichtarge, “A family of evolution-entropy hybrid methods for ranking protein residues by impor-tance,” Journal of Molecular Biology, vol. 336, no. 5, pp. 1265– 1282, 2004.
[30] M. S. Waterman, Introduction to Computational Biology, Chap-man & Hall, London, UK, 1995.
[31] S. Karlin and L. Brocchieri, “Evolutionary conservation of RecA genes in relation to protein structure and function,” Journal of
Bacteriology, vol. 178, no. 7, pp. 1881–1894, 1996.
[32] W. S. Valdar and J. M. Thornton, “Protein-protein interfaces: analysis of amino acid conservation in homodimers,” Proteins, vol. 42, no. 1, pp. 108–124, 2001.
[33] C. Sander and R. Schneider, “Database of homology-derived protein structures and the structural meaning of sequence alignment,” Proteins: Structure, Function and Genetics, vol. 9, no. 1, pp. 56–68, 1991.
[34] H. M. Berman, J. Westbrook, Z. Feng et al., “The protein data bank,” Nucleic Acids Research, vol. 28, no. 1, pp. 235–242, 2000. [35] C. Lin, S. Huang, Y. Lai et al., “Deriving protein dynamical properties from weighted protein contact number,” Proteins:
Structure, Function and Genetics, vol. 72, no. 3, pp. 929–935,
2008.
[36] W. Kabsch and C. Sander, “Dictionary of protein secondary structure: pattern recognition of hydrogen-bonded and geo-metrical features,” Biopolymers—Peptide Science Section, vol. 22, no. 12, pp. 2577–2637, 1983.
[37] G. D. Rose, A. R. Geselowitz, G. J. Lesser, R. H. Lee, and M. H. Zehfus, “Hydrophobicity of amino acid residues in globular proteins,” Science, vol. 229, no. 4716, pp. 834–838, 1985. [38] S. Miller, J. Janin, A. M. Lesk, and C. Chothia, “Interior and
surface of monomeric proteins,” Journal of Molecular Biology, vol. 196, no. 3, pp. 641–656, 1987.
[39] J. Cohen, Applied Multiple Regression/Correlation Analysis for
the Behavioral Sciences, L. Erlbaum Associates, Mahwah, NJ,
[40] R. M. Warner, Applied Statistics: From Bivariate Through
Mul-tivariate Techniques, SAGE, Thousand Oaks, Calif, USA, 2nd
edition, 2013.
[41] B. Halle, “Flexibility and packing in proteins,” Proceedings of the
National Academy of Sciences of the United States of America,
vol. 99, no. 3, pp. 1274–1279, 2002.
[42] M. P. Scherrer, A. G. Meyer, and C. O. Wilke, “Modeling coding-sequence evolution within the context of residue solvent accessibility,” BMC Evolutionary Biology, vol. 12, no. 1, article 179, 2012.
[43] D. Flatow, S. P. Leelananda, A. Skliros, A. Kloczkowski, and R. L. Jernigan, “Volumes and surface areas: geometries and scaling relationships between coarse- grained and atomic structures,”
Current Pharmaceutical Design, vol. 20, no. 8, pp. 1208–1222,
2014.
[44] G. Parisi and J. Echave, “Structural constraints and emergence of sequence patterns in protein evolution,” Molecular Biology and
Evolution, vol. 18, no. 5, pp. 750–756, 2001.
[45] M. S. Fornasari, G. Parisi, and J. Echave, “Site-specific amino acid replacement matrices from structurally constrained pro-tein evolution simulations,” Molecular Biology and Evolution, vol. 19, no. 3, pp. 352–356, 2002.
[46] G. Parisi and J. Echave, “Generality of the structurally con-strained protein evolution model: assessment on representatives of the four main fold classes,” Gene, vol. 345, no. 1, pp. 45–53, 2005.
[47] C. M. Chang, Y. W. Huang, C. H. Shih, and J. K. Hwang, “On the relationship between the sequence conservation and the packing density profiles of the protein complexes,” Proteins:
Structure, Function and Bioinformatics, vol. 81, no. 7, pp. 1192–
Submit your manuscripts at
http://www.hindawi.com
Hindawi Publishing Corporation
http://www.hindawi.com Volume 2014
Anatomy
Research International
Peptides
Hindawi Publishing Corporation
http://www.hindawi.com Volume 2014
Hindawi Publishing Corporation http://www.hindawi.com
International Journal of
Volume 2014
Zoology
Hindawi Publishing Corporation
http://www.hindawi.com Volume 2014 Molecular Biology International
Hindawi Publishing Corporation
http://www.hindawi.com Volume 2014
The Scientific
World Journal
Hindawi Publishing Corporationhttp://www.hindawi.com Volume 2014
Hindawi Publishing Corporation
http://www.hindawi.com Volume 2014
Bioinformatics
Advances inMarine Biology
Journal ofHindawi Publishing Corporation
http://www.hindawi.com Volume 2014
Hindawi Publishing Corporation
http://www.hindawi.com Volume 2014
Signal Transduction
Journal ofHindawi Publishing Corporation
http://www.hindawi.com Volume 2014
BioMed
Research International
Evolutionary Biology
International Journal of
Hindawi Publishing Corporation
http://www.hindawi.com Volume 2014
Hindawi Publishing Corporation
http://www.hindawi.com Volume 2014 Biochemistry Research International
Archaea
Hindawi Publishing Corporation
http://www.hindawi.com Volume 2014
Hindawi Publishing Corporation
http://www.hindawi.com Volume 2014
Genetics
Research International
Hindawi Publishing Corporation
http://www.hindawi.com Volume 2014 Advances in
Virology
Hindawi Publishing Corporation http://www.hindawi.com
Nucleic Acids
Journal ofVolume 2014
Stem Cells
International
Hindawi Publishing Corporation
http://www.hindawi.com Volume 2014
Hindawi Publishing Corporation
http://www.hindawi.com Volume 2014
Enzyme
Research
Hindawi Publishing Corporation
http://www.hindawi.com Volume 2014
International Journal of