國
立
交
通
大
學
生醫工程研究所
碩
士
論
文
基於蛋白質自由能之預測 B 細胞表位方法
Prediction of continuous B-cell epitopes using protein free energy
associated with mutation-induced conformational changes
研 究 生:黃韻潔
指導教授:胡毓志 博士
ii
基於蛋白質自由能之預測 B 細胞表位方法
Prediction of continuous B-cell epitopes using protein free energy
associated with mutation-induced conformational changes
研 究 生:黃韻潔
Student:Queena Hwang
指導教授:胡毓志
Advisor:Yuh-Jyh Hu
國 立 交 通 大 學
生 醫 工 程 研 究 所
碩 士 論 文
A ThesisSubmitted to Institute of Biomedical Engineering College of Computer Science
National Chiao Tung University in partial Fulfillment of the Requirements
for the Degree of Master
in
Computer Science June 2012
Hsinchu, Taiwan, Republic of China
iii
基於蛋白質自由能之預測 B 細胞表位方法
學生:黃韻潔
指導教授:胡毓志 博士
國立交通大學 生醫工程研究所
摘要
在預防醫學中,抗體可藉由疫苗刺激免疫系統產生,進而提升人體免疫力。 胜肽疫苗,其抗原僅採用可誘發抗體之B細胞表位(B-cell epitope)胜肽片段刺 激免疫系統就可以產生具特異性及保護性的免疫能力,因此有效的預測B細胞表 位在預防醫學中扮演相當重要的角色。目前預測B細胞表位方法多數依賴由蛋白 質結構所衍生出之胺基酸量表(amino acid propensity scales﹞。這類型的方法利 用單一胺基酸序列做為預測B細胞表位之依據。然而大環境中病原不斷的演化, 演化過程中病原的生物基因快速突變,基因突變也造成胺基酸序列發生改變。因 此在病原快速演化的環境下,根據單一胺基酸序列所預測之B細胞表位做為疫苗 的抗原並不一定適用。 在本研究中,我試著考慮一系列突變過後之胺基酸序列,並利用這一系列胺 基酸序列所對應的蛋白質自由能設計出三種與自由能相關的特徵。利用這三種特 徵配合 k-NN、 SVM 以及 ANN 這三種分類演算法,對於預測B細胞表位的預 測分別可達到74.3%、66.1%及80.0%的準確性,與目前的B細胞表位預測方法 ─ ─ ABCPred、BCPred 和 AAP ── 相較,本研究所提出的方法可達到較好的 預測效果。 關鍵字:B細胞表位、預測、突變、蛋白質自由能iv
Prediction of continuous B-cell epitopes using protein free energy
associated with mutation-induced conformational changes.
Student: Queena Hwang Advisor: Dr. Yuh-Jyh Hu
Department of Computer Science National Chiao Tung University
ABSTRACT
Identification of B-cell epitopes plays an important role in vaccine development. Current prediction algorithms mostly rely on amino acid propensity scales and their variants, the results of which depend on a single antigenic phenotype. That viral sequences undergo continuous genetic changes, promoting the emergence of drug resistant strains, renders current prediction methods impractical. In this study, a novel set of features are proposed based on the protein free energy associated with point-mutated structures. To the best of our knowledge, this is the first attempt in this area to predict continuous B-cell epitopes based on protein free energy. I evaluated the novel features on k-nearest neighbor, support vector machine, and artificial neural network models, and achieved prediction accuracy of 74.3%, 66.1%, and 80.0% respectively. In comparison to current predictors, namely ABCPred, BCPred, and AAP, the energy-based models demonstrated better performance.
v
TABLE OF CONTENTS
摘 要 ... i
ABSTRACT ... iii
TABLE OF CONTENTS ... v
LIST OF FIGURES ... vii
LIST OF TABLES ... viii
Chapter 1 Literature review ... 1
1.1 Protein epitope ... 1
1.2 Experimental methods for B-cell epitope identification ... 2
1.3 Computational approaches for continuous B-cell epitope prediction ... 3
1.4 Machine learning algorithms ... 4
1.4.1 Decision tree ... 5
1.4.2 k-nearest neighbor (k-NN) ... 5
1.4.3 Support vector machine (SVM) ... 5
1.4.4 Artificial neural network (ANN) ... 6
1.5 Machine learning approaches for the prediction of continuous B-cell epitopes 8 1.5.1 Prediction method based on ANN ... 8
1.4.2 Prediction method based on decision tree and k-NN ... 8
1.4.3 Prediction method based on SVM ... 9
1.6 Protein energy ... 11
STATEMENT OF THE PROBLEM ... 14
Chapter 2 Manuscript ... 15 2.1 Introduction ... 15 2.2 Methods ... 17 2.3 Results ... 28 2.4 Discussion ... 37 2.5 Conclusion ... 40 2.6 Supplementary material ... 41
vi
REFERENCE ... 44
vii
LIST OF FIGURES
Figure 2-1: System control flow for energy-related features... 19 Figure 2-2a: 1D FEdiff feature based on a neighborhood of 10 amino acids on both sides ... 23 Figure 2-2b: 3D FEdiff feature defined by a central sphere with radius r1 and a shell with radius r2
... 23
viii
LIST OF TABLES
Table 2-1a: Parameters used to define 1D energy-related features ... 24
Table 2-1b: Radii used to define 3D energy-related features ... 24
Table 2-2: Features used in published continuous B-cell epitope prediction methods ... 26
Table 2-3: Performance of k-NN, SVM, and ANN trained with the energy-related features ... 29
Table 2-4: Performance of k-NN, SVM, and ANN trained and tested with different subsets of energy-related features ... 30
Table 2-5: Performance of k-NN, SVM, and ANN trained with 1D or 3D FEbest features ... 31
Table 2-6: Performance of k-NN, SVM, and ANN trained with previously used features or the novel energy-related features ... 32
Table 2-7: Performance of k-NN, SVM, and ANN trained with 3D FEbest features, and performance of current epitope prediction servers ABCPred, BCPred, and AAP method ... 34
Table 2-8: Performance of current servers, and k-NN, SVM, and ANN trained with 3D FEbest features on a data set retrieved from the AntiJen database ... 36
Table 2-9a: Performance of k-NN, SVM, and ANN classifiers trained with 3D FEbest features from which the specified 3D FEss features has been removed ... 41
Table 2-9b: Performance of k-NN, SVM, and ANN classifiers trained with 3D FEbest features, from which the specified 3D FEdiff features has been removed ... 42
1. Literature Review
1.1 Protein epitope
A profound understanding of the interaction between antibodies and epitopes provides basis for the rational design of preventive vaccines. Neutralizing antibodies are produced as a consequence of vaccination. The ability of antibodies to respond to an antigen, such as a virus capsid protein fragment, is dependent on the antibodies’ specific recognition of epitopes, which are sites of the antigen to which antibodies bind. Therefore, generation of potent antibodies through reversed immunological approach requires precise knowledge of the epitope. B cell epitopes are distinguished from T-cell epitopes as they are able to bind antibodies either in soluble form or as membrane-bound B-cell receptors, whereas T-cell epitopes are proteolytically cleaved peptides of the antigen that interact with the receptors of T cells. X-Ray crystallography studies of antigen-antibody interactions show that B-cell epitopes nestle in a cleft formed by the binding sites of the antibody. Thus, a B-cell epitope matches antibody much as a key matches a lock. When the antigen and antibody interlock, the antibody not only prevents antigens from entering or damaging the cells, but they also trigger destruction of antigens by stimulating other immune responses such as the complement pathway.
Based on structure and interaction with the antibody, epitopes can be divided into two categories, conformational epitopes and continuous epitopes. A continuous epitope is formed by a continuous sequence of amino acids, whereas a conformational epitope is composed of discontinuous sections of the antigen’s primary sequence. The discontinuous sections are close together in three-dimensional space, and interact with the antibody. However, the distinction between continuous and conformational epitopes is not clear-cut since conformational epitopes often contain short segments of a few continuous residues that are able to bind to antibodies
- 2 -
raised against the protein, and the continuous residues could be given the status of continuous epitopes. Despite the lack of clear distinction between continuous and conformational B-cell epitopes, the rationale behind identification of antigenic regions is to facilitate the synthesis of peptides corresponding to segments in proteins that may stimulate the production of anti-peptide antibodies, and in turn cross-react with the native protein antigen.
1.2 Experimental methods for B-cell epitope identification
A number of methods are available for mapping epitopes on target proteins. The gold standard approach is X-ray co-crystallography, in which the specific arrangement of atoms within crystals is determined by striking the crystal with a beam of X-rays. The beam of light diffracts into many specific directions. Based on the angles and intensities of the diffraction, the three-dimensional picture of electron densities within the crystal, and consequently the mean positions of atoms in the crystal, can be determined. While X-ray crystallography allows direct visualization of the interaction between antigen and antibody, this approach requires purified crystals of high regularity to solve the molecular arrangement of atoms. Impurities or conformational flexibility in the molecules inhibit crystallization. Furthermore, it is difficult to determine good conditions for obtaining diffraction-quality crystal, which is the chief barrier in solving atomic-resolution structure.
In a pepscan analysis, overlapping peptides designed and synthesized based upon a known amino acid sequence of the target antigen are tested for their ability to bind the antibody of interest [1]. The peptides are biotinylated and used in an ELISA [2] to screen immune sera from infected individuals. Specifically, the biotinylated peptides were coated directly onto micro titre plates. A continuous B-cell epitope is identified by a universal recognition of sera to the synthetic peptides which corresponds to a particular fragment of the antigen protein. This method is
- 3 -
relatively fast and inexpensive to identify the continuous antigenic determinants defined by a particular serum or monoclonal antibody. However, linear peptides often have as a drawback their inherent low stabilities, short half-lives, or high costs of manufacturing (compared to small molecules).
Mutagenesis can provide detailed information on functional amino acid residues within an epitope fragment. Using this approach, systematic mutations of amino acids are introduced into an antigenic sequence, and subsequently its ability to bind the antibody of interest is measured in order to identify amino acids that comprise an epitope. Similarly, a cloning technique has been developed that introduce mutations to a library of clones. The technique uses a comprehensive mutation library, with each clone containing a unique amino acid mutation and the library covers every amino acid in the target protein. However, both mutagenesis approaches are labor-intensive and slow, thereby limiting analysis to small molecules or a small number of amino acid residues. The high cost and effort involved makes tradition approaches impractical for application on a genomic scale. Therefore, computational techniques have been introduced to offer a fast, scalable, and cost-effective approach for predicting B-cell epitopes. There is an on-going development of computational tools for reliable prediction of B-cell epitopes.
1.3 Computational approaches for continuous B-cell epitope prediction
In 1981, Hopp and Woods were the first to propose the idea of using amino acid sequence to search for immunogenic regions in a protein [3]. Their method was based on the observation that epitopes are located in regions that are highly hydrophilic. Thus, a scale was constructed, and values, which characterize hydrophilicity, were assigned to each residue within a sequence. The values were successively averaged within a sliding window, thus generating a numerical
- 4 -
sequence. Based on protein sequences with known epitopes, the authors were able to show that the maximum values found within a sequence correlated with known epitope regions.
Following Hopp and Woods’ finding, the application of alternative physicochemical properties in continuous epitope prediction has been evaluated. The physicochemical properties that were evaluated included hydrophobicity [4], solvent accessibility [5], secondary structure [6], antigenicity [7], and flexibility [8]. However, in 2005, Blythe and Flower analyzed a total of 484 amino acid scales, and reported that predictions based on the best scales still produced poor correlation with experimentally confirmed epitopes [9, 10].
1.4 Machine learning algorithms
That amino acid scales could not be directly used for continuous epitope prediction prompted the use of machine learning approaches to improve the accuracy of prediction. Machine learning is a branch of artificial intelligence that is concerned with the design and development of algorithms to learn from existing data, and to perform accurately on new and unseen data. The reason that machine learning has become increasingly necessary in dealing with biological data is due to the availability of huge amounts of data, and the need for turning such data into useful information. Machine learning algorithms have the potential to uncover important data patterns or valuable knowledge embedded in the vast amount of data. The way that machine learning algorithms identify B-cell epitopes is by inferring a function from the training data that maps inputs to desired outputs. The inferred function, obtained after training on the finite dataset, can be applied to predict output values for new and unseen examples. As the training examples come from a certain probability distribution, the objective of the algorithm is to extract information about the
distribution, which allows the algorithm to predict output values in a new dataset. Among the
- 5 -
machines (SVM), and artificial neural networks (ANN) have been applied to the prediction of continuous B-cell epitopes.
1.4.1 Decision tree
Decision tree learning classifies an example using a tree-like structure, in which each interior node corresponds to a test on an attribute, and each branch represents an outcome of the test. Classification starts at the root node at the top of the tree, goes through a path determined by the values of input variables, and end up at a particular leaf node representing class of the test. There are several decision tree algorithms. Among them, the C4.5 algorithm builds decision trees from a training data set based on information entropy. At each node of the tree, C4.5 chooses the attribute with the highest information gain for splitting data into subsets. The chosen attribute splits the class attributes into the two purest possible groups of instances with lowest entropy. The process is performed recursively, where the attribute with the next highest information gain is chosen to make the next decision.
1.4.2 k-Nearest Neighbor (k-NN)
The k-NN algorithm belongs to the instance-based family of algorithms, which compares new and unseen examples with training examples. k-NN is sensitive to the local structure of the data, and it classifies new examples based on proximal training examples in the feature space. A new example is assigned class most common amongst its k nearest neighbors. If k=1, for instance, then the example is simply assigned to the class of its nearest neighbor. Commonly, Euclidean distance is used as the distance metric.
- 6 -
SVM also performs classification in a feature space, where training examples are represented as points in space, mapped such that the examples belonging to different classes can be separated by a hyperplane or a set of hyperplanes. New examples are mapped into the sample space and assigned a predicted class based on which side of the hyperplane that they fall on. However, it is possible that linear hyperplanes are unable to separate data points of different classes. In such case, the original finite-dimensional space may be mapped into a higher-dimensional space in hope that in this higher-dimensional space the data could become more easily separated. The mapping is computed using a kernel function that is selected to suit the problem. The choice of kernel depends on the problem and the kind of information one expects to extract from the data. A polynomial kernel, for example, is suited for problems where all the training data is normalized. The radial basis function (RBF) models spherical hyperplanes in a multi-dimensional space. The effectiveness of SVM depends on the selection of kernel and the kernel’s parameters.
1.4.4 Artificial Neural Network (ANN)
ANN is a computational model inspired by the structure and operations of the biological neural networks. In the case of a biological neural network, neurons are connected to form a network, where each neuron collects input stimuli and sends an output signal to the next neuron within the network. In an ANN, artificial neurons, also referred to as nodes, are connected to form a network of nodes to simulate the neurological processing ability of a biological neural system, such as learning and determining a conclusion from experience. A simple ANN is composed of three layers of neurons – the input layer, hidden layer, and output layer. The input layer collects and sends data to the hidden layer via synapses. Each neuron in the hidden layer sums its input from the previous layer, and converts it to output activation. Subsequently, the data is passed to the output layer via more synapses, where the results are presented to users. The synapses
- 7 -
between neurons represent weights, which manipulate data in calculations. Depending on the interconnections between neurons, an ANN can be characterized by two classes. The first is a feed forward neural network (FNN), in which neurons in one layer are connected to those in the next layer, thus FNN does not involve any feedback. In the second type of network, the output of each neuron is fed back to itself, as well as other neurons, thus referred to as recurrent networks. In the supervised training process of an ANN, the network is initialized by putting small random weights on the synapses. The resultant output is compared with the observed data, and weights are adjusted by the network to minimize errors compared to the actual output. The learning method most frequently used is back propagation, where a gradient of error is calculated based on the network’s modifiable weights, and the gradient is used to find weights that minimize the error. When the model and learning algorithm are selected appropriately, ANN is powerful in its ability to manage adaptive, parallel, and non-linear processes. Its adaptive nature is demonstrated through adaptation of internal parameters, which in turn enables ANN to determine the relationship between different examples. In the parallel structure of ANN, the information processing occurs through a great number of computational neurons, each of which sends exciting or inhibiting signals to the other neurons in the network. Since the calculations are distributed among many neurons, if any of the neurons deviates from the expected behavior, it does not affect the behavior of the network. Beyond that, neurons in ANN can be linear or non-linear. An ANN formed by the interconnection of non-linear neurons, is itself non-linear, and it is able to process and present a non-linear behavior, which is presented in most of real situations. Taken together, the flexibility of ANN allows the network to provide solution to complex problems.
- 8 -
1.5 Machine learning approaches for the prediction of continuous B-cell epitopes 1.5.1 Prediction method based on ANN
A number of continuous B-cell epitope prediction methods based on machine learning approaches have been developed. ABCPred uses artificial neural networks for predicting continuous B-cell epitopes [11]. The method was trained and tested on epitopes derived from the Bcipep database [12], and reference peptides from the Swiss-Prot database. One of the constraints associated with machine learning techniques is that peptides needs to be adjusted to a fixed length, however, the length of B-cell epitopes vary from 5 to 30 amino acids. The authors tested a number of fixed lengths (10, 12, 14, 16, 18, 20 amino acids). In case where the peptide length was smaller than the specified length, the peptide was extended by adding amino acids on both sides, based on the corresponding complete antigen sequences. Alternatively, if the peptide was longer than the specified length, an equal number of amino acids were removed from both sides of the peptide. The dataset was divided into five-fold, where three parts were used for training, one for minimizing the error during learning, and one for testing. The best accuracy, 66% accuracy, was obtained using a recurrent neural network with 35 neurons in the hidden layer, and trained with window length of 16 amino acids. It was suggested that this method demonstrated improved accuracy, sensitivity, and specificity compared with the scale-based methods.
1.5.2 Prediction method based on C4.5 and k-NN
In the method by Sollner and Mayer, amino acid scales, neighborhood matrices, and respective probability and likelihood values, were combined, then included in decision tree and nearest neighbor approaches to derive a classification algorithm [13]. The dataset used for training was derived from the public domain sources (Bcipep and FIMM [14] databases), and a proprietary dataset of experimentally determined epitopes. For each peptide in the epitope dataset, a
- 9 -
non-epitope peptide of the same length was selected randomly. The mean epitope length of peptides was found to be 13 amino acids, with a minimum of 6, and a maximum of 20 amino acids. The peptides were transformed into a parameter space. The parameters considered were grouped into three classes – amino acid propensity scales, sequence complexities, and neighborhood word probabilities. Based on the distribution of each parameter for the epitope and non-epitope datasets, a feature was selected if the parameter exhibited correct class assignment of at least 60%. Subsequently, the selected parameters were used as input for C4.5 decision tree and k-NN. The best performance, 72% accuracy, was attained using the nearest neighbor approach. While this approach demonstrated an improved accuracy over previous methods, the method used for representing peptides as input to the classifiers is not publicly available.
1.5.3 Prediction method based on SVM
In 2007, Chen et al. tried to improve prediction quality using a novel scale called the amino acid pair (AAP) antigenicity scale [15]. The author used epitopes derived from the Bcipep database and non-epitopes derived from the Swiss-Prot. The peptides were adjusted to different window sizes. Initial analysis of AAPs demonstrated that the frequencies of some pairs differed significantly in the epitope and non-epitope datasets. Therefore, the average of all the AAPs in a peptide, as well as hydrophilicity, accessibility, flexibility, and antigenicity, were projected as a vector into feature space. A SVM classifier was used to assign an example to one of the classes {-1, +1}. The SVM, using a radial symmetric function as kernel, produced a prediction accuracy of 71%.
BCPred is also based on a SVM, combined with a variety of kernel methods, namely string kernels, and the widely used radial bias function kernel, for continuous B-cell epitope prediction
- 10 -
[16]. The string kernels [17-20] are a class of kernel methods that have been used in a variety of text classification tasks [19-24]. Among them, the authors selected four string kernels in building the SVM, including the spectrum kernel, mismatch kernel, local alignment kernel, and subsequence kernel. The spectrum kernel maps an input example to feature space based on the
function , where is the number of occurrences of the k-length
subsequence α in the peptide x, defined on the alphabet A (e.g. 20 amino acids). The kernel captures the degree of similarity between two peptides by determining the number of common subsequences in them. The subsequence kernel and mismatch kernel are both alternations to the spectrum kernel. The subsequence kernel considers a feature space generated by all contiguous and non-contiguous subsequences, where gaps are penalized in non-contiguous subsequences. The mismatch kernel considers inexact matching in the comparison of substrings. The local alignment kernel is a string kernel specific for biological sequences [21], and it determines the level of similarity between two peptides by summing up scores obtained from gapped local alignments between the peptides. The authors used peptides of 20 amino acids long derived from the Bcipep database, and found that the maximum prediction accuracy, 74.57%, was obtained using a SVM trained with the subsequence kernel.
BEOracle [25] is a SVM that combines evolutionary information with various structural properties to predict B-cell epitopes. In total, the authors evaluated evolutionary conservation information, compositional and per residues probabilities for secondary structure, solvent accessibility, disorder, low-complexity, and structural properties as potential learning features to the SVM. The majority of features were calculated using the Open Life Science Gateway (OLSGW) [26], which is a grid computing resource that facilitates the computation of complex biological problems. The dataset used in this study was retrieved from Bcipep, AntiJen [27], and
- 11 -
immune epitope database (IEDB) [28], and the peptides were extended to a final length of 100 amino acids in order to obtain accurate prediction of structural properties. Features extracted from the dataset were used as input to SVM trained with different kernel functions, including linear, polynomial kernels of degrees 2 and 3, RBF, and sigmoid kernels. The authors found that the best accuracy, 82.16%, was achieved with SVM trained with evolutionary information combined with secondary structural information, using a polynomial kernel of degree 3.
1.6 Protein energy
The majority of physicochemical properties, thus the machine learning methods that were derived from them, are based on the antigenic protein structure. A protein needs to fold into specific three-dimensional conformation to carry out its biological role. Protein folding is organized at various levels. The linear sequence of amino acids constitutes the protein primary structure. The primary sequence is held together by covalent or peptide bonds, which are made during the process of protein biosynthesis. The primary structure of a protein is encoded by the gene corresponding to the protein. A specific sequence of nucleotides in a gene segment is transcribed to mRNA, which is translated into protein by ribosomes. The primary sequence of a protein is exclusive to that protein, and determines the three-dimensional structure and function of the protein.
Secondary structure refers to local substructures, such as alpha helix, beta strand or beta sheets. These secondary structures are held together by hydrogen bonds, which are one of the main factors in the stabilization of secondary structure in proteins. Depending on the primary structure, hydrogen bonds form at specific places along the main chain peptide groups. Patterns and arrangement of hydrogen bonds define local secondary structures.
- 12 -
Tertiary structure is the three-dimensional structure of a single protein polymer that is created by bringing together the local secondary structures to form a compact globule. The folding is driven by the hydrophobic effect, in which nonpolar amino acids, such as alanine, valine, leucine, isoleucine, phenylalanine, tryptophan and methionine, cluster together within the protein for form a hydrophobic core. Exclusion of the hydrophobic core from water, while exposing charged and polar sides chains to the surface of protein, where they interact with surrounding water molecules, stabilizes the folded state of tertiary structure. Furthermore, formation of hydrogen bonds also helps to define the shape of a protein’s tertiary structure.
Some proteins also possess a quaternary structure, which is the ensemble of multiple protein molecules or polypeptide chains in a multi-subunit complex. The subunits in a quaternary structure are stabilized by non-covalent interactions and disulfide bonds. Different subunits in a complex may have unique functions. For instance, in an enzyme complex such as the DNA polymerase, some subunits carry out regulatory functions, whereas others carry out catalytic activity. The different intermolecular bonds and forces play a very important role in keeping the shape of proteins. Proteins must fold into specific three-dimensional conformations in order to perform their biological functions.
While the correct three-dimensional structure is essential to function, the macromolecule is usually flexible and dynamic. It can rearrange its shape in response to local perturbations such as mutations. Current continuous B-cell epitope prediction methods identify a peptide as epitope or non-epitope based on features extracted from its sequence composition. However, genetic variability exists as a result of mutations, and two or more phenotypes of an antigen may exist simultaneously in a population. None of the published methods has systematically combined and compared protein properties associated with antigenic mutants. In view of the dependence of current prediction methods on sequence composition, occurrence of mutations in the antigenic
- 13 -
sequence may affect prediction performance. That epitope prediction methods based on computational methods aim to identify candidate peptides for the development of vaccine design makes the dependence of prediction results on a single antigenic phenotype particularly impractical.
- 14 -
Statement of the Problem
One of the major challenges in the field of vaccine design is to identify continuous B-cell epitopes in an ever-evolving virus. Current prediction algorithms mostly rely on amino acid propensity scales and their variants. In view of the dependence of current prediction results on a particular sequence composition, existence of genetic variation in nature leads to variable prediction outcome. Each unique primary sequence composition leads to a unique set of intermolecular forces, which combine to produce total free energy that reflects the overall protein structure. While the majority of physicochemical properties are also related to protein structure, the performance of protein total free energy in continuous B-cell epitope prediction has not been evaluated. Features based on combining or comparing total free energy associated with antigenic mutants may be important in continuous B-cell epitope prediction and vaccine development.
Hypothesis
This study critically assesses point mutations and resultant protein energy in the prediction of continuous B-cell epitopes. It is proposed that features based on protein free energy associated with point mutations can be used to identify continuous B-cell epitopes through machine learning methods.
- 15 -
2.1 Introduction
B-cell epitopes are antigenic determinants that are recognized and bound by antibodies on the surface of B-cells, also known as B lymphocytes. When an antibody binds to cognate antigens on the surface of invading microbes, the antibody can tag the microbe or infected cell for attack by other parts of the immune system, or can neutralize the microbe directly. Consequently, understanding and identification of B-cell epitopes is critical for the design of effective vaccines. Based on structure and interaction with the antibody, B-cell epitopes can be classified into two types, continuous epitopes and discontinuous epitopes. A continuous epitope is a short peptide that corresponds to a contiguous amino acid sequence fragment of a protein. A discontinuous epitope is composed of amino acids that are not contiguous in the antigenic sequence, but are close together in the folded antigenic structure. That an antibody and its cognate antigen possess complementary geometric shapes implies antibody-antigen interactions are also conformation dependent in the case of continuous B-cell epitopes.
Current continuous B-cell epitope machine learning methods are mostly based on physicochemical properties and their variants. However, a major problem associated with current methods is that they are based on a single sequence composition, and the results of these methods are affected by the occurrence of mutations. This is impractical considering that epitope regions are prone to mutations, possibly as a means to escape immune detection. In this study, I systematically introduced mutations along the length of proteins and determined the protein free energy associated with point-mutated sequences in folded state. The set of protein free energy was used to construct a novel type of features based on combining or comparing the protein free energy. This study is primarily concerned with patterns in protein free energy that contribute to the learning process of classifiers in continuous B-cell epitope prediction.
- 16 -
A total of 44 energy-related features were proposed. The performance k-NN, SVM, and ANN trained with these features was analyzed. In order to identify features that are particularly relevant to continuous B-cell epitope prediction, performance of subsets of the features in bringing about good classification performance was analyzed. Since continuous B-cell epitopes exist in various lengths, I also checked the sensitivity of prediction performance to epitope length. In addition, the performance of publicly available B-cell epitope prediction methods was compared with each other, and with my method. I reported direct comparison of my method with ABCPred, BCPred, and the AAP method implemented by El-Manzalawy et al. The performance of the classifiers was validated on an independent dataset.
- 17 -
2.2 Methods
Dataset
B-cell epitopes were selected from Bcipep database [12]. We used a total of 200 epitopes distributed across 145 protein sequences for training and testing our classification methods. For energy estimation purposes, we retrieved antigenic sequences from Uniprot based on the accession number associated with each source antigen [29]. Non-epitope peptides were generated by randomly extracting segments from the 145 protein sequences while ensuring that the non-epitope peptides so obtained were not present in the epitope data set. This approach is certainly an approximation for non-epitope sequences, as the proteins involved have not been explicitly mapped. To avoid classification bias resulting from non-epitope peptides, I generated a total of 1000 non-epitope peptides. For each epitope in the training or testing dataset, a non-epitope peptide of the same length was randomly selected from the pool of 1000 non-epitope peptides.
Blind dataset
To evaluate the energy-related features on an independent dataset, a set of 85 epitopes distributed across 45 protein sequences was retrieved from the AntiJen database [27]. As a reference, a set of 100 non-epitope peptides was randomly selected from the protein sequences with the criterion that the selected non-epitopes were not the same as any one of the epitopes.
Dataset for current continuous B-cell epitope prediction methods
A number of current B-cell epitope prediction methods, such as BCPred, ABCPred, and the AAP method, require input peptides of specific lengths [11, 15, 16]. These methods demonstrated
- 18 -
superior performance with peptides of 16 amino acids in length. To compare the performance of the energy-related features to that of current prediction methods, the peptides in the aforementioned datasets were fixed to 16 amino acids in length. If the peptide length is less than 16 amino acids, the peptide is extended by adding an equal number of amino acids to both ends based on the protein sequence of the source antigen. If the peptide length is shorter than 16 amino acids, the peptide is shortened by trimming amino acids from both ends.
Energy estimation
Protein structure modeling was performed using SWISS-MODEL [30-32], an automated protein structure homology-modeling server. First, antigenic protein sequences were submitted to identify known protein structures that resemble the structure of the antigen. Those antigenic sequences for which we did not find suitable templates from the structural database were not included in our data set. For sequences we identified suitable templates, the template with the lowest E-value was chosen. Subsequently, the template ID and antigenic protein sequence were submitted to the server for homology modeling, and the resultant PDB file was saved locally for further operations.
Mutations in the PDB structures were initiated using Deepview [30], a molecular visualization package designed to interact with the SWISS-MODEL server, and the
point-mutated structure was energy minimized and equilibrated using the
Deepview-implementation of the GROMOS96 force-field [33]. Each site in the antigenic structure was mutated to each of the 20 naturally occurring amino acids. Following energy minimization, protein free energy (FE) associated with a particular point-mutated structure was recorded. Thus, a total of 20L FE was obtained for an antigen with sequence length of L. Note that we minimized FE with respect to bond lengths, bond angles, torsion energies, and improper
- 19 -
angles. While minimizing non-bonded interaction energy would certainly yield more accurate energy estimation, the search for a global minimum in energy is computationally expensive, due to the vast number of conformational variants analyzed in this study. Therefore, throughout this analysis, we make the assumption that conformation of a stable protein resulting from a single site substitution resembles that of the parent protein closely, with any tertiary structural changes localized in the neighborhood of the substitution.
As a consequence of protein energy estimation, epitopes in the data set were selected based on the following conditions: (i) the accession number of source antigen is provided, (ii) there exists a template structure for the antigenic sequence, and (iii) the antigen-template alignment provides information about the spatial arrangement of the epitope.
Figure 2-1 – System control flow for energy-related features.
- 20 - Energy features
Three types of energy features were proposed in this study - FEavg, FEdiff, and FEss. I used
Deepview [30] to calculate the FE used to generate the three types of features. For a sequence of length L, a total of 20L FE was determined. Based on the 20 FE associated with inducing the 20 possible point mutations at a particular site, the minimum FE was determined and assigned to that site. As a result, an amino acid sequence is transformed into a numerical sequence, with each numerical value representing the optimal stability that results from inducing a point mutation on the corresponding site. The minimum FE from each sequence is subtracted from all the FE in that sequence. Given a peptide, the length of which is delineated by window size of w, a 1D FEavg
feature was constructed by averaging the FE associated with each amino acid, denoted as ,
where .
∑ (2.1)
I used w of 6, 10, 14, 18, 22, 26, and 30 amino acids in length to generate different 1D FEavg
features. The idea of 1D FEavg was further extended to a 3D perspective. For 3D FEavg, I
considered a sphere S with center coordinate that correspond to the coordinate associated with the mid-index of the peptide in three-dimensional space. The size of S is defined by a specified value
of radius r. By averaging the FE associated with , where , I obtained 3D FEavg.
- 21 -
The radii used to generate 3D FEavg features were 3.0A, 5.0A and 10.0A. Examples of 1D and 3D
FEavg features are illustrated in Figure 2-2a.
A 1D FEdiff feature describes the difference between 1D FEavg and the weighted average of
FE in upstream and downstream regions, where the weight of each equals 0.5. A large difference
suggests an energy fluctuation between neighboring regions in proteins, whereas a minor difference indicates a consistent pattern in energy. I used window sizes of 3, 5, and 10 amino acids in length to define 1D upstream or downstream neighborhood.
(2.3)
In three-dimensional space, the peptide is extended to a sphere, as described previously, and the upstream and downstream peptides are extended to a shell surrounding the sphere. Given spheres and respectively, where is greater than , is their
difference in volume. 3D FEdiff is defined by
( ) (2.4)
Table 2-1 summarizes the selected lengths for and . Examples of 1D and 3D FEdiff
features are illustrated in Figure 2-2b.
In contrast to the previous two types of features, which analyze FE confined to the area surrounding the peptide, FEss features consider of the peptide with respect to the full
antigenic sequence. Using a sliding window approach, a total of L – w – 5 can be collected from a full sequence. Note that I removed three FE from each end of the sequence
- 22 -
where the peptide is relatively unstructured. If there exists a distribution for the set of FEavg
collected from the full sequence, FEss is defined as the standard score of the FEavg associated with
the peptide with respect to the set of FEavg collected from the full sequence. In other words, a 1D
FEss feature compares the 1D FEavg of the peptide to the mean of the set of 1D FEavg successively
averaged within a sliding window along the protein sequence. The comparison is expressed as the
number of standard deviations of the 1D FEavg from mean.
(2.5)
Similar to 1D FEavg features, I used window sizes of 6, 10, 14, 18, 22, 26, and 30 amino acids in
length to generate 1D FEss features. From a three-dimensional perspective, I collected a set of 3D
FEavg generated by successively setting the coordinate associated with each site along the full
antigenic sequence as the center coordinate of , and averaging the FE associated with ,
where , thus generating a set of 3D FEavg. The mean and standard deviation of the set
of 3D FEavg were determined. 3D FEss feature is defined as
(2.6)
The radii used to define 3D FEss features were 3.0A, 5.0A and 10.0A. In total, 44 energy-related
features were constructed. Table 2-1 summarizes the choice of parameters used to define the features.
- 23 -
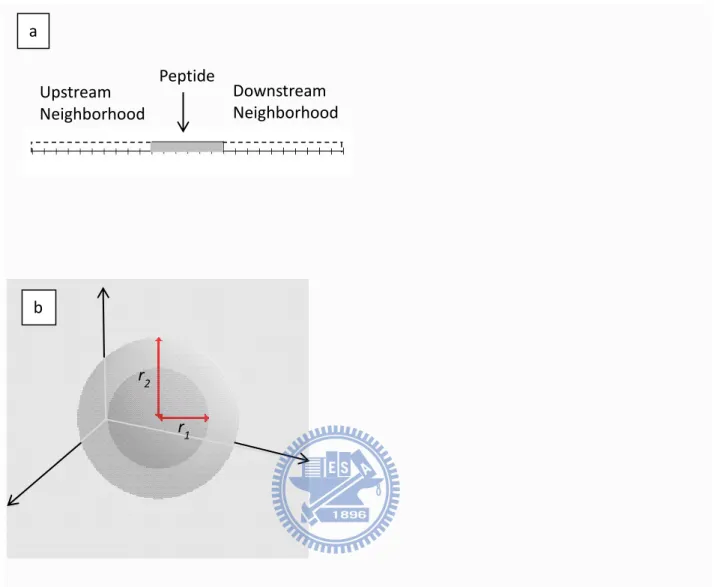
Figure 2-2. a) 1D FEdiff feature based on a neighborhood of 10 amino acids on both sides. The
value of this 1D FEdiff feature is the difference in FE between the peptide and its neighborhood on
both sides. b) 3D FEdiff feature defined by a central sphere with radius r1 and a shell with radius r2.
The feature value is the difference in FE between the sphere and the shell.
r1 r2 a b Peptide Upstream Neighborhood Downstream Neighborhood
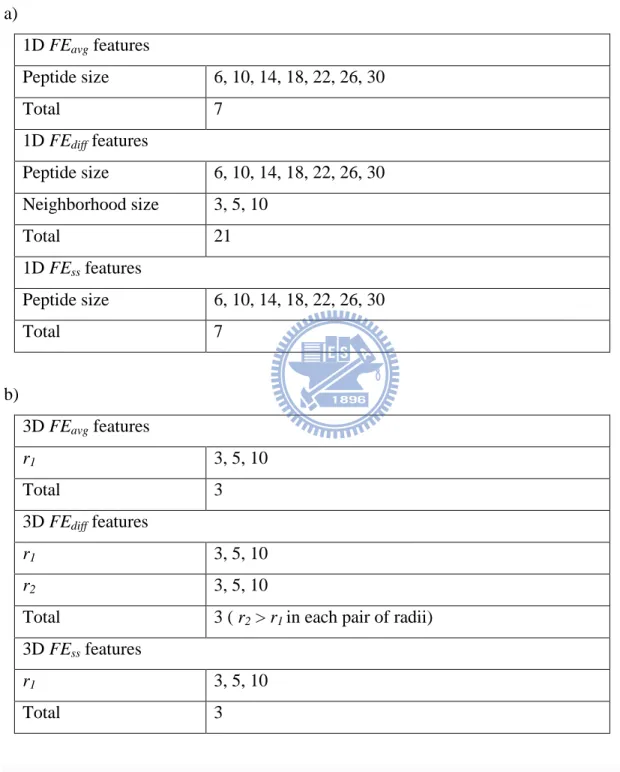
- 24 -
Table 2-1. a) Parameters used to define 1D energy-related features. b) Radii used to define 3D energy-related features. a) 1D FEavg features Peptide size 6, 10, 14, 18, 22, 26, 30 Total 7 1D FEdiff features Peptide size 6, 10, 14, 18, 22, 26, 30 Neighborhood size 3, 5, 10 Total 21 1D FEss features Peptide size 6, 10, 14, 18, 22, 26, 30 Total 7 b) 3D FEavg features r1 3, 5, 10 Total 3 3D FEdiff features r1 3, 5, 10 r2 3, 5, 10
Total 3 ( r2 > r1 in each pair of radii)
3D FEss features
r1 3, 5, 10
- 25 - Existing methods
We also implemented a number of existing methods for continuous B-cell epitope prediction to determine how these compare with the energy descriptors that we have developed. These parameters can be grouped into amino acid propensity scales, word probabilities [13], sequence complexity [13, 34], and the amino acid pair (AAP) antigenicity scale [15].
58 amino acid propensity scales were obtained from ProtScale
(http://us.expasy.org/cgi-bin/protscale.pl; as of May 2012). These scales reflect physicochemical properties such as hydrophobicity, and secondary structure. Based on each propensity scale, the average value for a peptide was determined. Additionally, the pair wise difference between an amino acid and its neighbor was determined, then averaged over the length of the peptide.
Word probabilities were calculated as described by Sollner and Mayer [13]. These features estimate if successions of certain amino acid patterns, or words, exhibit a higher prevalence in one of the two sequence sets considered. Specifically, a neighborhood matrix, which describes the probability of each possible amino acid pattern in the neighborhood, was created based on a set of training sequences. The matrix held frequencies for patterns of length 1-3 amino acids. Subsequently, the matrix was used to classify a peptide by assigning matrix values to neighborhoods surrounding the peptide of interest.
Sequence complexity was calculated as described by Wootton and Federhen [34]. It describes the amino acid frequencies f(x) in epitope and control peptides, and the complexity C of a peptide is given by
- 26 -
Finally, we also implemented the AAP antigenicity scale developed by Chen et al. [15]. It has been reported that the AAP composition for epitopes is different from that of non-epitopes. Specifically, the AAP antigenicity is defined by
(
) (2.8)
where and are the observed frequencies of a given AAP in epitopes and non-epitopes,
respectively. In my implementation, both and were derived from the training data set.
In total, 178 parameters were constructed based on existing methods for continuous B-cell epitope prediction.
Table 2-2. Features used in published continuous B-cell epitope prediction methods.
Feature type Number of features
Amino acid propensity scale 58
Amino acid propensity scale (pair-wise
difference) 58
Word probability 60
Sequence complexity 1
AAP 1
- 27 - Feature normalization
Since the novel FE features are based on the free energy of protein, the input matrix to classifiers was column-wise normalized so that each column has a zero mean and variance one. That is, features fit to a standard normal distribution after normalization.
Classifier implementation
I applied the WEKA [35] implementation of k-nearest neighbor (IBk), SVM (SVMlib) with RBF kernel, and ANN (Multilayer Perceptron). In each tenfold cross validation, the ten classifiers used the same set of parameters for learning. In other words, the classifiers were not optimized for individual test sets. Rather, they were optimized in order to get the best average accuracy.
- 28 -
2.3 Results
Tenfold cross-validation
I used stratified tenfold cross-validation tests. The data set was randomly divided into ten equal subsets such that the number of epitopes to non-epitopes was in a 1:1 ratio. Nine of the ten subsets were used for training the classifier, and the tenth subset was used for testing the classifier. This procedure was repeated ten times, with each subset used exactly once as the testing data. Results from five tenfold runs were averaged to produce a single value, which represents the estimated performance of classifier.
Performance of energy-related features in selected classifiers
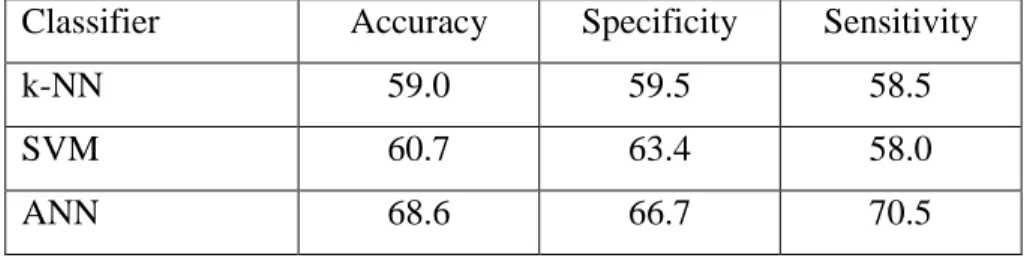
In this study, 44 energy-related features were developed for continuous B-cell epitope prediction. First, the energy-related features were tested on learning algorithms that have previously demonstrated prominent performance in the prediction of continuous B-cell epitopes, namely k-NN, SVM, and ANN. Performance of the classifiers trained with energy-related features is shown in Table 2-3. The maximum performance was achieved by the ANN containing a single hidden layer of 23 hidden units, which demonstrated 68.6%, 66.7%, and 70.5% in accuracy, specificity, and sensitivity, respectively. During this initial evaluation of the energy-related features, I tested a number of options on the learning algorithms, but the accuracy did not improve further (data not shown).
- 29 -
Table 2-3. Performance of k-NN, SVM, and ANN trained with the energy-related features.
Classifier Accuracy Specificity Sensitivity
k-NN 59.0 59.5 58.5
SVM 60.7 63.4 58.0
ANN 68.6 66.7 70.5
Relevance of energy-related features
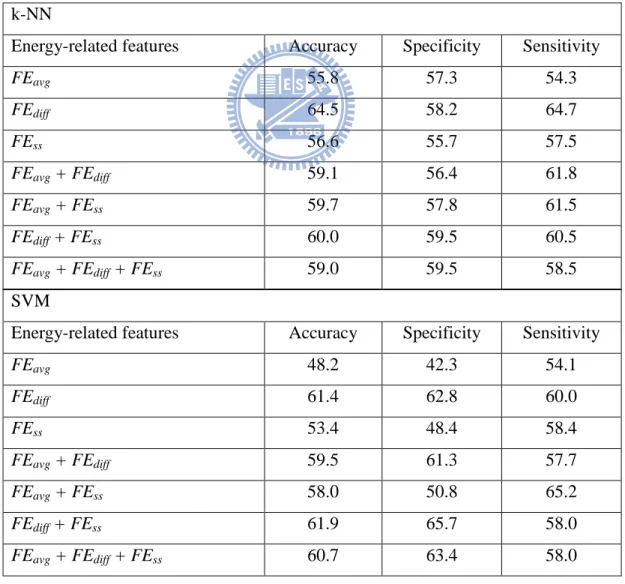
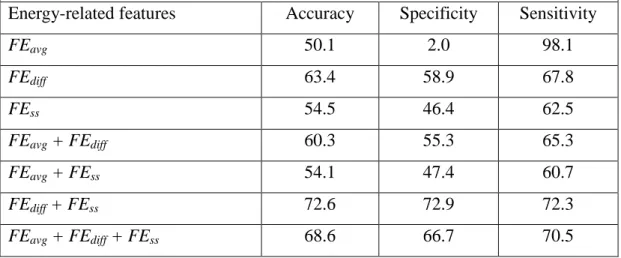
To further assess the relevance of the three types of energy features that were designed, I trained and tested the classifiers with different subsets of energy-related features. As shown in Table 2-4, the extent to which classification performance was affected varied between k-NN, SVM, and ANN. However, FEdiff and FEss combined achieved accuracy similar to the accuracy obtained
using all 44 energy-related features (FEavg, FEdiff, and FEss combined) in k-NN, SVM, and ANN.
In fact, in the case of the ANN classifier, the accuracy achieved using FEdiff and FEss exceeded
that achieved using all the energy-related features combined. The combination of FEdiff and FEss
will be collectively referred to as FEbest for the rest of the study.
I compared the performance of 1D FEbest features relative to 3D FEbest features as a first step
to analyze the sensitivity of the classifiers to window size. The result of classification, based on
1D or 3D FEbest features, is shown in Table 2-5. The accuracy achieved by the classifiers trained
with 3D FEbest features was higher than that of the classifiers trained with 1D FEbest features. That
the accuracy achieved with 3D FEbest features is comparable to the accuracy achieved using both
1D and 3D FEbest features suggests the 3D FEbest features play an important role in epitope
prediction. To further test the sensitivity of the classifiers to 3D window size, I performed an ablation study by removing one 3D FEbest feature at a time, and analyzing the performance of
- 30 -
classifiers trained with the remaining features (Table 2-9 in supplementary material). The result shows that the performance of the classifiers was not specifically influenced by removal of any
one of the 3D FEbest features. Rather, the predictive performance was optimal when the classifiers
were trained with the entire set of 3D FEbest features. This may be due to that fact that B-cell
epitope do not have a fixed length. Therefore, continuous B-cell epitope predictions based on any specific window size may not be able to detect epitopes with a diversity of lengths.
Table 2-4. Performance of k-NN, SVM, and ANN trained and tested with different subsets of energy-related features.
k-NN
Energy-related features Accuracy Specificity Sensitivity
FEavg 55.8 57.3 54.3 FEdiff 64.5 58.2 64.7 FEss 56.6 55.7 57.5 FEavg + FEdiff 59.1 56.4 61.8 FEavg + FEss 59.7 57.8 61.5 FEdiff + FEss 60.0 59.5 60.5 FEavg + FEdiff + FEss 59.0 59.5 58.5 SVM
Energy-related features Accuracy Specificity Sensitivity
FEavg 48.2 42.3 54.1 FEdiff 61.4 62.8 60.0 FEss 53.4 48.4 58.4 FEavg + FEdiff 59.5 61.3 57.7 FEavg + FEss 58.0 50.8 65.2 FEdiff + FEss 61.9 65.7 58.0 FEavg + FEdiff + FEss 60.7 63.4 58.0
ANN
Energy-related features Accuracy Specificity Sensitivity
FEavg 50.1 2.0 98.1 FEdiff 63.4 58.9 67.8 FEss 54.5 46.4 62.5 FEavg + FEdiff 60.3 55.3 65.3 FEavg + FEss 54.1 47.4 60.7 FEdiff + FEss 72.6 72.9 72.3 FEavg + FEdiff + FEss 68.6 66.7 70.5
Table 2-5 - Performance of k-NN, SVM, and ANN trained with 1D or 3D FEbest features.
k-NN
Energy-related features Accuracy Specificity Sensitivity
1D FEbest 55.0 54.9 55.1
3D FEbest 74.3 79.6 68.9
SVM
Energy-related features Accuracy Specificity Sensitivity
1D FEbest 56.1 60.7 51.5
3D FEbest 66.1 76.7 55.5
ANN
Energy-related features Accuracy Specificity Sensitivity
1D FEbest 56.0 51.3 60.6
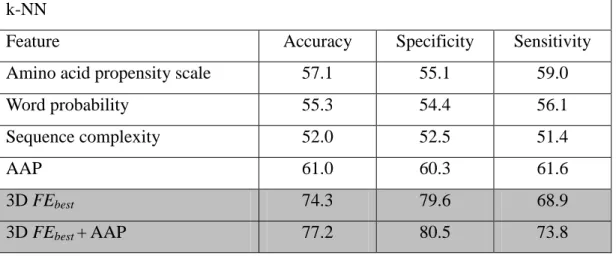
- 32 - Comparison with previous features
To demonstrate the significance of energy-related features, I compared them with other features that were previously used for prediction of continuous B-cell epitopes. I included 178 previously used features for comparison, as summarized in Table 2-2. They were derived from amino acid propensity scales, word probabilities, sequence complexity, and AAP antigenicity scales. In this comparative study, the classifiers were trained on the four different types of features, as well as the novel energy-related features. Among the previously developed features, k-NN, SVM, and ANN consistently demonstrated the best performance when trained with the AAP antigenicity scale, as shown in Table 2-6. The 3D FEbest features, and the AAP antigenicity scale, both
achieved greater than 60% accuracy in k-NN, SVM, and ANN. When I combined the 3D FEbest
and AAP antigenicty scale features, k-NN, SVM, and ANN produced accuracy of 77.2%, 78.6%,
and 81.4%, respectively. The AAP antigenicity scale, and the 3D FEbest features, can work
together in the identification of continuous B-cell epitopes, and the combination of features may even lead to a complementary effect, as observed in the SVM classifier.
Table 2-6 – Performance of k-NN, SVM, and ANN trained with previously used features or the novel energy-related features.
k-NN
Feature Accuracy Specificity Sensitivity
Amino acid propensity scale 57.1 55.1 59.0
Word probability 55.3 54.4 56.1
Sequence complexity 52.0 52.5 51.4
AAP 61.0 60.3 61.6
3D FEbest 74.3 79.6 68.9
- 33 - SVM
Feature Accuracy Specificity Sensitivity
Amino acid propensity scale 62.9 64.6 61.1
Word probability 52.8 54.2 51.4 Sequence complexity 47.6 52.5 42.7 AAP 70.1 69.7 70.5 3D FEbest 66.1 76.7 55.5 3D FEbest + AAP 78.6 79.8 77.4 ANN
Feature Accuracy Specificity Sensitivity
Amino acid propensity scale 57.5 55.1 59.9
Word probability 50.9 29.4 72.3
Sequence complexity 49.7 0.2 99.1
AAP 70.8 62.8 78.8
3D FEbest 80.0 83.9 76.0
3D FEbest + AAP 81.4 80.8 82.0
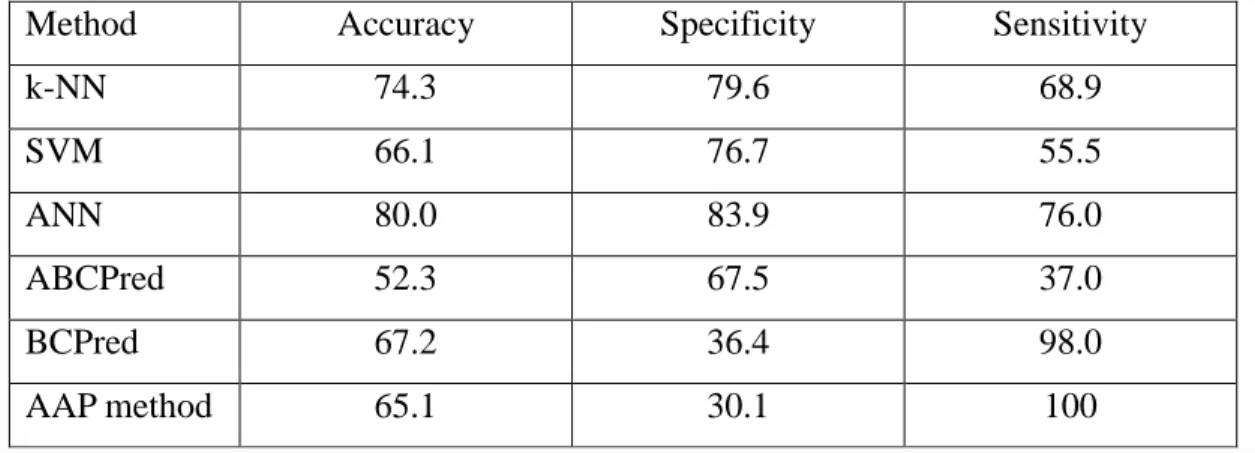
Comparison with existing continuous B-cell epitope prediction
In addition to comparing energy-related features to previously used features, I also compared the
k-NN, SVM, and ANN trained with 3D FEbest features with current epitope predictors, namely
ABCPred [11], BCPred [16] and the AAP method [15, 16]. Table 2-7 shows the performance of the classifiers trained with 3D FEbest features, and the performance of prediction servers. Upon
submission of testing examples to the trained servers, scores ranged between 0 and 1.0 are returned, where a higher score value indicates higher probability of the peptide to be predicted as B-cell epitope. The threshold was set at 0.5 for ABCPred, as suggested in the publication by Saha and Raghava [11]. For BCPred and the AAP method, the related publications did not indicate the optimal threshold values. In this study, the best performance was observed for BCPred and the
- 34 -
AAP method when the threshold was set at 0.9. Since BCPred and the AAP method both returned scores close to or equal to 1.0, both servers showed a higher sensitivity in prediction than the other classifiers, but both suffered severely in low specificity. The overwhelming false positive rate is especially impractical for vaccine development as the advantage through computational prediction, mainly the reduction of time and cost, is diminished when the prediction returns too many candidate peptides for further experimental screening. The k-NN and ANN classifiers
trained with 3D FEbest features outperformed the current prediction servers available for
continuous B-cell epitope prediction in terms of specificity, as well as accuracy, whereas the
SVM trained with 3D FEbest features demonstrated comparable performance with respect to the
current prediction servers.
Table 2-7. Performance of k-NN, SVM, and ANN trained with 3D FEbest features, and
performance of current epitope prediction servers ABCPred, BCPred and AAP method.
Method Accuracy Specificity Sensitivity
k-NN 74.3 79.6 68.9 SVM 66.1 76.7 55.5 ANN 80.0 83.9 76.0 ABCPred 52.3 67.5 37.0 BCPred 67.2 36.4 98.0 AAP method 65.1 30.1 100
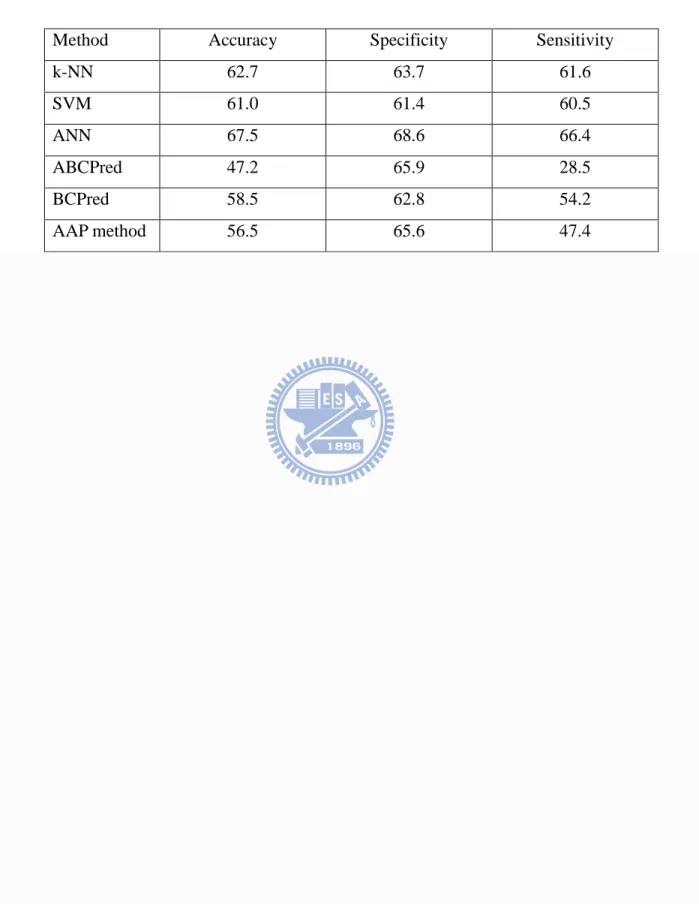
Testing on an independent dataset
To evaluate the performance of classifiers trained with 3D FEbest features, I computed its
- 35 -
[27]. To ensure that the testing dataset is independent of the training data set, protein epitopes were selected from the AntiJen database such that the epitopes do not overlap with those selected from the Bcipep database. The classifiers were trained with the data set retrieved from the Bcipep database, and tested on the data set retrieved from the AntiJen database. The k-NN, SVM, and ANN demonstrated 62.7, 61.0, and 67.5% in accuracy, respectively, as shown in Table 2-8. For the purpose of comparison, I also evaluated the performance of ABCPred, BCPred, and the AAP method. Similar to my method, ABCPred, BCPred method and the AAP method were trained on datasets obtained from the Bcipep database. The ABCPred server demonstrated an average accuracy of 47.2% using a threshold value at 0.5. The BCPred, and AAP method demonstrated 58.5%, and 56.5% in accuracy, respectively, using threshold values at 0.9.
In the classifiers trained with the 3D FEbest features, a possible reason for the observed drop
in prediction performance may be due to the difference in epitope density in the two datasets. In the dataset retrieved from Bcipep, the 200 epitopes were distributed across 145 proteins, whereas in the dataset retrieved from the Antijen database, 85 epitopes were distributed across 45 proteins. Since the construction of FEdiff features is based on comparing the free energy of structures
mutated in the epitope region and structures mutated in non-epitope regions, the higher epitope
density (in the dataset retrieved from the Antijen database) affects the relevance of FEdiff features.
In addition, the performance of the classifiers may be over-fitting the training dataset from the Bcipep database to some extent. That the published servers were trained with peptides from the Bcipep database, it is likely that these servers also over-fitted examples from the Bcipep database.
Nonetheless, the result indicates that classifiers trained with 3D FEbest features have the ability to
- 36 -
Table 2-8 – Performance of current servers, and k-NN, SVM, and ANN trained with 3D FEbest
features on a data set retrieved from the AntiJen database.
Method Accuracy Specificity Sensitivity
k-NN 62.7 63.7 61.6 SVM 61.0 61.4 60.5 ANN 67.5 68.6 66.4 ABCPred 47.2 65.9 28.5 BCPred 58.5 62.8 54.2 AAP method 56.5 65.6 47.4
- 37 -
2.4 Discussion
One of the challenges for developing reliable continuous B-cell epitope predictors is how to deal with epitope variability. While a number of approaches for continuous B-cell epitope prediction has been developed based on physicochemical properties of antigenic proteins, these studies were based on a single sequence composition of the antigen, from which the physicochemical properties were derived. Consequently, the effect of antibodies generated through reversed immunological approach is questionable since considerable variability exists in the epitopes. In this study, I explored the total free energy associated with 20L possible conformations resulting from a single site mutation in a protein structure with sequence length L. To the best of my knowledge, energy of the free antigenic structure has not been used in the context of B-cell epitope identification tasks. Based on free energy, I identified point mutations that are more likely to occur among the 20L point mutations. While mutations are randomly introduced to DNA, certain amino acid substitutions are rarely observed in nature because these point mutations can cause serious collisions in the amino acid side chains, which lead to thermodynamically unstable protein structures. Therefore, analysis of total free energy provided a way to eliminate mutations that are thermodynamically unstable, hence unlikely to be observed in nature. In total, I constructed 44 energy-related features, which can be grouped into three classes - FEavg, FEdiff,
and FEss. I evaluated the performance of k-NN, SVM, and ANN trained with the novel
energy-related features, and found that the FEdiff and FEss features, collectively referred to as
FEbest features, are particularly relevant to the prediction of continuous B-cell epitopes. When I
further evaluated the sensitivity of the classifiers to window size, the results indicate that the classifiers trained with 3D FEbest features outperform those trained with 1D FEbest features. In
- 38 -
in continuous B-cell epitope prediction. The 3D FEbest features demonstrated comparable
performance to the AAP antigenicity scale, and superior performance over the rest of the
previously used features. Furthermore, k-NN, SVM, and ANN trained with 3D FEbest features
outperformed current continuous B-cell epitope prediction servers, namely ABCPred, BCPred, and the AAP method.
Besides testing the energy-related features on k-NN, SVM, and ANN, I also tested the features on hierarchical learning algorithms, such as the C4.5 decision tree. However, the energy-related features are less effective in the prediction of continuous B-cell epitopes when they are considered within hierarchical classifiers (results shown in supplementary material, Table 2-10). In fact, when I analyzed the information gain of energy-related features, none of the features demonstrated superior relevance to the prediction of continuous B-cell epitopes. The energy-related features achieved enhanced predictive performance in classification systems that consider the overall set of input features, as observed with k-NN, SVM, and ANN.
As with most current machine learning methods, the development of energy-related features required specification of peptide length. For instance, Chen et al. computed the AAP antigenicity scale for peptides that were 20 amino acids in length [15]. In addition, the ABCPred classifier developed by Saha and Raghava was trained with input peptides of fixed length, and the reported optimal performance was achieved with a data set consisting of peptides that were 16 amino acids in length [11]. In this study, two distance measures were considered; the 1D distance defined by amino acid length, and the 3D distance defined by Angstroms. The 1D distance measure intended to identify the center of a continuous B-cell epitope, whereas the 3D distance measure intended to identify the core of a three dimensional space, to which an antibody may interact with. The 1D and 3D features were combined to see if they could work together to determine the likelihood of a particular peptide to be identified as a B-cell epitope. Since the length of epitopes typically
- 39 -
range from 3 to 30 amino acids in length, I defined the 1D window from 6 to 30 amino acids with increments of 4 amino acids in between. The 3D window was defined as 3, 5, or 10 Angstroms. The results showed that the 3D features work better than 1D features in the identification of continuous B-cell epitopes. Furthermore, the results demonstrate that the performance of the classifiers was dependent on the combined information collected from variable window sizes, rather than from any specific window size. One of the reasons for this outcome is that B-cell epitopes do not have any fixed length, thus using a window of fixed length for prediction can misrepresent the peptide being analyzed, and reduce the overall prediction accuracy. The drawback of determining epitopes based on the information collected from variable window sizes is that the determined epitopes do not have correct boundaries. For the purpose of vaccine development, the overall improvement in accuracy outweigh the drawbacks as peptides of slightly different lengths may still be able to elicit the production of anti-peptide antibodies, which would in turn attack the native antigenic protein. Results of the study also indicated that the neighbors of B-cell epitopes also carry useful information that can help the classifier to identify epitopes. This is especially interesting given that the neighborhood region has been shown to play an important role in other continuous B-cell epitope prediction studies, such as the study by Sollner et al. [13], in which the authors showed that the neighborhood regions exhibit certain patterns in primary sequence. Furthermore, experimental studies have shown that mutating the neighborhood region of a B-cell epitope may alter the structure of the epitope, thus affect binding of the antibody [36]. Results of this study showed that free energy based on inducing point mutations in the epitopes and in the neighborhood regions adjacent to epitopes both contribute to the prediction of continuous B-cell epitopes.