An artificial neural network model to
estimate grain size on a river bed
from UAV photographs and DEMs
Daiki Takeuchi, Satoru Nakanishi
Abstract
Information about particle size distribution of river bed materials is essential for hydraulic modeling, sediment transport simulation, and physical habitat assessment. To determine the impact of sediment supply on the downstream from the sediment bypass tunnel, the particle size of bed materials must be continuously monitored. Classic methods, including grid sampling, transect sampling, and volumetric sampling, are used to determine particle size; however, investigating many sites over a short term and obtaining information about the spatial distribution is difficult. To deal with these difficulties, the effectiveness of using image processing techniques or high resolution topographic data products has been recently reported. However, the range of particle sizes, shapes, and packing structures limit the applicability of these methods. This study proposes an artificial neural network (ANN) model to estimate particle size of gravel and sand from unmanned aerial vehicles (UAV) photographs and digital elevation models (DEMs), with improved estimation accuracy. The proposed model yielded a mean error of approximately −0.7 mm when compared with the actual observation data.
Keywords: grain size, UAV photographs, DEMs, artificial neural network
1 Introduction
River bed materials result in a diverse river environment. The properties of the river bed materials affect various river characteristics, including the amount and type of vegetation and the stream of the river. Building dams for water storage, flood control, or power production results in the prevention of downstream sediment transport, which leads to various problems, including the development of coarse grains and river bed armoring (Erskine, 1985). Further, a previous study has reported that the coastal erosion is dependent on the prevention of upstream sedimentation (Uda, 1993). Currently, the sediment that is trapped behind dams is planned to be released downstream, with the usage of sediment bypass tunnels (SBTs) considered to be one of the most effective methods for accomplishing this task. The sediment supply from dams result in the improvement of the water quality (Akiyama, 2012), the creation of a diversified physical environment (Fukuda et al. 2012), the nourishment of the beach, and a solution to the problems that have been briefly mentioned above. To understand these effects, it is important to monitor the changes in the river bed materials.
Grid sampling, transect sampling, and volumetric sampling are the methods that are extensively used to investigate the river bed materials. These methods represent the visual observation approaches that are used for evaluating and determining the grain size through field sampling and analyses. Therefore, it is difficult to investigate several sites over a short period of time and to obtain information related to the spatial distribution of the grain size.
Recently, methods of investigation using image processing techniques have been developed. Detert and Weitbrecht (2012) indicated that the detection techniques that are applied to analyze the digital top-view photographs of the gravel layer surface were effective for estimating the grain size. However, the range of particle sizes, shapes, and packing structures limit the applicability of these techniques (Pearson et al., 2017). Further, the digital elevation models (DEMs) that use the fine-resolution images collected using the unmanned aerial vehicles (UAV) can be easily used for image processing because of the development of survey technology. Pearson et al. (2017) denoted that the analysis of surface roughness based on the high resolution topographic surveys can predict the representative grain diameter in the river bed.
Furthermore, the estimation skills, especially while using artificial neural networks (ANNs), have made remarkable progress because of the advancements in computer performance. The application of ANN to various technologies has been studied in the context of river engineering as well as other engineering. For instance, Casado et al. (2015) indicated that the hydromorphological features can be identified by ANNs based on the UAV photographs. One of the advantages of ANNs is their ability to perform estimation by successfully processing multiple information sources.
The objective of this study is to obtain the spatial information associated with the particle size of the river bed gravel and sand from the UAV photographs and DEMs using an ANN model.
2 Methods and study site
The Koshibu River is a tributary to the Tenryu River in the Southern Japanese Alps, draining in a 295-km2 catchment in the Nagano Prefecture. The physical landscape of the basin is the median tectonic line across the center of the basin, which is dominated by the colluvium deposits. The current climatic conditions are typical of humid continental, and relatively warm summer weather. The average annual precipitation is approximately 1400 mm, including approximately 20 mm of annual snow precipitation from December to March. Further, the high-magnitude flood discharges are mostly related to the weather fronts, typhoons, and low pressure systems, which typically occur from June to October. The study area comprises a 250-m long and 50-m wide river, which is 1.8 km downstream from the Koshibu Dam and immediately upstream from the foot protection work. The
SBT of the Koshibu Dam was completed in 2016 and has been tentatively used since then. The design maximum discharge from this tunnel is 370 m3/s, and the annual sediment supply from the tunnel was approximately 10,000 m3 in 2017. The field observations in this study were conducted in August 2018 in sunny conditions.
2.1 Grid sampling
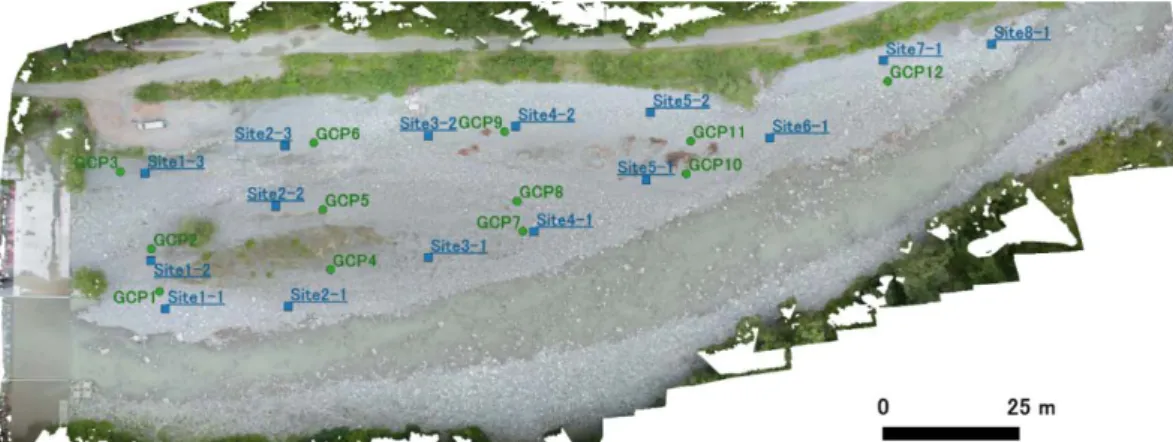
A 15-grid sampling dataset was collected from the study area (Fig. 1). The sample locations were selected to be representative of the dominant sediment faces. Each grid sampling site comprised 100 grains collected from a 2 × 2 m frame containing 0.2 × 0.2 m grids (Fig. 2). The averaged sediment size (Dm) can be defined as the geometric mean of the lengths of the large (a), intermediate (b), and short axes (c) (Eq. [1]).
𝐷𝐷𝑚𝑚 = √𝑎𝑎 ∙ 𝑏𝑏 ∙ 𝑐𝑐3 [1]
2.2 UAV surveys
The study area was photographed using a small digital camera (12.4-megapixel X3-FC350) mounted on a DJI Inspire 1 UAV at an altitude of 30 m above the ground level. Photograph acquisition was conducted at the original resolution of 13 mm per pixel, and the forward and side overlaps were greater than 60%.
A total of 12 ground control points (GCPs) were preselected before conducting the UAV survey, ensuring that they were positioned at relatively equal intervals (Fig. 1). The GCP sheet was constructed from a thin black and white checkered pattern, and the points were surveyed using a real-time kinematic global positioning system.
Fig. 2: The quadrat used for grid sampling
The images were imported into the photogrammetry software (Agisoft PhotoScan) and processed to create a 20-mm resolution orthophoto and a DEM with a 20-mm resolution; all the images were obtained using the GCPs by referencing to a local coordinate system. 2.3 ANN models
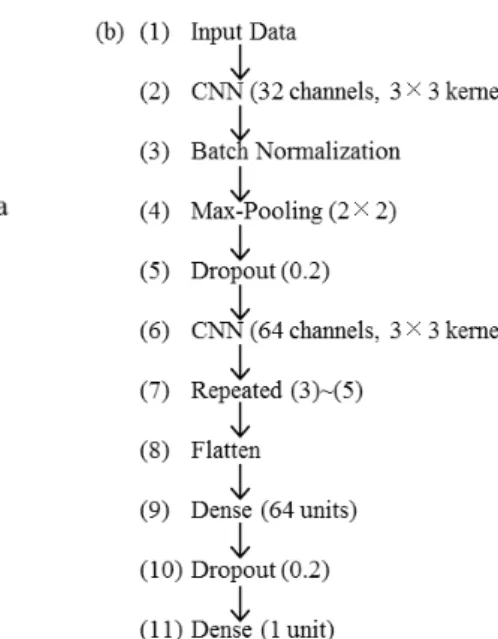
In this study, a deep convolutional neural network (DCNN), which is a class of ANN algorithms, was used to estimate the size of the river bed particles. The workflow is depicted in Fig. 3(a), and the flow diagram of our DCNN process and the predicting workflow are presented in Figs. 3(b) and (c), respectively. Three models, which represent a photo model (P-model), a DEM model (D-model), and both the models (B-model), were constructed for comparing the effectiveness of the input data originally obtained from the orthophoto and DEM. The architecture of DCNN process was built using double convolutional layers followed by batch normalization, a max pooling operation, and the usage of two dense layer classifiers. The first and second convolutional layer filters were 32 channels with 3 × 3 kernel and 64 channels with 3 × 3 kernel, respectively. Dropout was performed in the convolutional layer and the first dense layer with a dropout probability of 0.2 to avoid overfitting. The output of two convolutional layers and a dense layer were passed through nonlinearity, such as the rectified linear unit (ReLU), as expressed by Eq. [2].
𝑅𝑅𝑅𝑅𝑅𝑅𝑅𝑅(𝑥𝑥) = 𝑚𝑚𝑎𝑎𝑥𝑥 (𝑥𝑥, 0), [2]
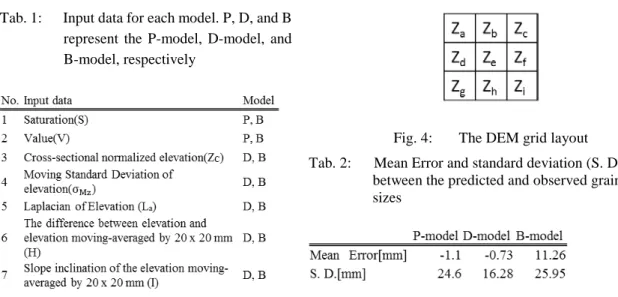
where max denotes the maximum value of the function. To construct the model, Keras framework (Cholet, 2015) with Tensorflow (Abadi et al., 2016) backend was used. The summary of the input data is presented in Tab. 1. The saturation and the value data obtained from the orthophoto were used as the input data from the photo. The hue data Fig. 3: General workflow for estimating the grain size: (a) training workflow of the ANN model; (b)
was not used because majority of the sediments on the study site were almost entirely black and white. Other input data were derived from the DEM data. The cross-sectional normalized elevation (ZC) was defined as the difference between the elevation and the
cross-sectional mean divided by the cross-sectional standard deviation. These data were expected to reveal the effect of sediment sorted by the river flow. The moving standard deviation of elevation (σMz) was derived using a 20 × 20 mm kernel size filter. The Laplacian of the elevation (La) was used to measure the surface curvature, which was
calculated using 3 × 3 DEM subgrids and a conventional four-neighborhood 3 × 3 Laplacian filter, which can be expressed in the following form (Iwahashi et al., 2009):
𝑅𝑅𝑒𝑒 = 4𝑍𝑍𝐶𝐶𝑒𝑒− (𝑍𝑍𝐶𝐶𝐶𝐶+ 𝑍𝑍𝐶𝐶𝐶𝐶+ 𝑍𝑍𝐶𝐶𝐶𝐶 + 𝑍𝑍𝐶𝐶ℎ), [3]
where the subscripts b through h indicate the grid layout defined in Fig. 4. The difference between the elevation and the moving averaged elevation derived as 20 × 20 mm was used to indicate the roughness characteristics of the gravel. The slope inclination (I) of the moving averaged elevation (20 × 20 mm (ZM)) can be expressed as follows:
where the subscripts a through i are the same as those presented in Fig. 4.
A total of 1,500 particle diameters obtained from 15 grid sampling sites were used as the training data. The data from one of those sites data (100 particle diameters) were used as the test data, and 10% of the remaining data (140 particle diameters) were used as the validation data. This technique was repeated 15 times as k-fold cross validation, and the models were trained using a predefined number of epochs (80). The model accuracy was
Tab. 2: Mean Error and standard deviation (S. D.) between the predicted and observed grain sizes
Fig. 4: The DEM grid layout Tab. 1: Input data for each model. P, D, and B
represent the P-model, D-model, and B-model, respectively 𝑆𝑆𝑥𝑥 =𝑍𝑍𝑀𝑀𝑀𝑀 + 𝑍𝑍𝑀𝑀𝐶𝐶 + 𝑍𝑍𝑀𝑀𝑀𝑀6𝑑𝑑− (𝑍𝑍𝑀𝑀𝑀𝑀+ 𝑍𝑍𝑀𝑀𝐶𝐶+ 𝑍𝑍𝑀𝑀𝑀𝑀) 𝑥𝑥 [4] 𝑆𝑆𝑦𝑦 = 𝑍𝑍𝑀𝑀𝑀𝑀+ 𝑍𝑍𝑀𝑀𝐶𝐶+ 𝑍𝑍𝑀𝑀𝑀𝑀6𝑑𝑑− (𝑍𝑍𝑀𝑀𝑀𝑀+ 𝑍𝑍𝑀𝑀ℎ + 𝑍𝑍𝑀𝑀𝑀𝑀) 𝑦𝑦 [5] 𝐼𝐼 = �𝑆𝑆𝑥𝑥2+ 𝑆𝑆𝑦𝑦2, [6]
evaluated using the mean of the 15 model scores. To estimate the particle diameter without the grid sampling sites, the ensemble mean of all the models was used.
The training, test, and validation data were normalized against varying contrast, which considerably aided the transferability of the trained ANN model. The normalized data (Xʹ) was calculated from the non-normalized data (X) using
𝑋𝑋′ = 255 and 𝑋𝑋 [7a]
𝑋𝑋′= 𝑋𝑋 − 𝜇𝜇
𝜎𝜎 , [7b]
where Eq. [7a] was the form for the data obtained by orthophoto, Eq. [7b] was the form for the data obtained by DEM, and μ and 𝜎𝜎were the mean and standard deviation, respectively (Palafox et al., 2017).
3 Results
Tab. 2 presents the performance accuracy of each model. The mean error indicates the mean of the difference between the test data estimation by model and the observation. The estimation performed using the D-model was observed to be the most accurate, which was followed by the P-model and the B-model. The standard deviation, which is indicative of the dispersion of difference, indicated the same trend as that indicated by the mean results. The decrease in model accuracy using both orthophoto and DEM for the input was caused because of insufficient tuning of the model parameters. Hence, the B-model has the potential to provide considerable insight into the estimation.
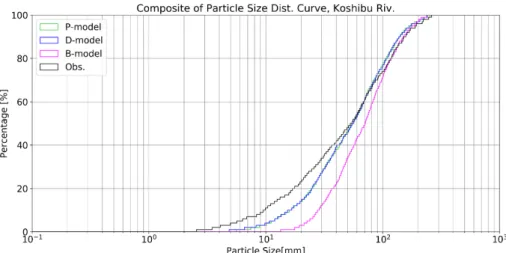
The composite particle size distribution curves using the data obtained from 15 sites for each of the three models and observations are depicted in Fig. 5. Each model provided characteristics related to the particle size distribution because the distribution curve estimated by each model exhibited a similar trend to that associated with the actual observations. The difference between the 20% particle size (D20) of three models Fig. 5: Composite of the particle size distribution curve at 15 sites by model estimations and observation. Green, blue, magenta, and black solid lines represent the P-model, D-model, B-model, and observation particle diameters, respectively.
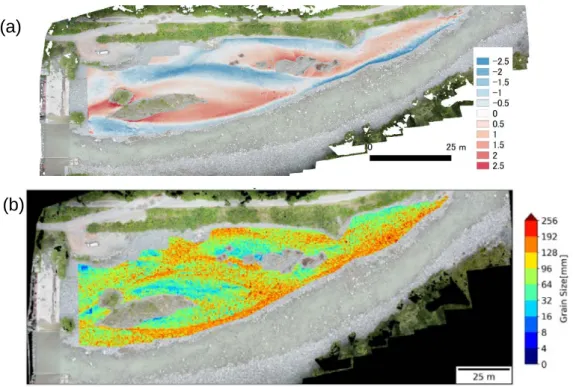
estimation and the actual observations was approximately 140%–330% of the observed D20, whereas that of the 80% particle size (D80) was approximately 10%–20%. The estimation accuracy of the large particles was higher than that of the small particles. Using these models, the particle size of the river bed gravel and sand was estimated over the entire study area. In this study, the spatial distribution of the particle size that is estimated using only the D-model, which provided the best accuracy among three models, is presented in Fig. 6 because of the page limit. The planted and water portions have been removed before being inputted into the model. The estimation of the particle diameter was affected by the terrain such as the differences in elevation and steepness. There are large gravel diameters (>128 mm) along the water course and the area of the low ZC
because large sediments would accumulate on the water course owing to large bed shear stress (Kuroda et al., 2005).
4 Conclusions
In this study, a model for estimating the particle size based on ANN has been proposed for orthophoto and DEMs obtained from the UAV photographs. The following is a brief summary of the conclusions:
・the ANN models proposed in this study was used to estimate the diameter of the river bed particles with a mean error of approximately −0.7 mm and a mean standard deviation of approximately 16.3 mm.
・the composite particle size distribution curve obtained using the ANN models exhibited a trend similar to that obtained using the actual observations;
Fig. 6: (a) Cross-sectional normalized elevation and (b) grain size estimated by D-model (a)
・the spatial distribution of particle sizes can be obtained using the ANN models. This represents the sediment classification tendency based on flow.
References
Abadi M, Barham P, Chen J, Chen Z, Davis A, Dean J, Devin M et al (2016) Tensorflow: a system for large-scale machine learning. In OSDI, 16:265-283
Akiyama, T (2012). Management of sedimentation and turbid water at the Asahi dam. Proc. Hydro, Session 17, pp 1-8.
Casado, M. R., Gonzalez, R. B., Kriechbaumer, T., Veal, A. (2015). Automated identification of river hydromorphological features using UAV high resolution aerial imagery. Sensors, 15(11), 27969– 27989.
Cholet, F. (2015). keras. https://kerasio
Erskine, W. D. (1985): Downstream geomorphic impacts of large dams: the case of Glenbawn Dam, NSW, Applied Geography, Vol. 5, pp. 195-210.
Fukuda, T., Yamashita, K., Osada, K., Fukuoka, S. (2012). Study on Flushing Mechanism of Dam Reservoir Sedimentation and Recovery of Riffle-Pool in Downstream Reach by a Flushing Bypass Tunnel. International Symposium on Dams for a Changing World, Kyoto, Japan. Iwahashi, J., Kamiya, I., Yamagishi, H. (2009): Estimation of the most suitable window size of the slope
gradient and convexo-concave index for the assessment of shallow landslides using high-resolution LiDAR DEM. Transactions, Japanese Geomorphological Union, 30-1, pp. 15-27. Kuroda, Y., Fukuoka, S., Yamamoto, T., Yoshida, K., Iuchi, T. (2005). Formation mechanism of gravel
bed rivers and its characteristics of grain size distribution. Advances in River Engineering, Vol. 11 (June 2005), 363–368.
Martín, E. J., Doering, M., Robinson, C. T. (2015). Ecological effects of sediment bypass tunnels. International Workshop on Sediment Bypass Tunnels, 147–156.
Palafox, L. F., Hamilton, C. W., Scheidt, S. P., Alvarez, A. M. (2017). Automated detection of geological landforms on Mars using Convolutional Neural Networks. Computers and Geosciences, 101(January), 48–56.
Pearson, E., Smith, M. W., Klaar, M. J., & Brown, L. E. (2017). Can high resolution 3D topographic surveys provide reliable grain size estimates in gravel bed rivers? Geomorphology, 293(May), 143–155.
Uda, T. (1993). Coastal Erosion in Japan. Summer conference on hydraulic engineering, 1 – B-3-20.
Authors
Daiki Takeuchi (corresponding Author) Satoru Nakanishi
River and Dam Hydraulic Research Team, Hydraulic Research Group, Public Works Research Institute (PWRI), Japan