Application studies of a simulated low density room-temperature IRFPA
Tzong-Sheng Lee a
Jin-ShownShie a
and Hung-Ti
Li ba
Institute
of Electro-Optical Engineering, National Chiao Tung University, Hsinchu, Taiwan.
b
Microsystems Laboratory, Industrial Technology Research Institute, Hsinchu, Taiwan
ABSTRACT
Recent developed thermal imagers using room-temperature IRFPA detectors have stimulated great opportunity in many commercial applications. This paper studies the possibility of using a low-density array detector for low-cost security-and-fire applications. Features on human body and plume were extracted by their infrared signatures. The human information was obtained from his spatial distribution, while a hazardous plume was supplemented with an additional temporal distribution.
The function of a smaller array ( 64x64) sensor was implemented by a high-resolution (320x240) commercial uncooled system through image downward re-sampling and pre-processing. Trade-off study between the recognition accuracy and the array size are also analyzed.
Keyword: Room-temperature 1RFPA, JR signature analysis, Security-and-fire application, Simulated low density JR image.
1. INTRODUCTION
The sensing technology for infrared radiation was confined to special purpose of military in the past. This because mostly applications of radiation sensing in middle or far infrared range are confidential, the related knowledge is difficult to collect. In additional, expensive infrared sensor and complicate mechanism for cooling lead it to rarely be utilized in popular. However, present-day technologies in semiconductor are mature enough to produce low-cost and high-sensitive device for uncooled operation. Therefore infrared systems have become to be used in many commercial applications.
Although an expensive thermal imager will be an old story in the near future, we still like to confirm our
application field to meet the needs in civil life. We believe that an IRFPA with moderate resolution operated in room-temperature will offer a considerable opportunities in lighting control and security-and-fire market, it can provide a low-cost but high performance product to distinguish between human and small animals indoors. In the following, we will describe a simulation way to evaluate the requirement of minimum resolution of a commercial thermal imager for recognizing indoor target, such as human, dog, and fire. An effective algorithm will also be presented to recognize these targets with different resolutions.2. LOW DENSITY IMAGE SIMULATION
The low density image produced by an imager can be achieved in two ways. The first method is to pick the sensing signal from system hardware with desired timing interval and reconstruct the signal to a new image. However, implementation on the reconstruction for good image quality is difficult. One has to trace the driving circuit of sensor which is usually not provided by the manufacturer. The other method is to take video signal from RS 170 port almost
supported by any imager, and then grab the signal with a real time image processor for re-sampling. The latter is very simple to implement without paying much effort, and was chosen for our study.
2.1 Target Image Acquisition
Were-samplethe output images from a thermal imager with high resolution in order to simulate the images taken from different kinds of low resolution one. As a result, target image size should be as larie as possible during image
taken procedure. Additionally, in order to satisf\ a requirement that the IR signature analysis for some specifled
targets has to he identified without loosing the original geometric characteristics, the height of thermal imager location
and the ie angle of it should be adjusted carefull\. In the allocation for taking the images, distance between target and imager must be able to let the derived image fall into the center of FOV and occupy I 2 screen. These approaches will promise IR imager with 320x240 EPA can take original images of optical resolution larger than 128x128 fbr each kinds of indoor targets, some example IR images like human, dog. and fire are shown in Fig. I.
4'
4'
a)
h)
Fig. I Original IR images for low density image simulation: a)adult. b)child, c)dog. d)fire.
2.2 ImageResembling and Pre-processing
We setup a square sampling window which is able to cover the whole target in a frame ofIRimagefor the output
original images from the high resolution IR imager. Then the sampling from regions inside this square is carried out for different resolutions, i.e., 64x64. 32x32, 16xl6, 8x8, and 4x4. I'hese five types of new images with low resolution,
as shown in Fig. 2. cover the same FOV with the original image. i.e., taken from a 320x240 FPA. in practical
applications.
Fig. 2 The different resolution images. a)64x64, b)32x32. c)16x16. d)8x8. e)4x4. re-sampling from sampling windo d)
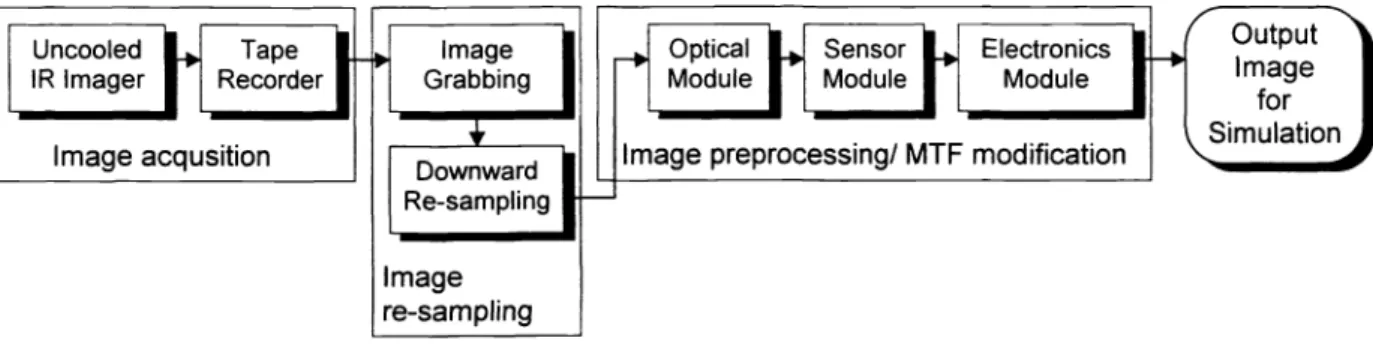
In other words, the IFOV become larger for each pixel with respect to the simulated low resolution FPA with 4x4 up to 64x64 pixels. As a result, the focal length of relative optical system has to be decreased for same detector size, and this factor leads to change of MTF of optical system. Besides, the MTF of sensor and electronics modules will also be changed. The image after re-sampling must be interacted with the new system MTF which is computed by cascading the MTF of each system module. The whole simulation procedure is shown in Fig. 3.
3.1 Auto-thresholding method
3. TARGET RECOGNITION
In order to reduce the demand for memory capacity and accelerate processing rate, binary representation of image is the first and necessary procedure in general, therefore fmd out threshold value will be very important. The histogram of gray level distribution usually exists a double peaks for an ordinary JR images. As shown in Fig. 4, the first peak is contributed by background, while the second is caused by target. As a result, theoretically, the threshold value can be defined at the minimum point between two peaks.
The histogram exhibits multi-peak due to the
decreased resolution of present images as shown in Fig. 5a., and Fig. 5b shows that contribution from some gray level even disappear at lower resolution. So this wellused method, valley between two peaks, for
auto-thresholding has to be slightly modified. From the Fig. 5a and 5b, we only need to figure out gray value for theminimum point exhibited right after the peak with
maximum value, i.e., the background usually. This gray value is so-called First Minimum Valley in Multi-peak after modified peak method (FMVM). Based on the experimental results, this method can be applied to JRimagers with any range of resolution. Fig. 3 The block diagram and procedure for low density image simulation
U) -cD
E
ci) ><0
Peak of backgroundOptimal threshold value
',
çsPeaof
target0
Gray level255
Fig. 5 The histogram will exhibitmulti-peak,especially in target region. due to the decreased resolution. the peaks number of the higher resolution a) is
less than those of lower resolution h).
3.2 Features extraction
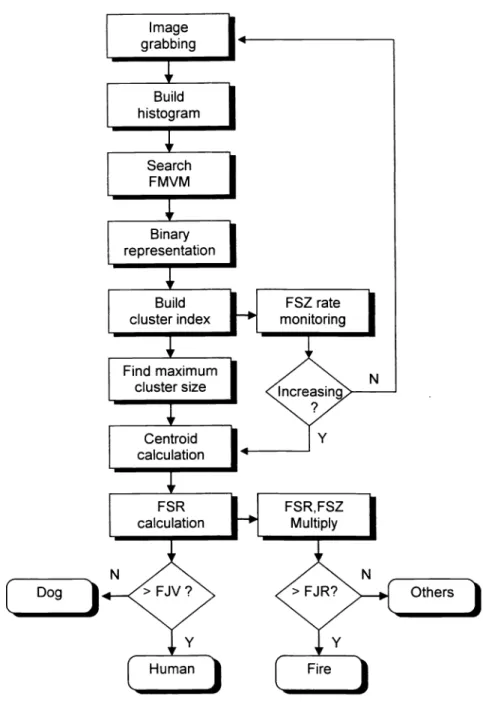
The binary images after processing of FMV auto-thresholding may produce several disconnected clusters which mean their relative image sizes. The biggest cluster is selected for proceeding the geometric characteristic analysis.
From the Fig. I, intuitivel. geometric ratio of morphology. like length to width, can he used to discriminate different targets, such as human and dog. For deriving this value, we only choose the coordinates of centroid of the cluster. i.e., the total number of relative pixel numbers in column and row, in order to reduce the CPU time. This value is called feature of shape ratio (FSR). We can set an appropriate feature judgment value (FJV) based on the experimental data. The targeted objects are able to be recognized from the value of FSR.
In the case of fire, FSR of fire is not only change with time, but the size of fire usually increases with time growth. Both of time and geometric factors must be considered together to reduce the false alarm ratio. If the variation rate of fire size in the recorded clusters become larger than some preset value, we can multiply the FSR of this cluster with current size (FSZ). the product is called effective size. Then the judgment can be made based on the variation rate of effective size (FiR) versus time. The flow chart of target recognition is shown in Fig. 6.
4. SYSTEM IMPLEMENTATION
The AMBER Sentinel thermal imager with room-temperature 320x240 microbolometer IRFPA is used to take IR images of human, dog. and fire in room. These images are recorded in video types for analysis. then the ICPCI image processor of Imaging Technology Inc. is used to do real time image grabbing via a computer program based on the above mentioned target recognition algorithms. Images of 373 frames of human beings. 127 frames of dogs. and 300 frames of fire taken in 5 minutes have been recorded and sampled to carry out the static geometry and time characteristic
analysis.
5. RESULTS AND DISCUSSION
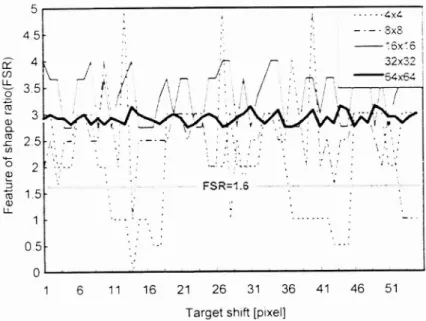
The distributions exhibit similar trends for different resolution, only location of the center of distributions shift slightly. It seems to us that human and dog can be recognized by discriminating the value ofFSR, ifthe FJV is fixed at 1.6. However, it is not really! The above simulation results are the results based on an assumption that target locate at the center of sampling window. The target will move inside the window practically. The average energy of that the edge of target fall onto detector will change when target is moving, this phenomena become more significant for images of low resolution. In the case that the target moves inside the sampling window, the variation of FSR will cause a lot of error for images taken by a sampling image resolution smaller than 8x8, as shown in Fig. 8. Therefore the recognition probability of a human body as a function of his JR image size then will be dominated by the uncertainty of the target motion, Fig. 9 shows the probability versus image resolution (nearly equal to target resolution), which probably exceed the result of Johnson's criteria, i.e. it requires only 4 pixels resolution to fit across the target for obtaining 50%
recognitionprobability.
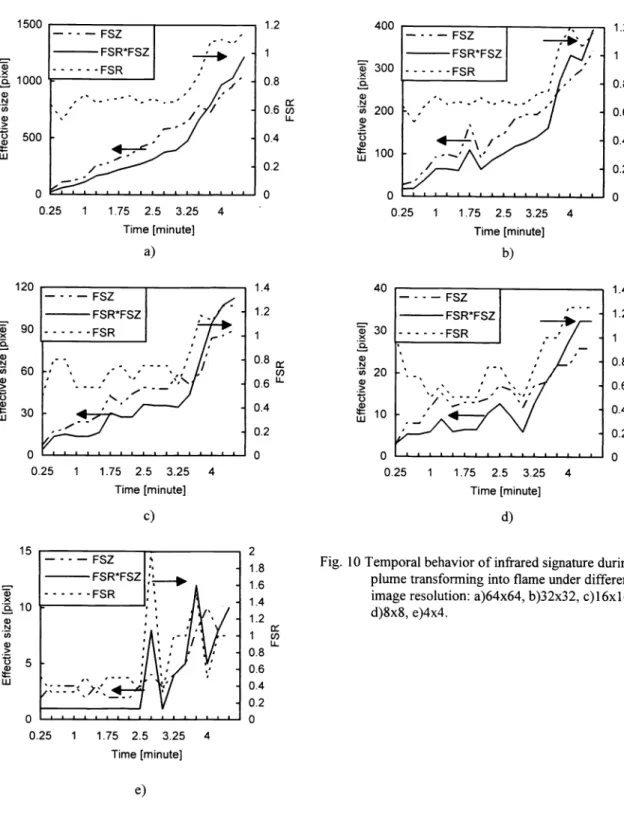
The curves of dependence of FSR and FSZ versus time for fire, as shown in Fig. 1 0, display strong difference among the results of different resolution. We can roughly identify the characteristics of image, say "isit fire, or not?", in only 30 sec from the multiplied curve of FSR and FSZ. Of curse, the exact value of time can only be set based on more image data of fire morphology.
Since the simulation for different distances can be represented via target images with different resolution, moreover the effect of atmosphere attenuation due to increased distance is able to be neglected in the case of indoor objects.
6. CONCLUSIONS
In this research we developed an auto-thresholding method and a simple effective recognition algorithm for spatial and temporal feature extraction. The indoor moving objects, such as human and dog, are successfully recognized, and the necessary specification of thermal imager is obtained for minimum resolution. Besides, the characteristics of fire morphology versus time change have been derived, these characteristics are different with the general solid target, i.e., human and dog, etc. These algorithm and rules can be incorporated into hardware easily, then they are able to be integrated into commercial thermal imaging system for markets only need moderate, or even low, resolution. The lighting control, fire monitor, and home security may be some of examples.
7.
ACKNOWLEDGMENTS
D0 ).
Fig. 7 The distributions of FSR for human and dog under different resolution: a)64x64, b)32x32, c)16x16, d)8x8, e)4x4. 40 35 30 C') 25 I) E 20 I-. 10 5 0
ii
0.2ji
j
j1j
,
.iLILIDog
•Human IIEI1IhLiLiL.t1. FSR a) Dog •Human I. .1 35 30 25 U) a) E 15 10 5 0 80 70 60 U) 50 E 40-
30 20 10 0 L.i.. i 4.2 5 5.8 0.2 1 1.8 2.6 3.4 FSR b) 45 40 35 30 U) a) 25I
20 15 10 5 0jIj1jifl 1iL1L1l
T a Dog[uman
I[t
.
Dog
Ii1IJ1iJdJdi
.
I
. Humani
0.2 1 1.8 2.6 3.4 4.2 5 5.8 FSR c) 200 0.2 1 1.8 2.6 3.4 FSR d) 4.2 5 5.8 150i 100
50 0[bog
ILtiLhI
0.2 11.8 2.6
3.4 4.2 5 5.8 FSR e)U) LL
0
Co a)0
Co -c C,) 0 Co a) U-5 -4x4 45 —-—-SxSi; '
(\T
I
/[
3I
25
-
— —-- I 2 -15 FSR=t6 1 6 11 16 21 26 3136 41
46 51
Target shift [pixel]Fig. 8The variation of FSR due to target shift in the sampling window.
09 08 0.7 06 05
a- 04
03 0,2 01 0Image resolution [pixel]
Fig. 9Recognition probability of a human body as a function of resolution of simulated image
4 40 30 1.2 400 1.2 1 300 0.8 0.8 N 0.6 LL 200 0.6 U) LL. > 0.4 0.4 100 0.2 0.2 0 0 0 0.25 1
1.75 2.5 3.25 4
Time [minute] b) 1.4 1.2 a) 0. U) U) U) U)> C-) 0.4 Lu 0.2 0 0.25 11.75 2.5 3.25 4
Time [minute] d)Fig. 10 Temporal behavior of infrared signature during plume transforming into flame under different image resolution: a)64x64, b)32x32, c)16x16, d)8x8, e)4x4. 1500 U) >( 0. 1000 U) N Cl) U) >