行政院國家科學委員會專題研究計畫 成果報告
平衡木體操選手著地時下肢動力學分析
計畫類別: 個別型計畫 計畫編號: NSC93-2213-E-039-001- 執行期間: 93 年 08 月 01 日至 94 年 07 月 31 日 執行單位: 中國醫藥大學運動醫學系 計畫主持人: 張怡雯 共同主持人: 許弘昌,張文正,王苓華 計畫參與人員: 吳俊毅 報告類型: 精簡報告 處理方式: 本計畫可公開查詢中 華 民 國 94 年 10 月 31 日
行政院國家科學委員會補助專題研究計畫
■ 成 果 報 告
□期中進度報告
平衡木體操選手著地時下肢動力學分析
計畫類別:■ 個別型計畫
□ 整合型計畫
計畫編號:NSC93-2213-E-039-001-
執行期間:
93 年
08 月
01 日至
94 年
07 月
31 日
計畫主持人:張怡雯
共同主持人:王苓華、張文正、許弘昌
計畫參與人員:吳俊毅
成果報告類型(依經費核定清單規定繳交):■精簡報告
□完整報告
本成果報告包括以下應繳交之附件:
□赴國外出差或研習心得報告一份
□赴大陸地區出差或研習心得報告一份
□出席國際學術會議心得報告及發表之論文各一份
□國際合作研究計畫國外研究報告書一份
處理方式:除產學合作研究計畫、提升產業技術及人才培育研究計畫、
列管計畫及下列情形者外,得立即公開查詢
□涉及專利或其他智慧財產權,□一年□二年後可公開查詢
執行單位:中國醫藥大學運動醫學系
中
華
民
國
94 年
10 月
30 日
中文摘要
體操選手由於受傷而更改或修正他們的訓練佔總選手數的 29%,對於一般業餘選手而 言,受傷率為每年每一百位選手為 0.1 到 4.2 位,對於專業競技體操選手而言,每一百個訓 練小時受傷率為 1 到 3.66 位,或每年每一百位選手有 65 位到 200 位選手受傷,對男性體 操選手而言,每年每一百位選手有 9.3 至 204 位選手受傷。隨著技巧的增加,受傷機率亦 隨之增加。如此高的受傷率,一般相信與體操本身為高衝擊性動作有關。雖然有一些文獻 是分析跳躍著地的動作與體操的運動,但卻少有研究探討體操動作之三維動力學分析,特 別是關於著地時的下肢關節衝擊力與力矩,因此,本實驗目的為(1)建立下肢三維模型以便 能夠計算著地動作時的下肢運動學 (2)探討體操平衡木選手著地時下肢的關節力量及力矩 (3)比較未曾受傷體操選手與曾踝關節扭傷過之選手,平衡木著地時關節動力學的差異。受 試者將為大專或高中女性體操選手共 14 名受試者,利用 Vicon 動作分析系統,擷取下肢膚 貼標記位置,以計算關節動作角度,並利用反動力學之方法,計算由平衡木著地時,下肢 各關節的力量及力矩。結果顯示,踝關節不穩定選手有較高之地面衝擊力、髖關節及踝關 節力量、與下肢關節力矩。經由了解平衡木著地時的關節衝擊負荷,更可了解平衡木體操 選手下肢受傷之可能機轉,並能提供體操教練及運動傷害防護員訓練選手時的準則。Abstracts
Gymnasts spend 29%of each season modifying their training as a result of injuries. The risk for injury in recreational gymnastics is 0.1 to 4.2 per 100 gymnastics per year. For
competitive women’s gymnastics, injury rates range from less than 1 to 3.66 per 100 training hours, or 65 to 200 per 100 gymnastics per year. In competitive men’s gymnastics the rate of injury ranges from 9.3 to 204 per 100 gymnastics per year. Risk of injury increases with
increasing skill level. The high injury incidence is believed to be correlated with the high impact activities of gymnastics. Although there were many researches regarding to the landing and gymnastic performance, there were very little studies about the three-dimensional kinetic analysis of gymnastic performance, especially the joint impact during landing. Because of the high injury rate in the balance beam, the purposes of this study will be (1) to develop a three-dimensional model of the lower extremity capable of describing the motion of lower extremity during landings (2) to investigate the joint loads in lower extremity when performing dismount from the balance beam (3) to compare the joint forces and moments of lower extremity during the dismount from the balance beam between the normal subjects and the subjects with functional instability. With the understanding of the kinetics of lower extremity during the dismount form balance beam, the possible injury mechanism of lower extremity of the gymnasts may be revealed and the additional training guideline may be provided for the coaches and athletic trainer. The subjects were 14 female gymnasts, the school representatives in the colleges or the high schools. Vicon motion analysis system was used to capture the markers’trajectories in lower extremity. The inverse dynamics approach was used to derive the joint force and joint moment in the lower extremity during landing movement. The significant findings in this study revealed that normalized ground reaction force (NF1) was 1.5 times of body weight for the uninjured gymnasts but 2.21 times of body weight for the injured gymnasts. Also, the normalized ground reaction impulse for 70 msec was 0.98 BW*ms for the uninjured gymnastrs but 1.27 BW*ms for the injured gymnasts. The
normalized ground reaction impulse for 100 msec was 1.48 BW*ms for the uninjured gymnastrs but 1.77 BW*ms for the injured gymnasts. The high impact of landing from balance beam for lower extremity was substantial, especially for the unstable ankle. With the understanding of the kinetics in lower extremity during the dismount form balance beam, the possible injury
mechanism of lower extremity of the gymnasts may be revealed and the additional training guideline may be provided for the coaches and athletic trainer.
Introduction
Gymnastics has grown dramatically in popularity and in numbers of participants over the past several years. The competition has changed the sport so that more difficult maneuvers have let to an increase in acute injuries, and longer training hours have let to an increase in chronic or overuse injuries. Although most experts who have studied gymnastic injuries have noted increase in the injury rate of gymnasts at any level who train more than 15 hours per week, almost all gymnasts train from 4.5 to 5 hours per day, 5 to 6 days per week. This is necessary to develop the skill required at higher levels (McQueen, 1999).
In gymnastics, landings after an acrobatic exercise are common tasks of daily training. During landings, the reaction forces reach values greater than 10 times body weight (McNitt-Gray, 1991). This is much higher than those occurring while running (2.6-3.7 times body weight when running at velocities between 2.5 and 6.5 m/s) as reported by Arampatzis (1999). Statistical data show that, in gymnastics, most (50-70%) of the actute injuries occur at the foot and the tibiotalar and knee joints. In the literature, it is often stated that an excessive eversion at tibiotalar joint could lead to overload and injury at the foot and the knee (Hintermann, 1998; Mcclay, 1997). Also a few observed the relative motion of the midfoot or the forefoot in relation to the rearfoot (Leardini, 1999). More recent studies (Stacoff, 2000) mentioned that, for the understanding of orthotic effects, midfoot and forefoot movements may be more important than those of the calcaneus.
Rehabilitation of the gymnast’s knee offers many challenges (Longacre, 1995). In very few sports are loads so great on the knee. The gymnastic rounine incorporates extreme twisting, impact loading and explosive muscular contraction every few seconds. The length of the time spent practicing is much greater than for other sports. Multiple authors have documented the relationship between the length of time spent in the gym on a specific apparatus and knee injury. Most injuries tend to occur between 30 minutes to 1 hour and 30 minutes into the workout and after 20 minutes on a single event (Linder, 1982; Weiker, 1985). Also, which gymnastics routines tend to produce the greatest numbers of injuries has been studies. The floor exercise and balance beam are the top two. Andrish (1985) found 170 injuries related to gymnastics, of which 60% were related to the extensor mechanism and 17.6% related to ligament sprains of the knee.
Since the injuries of ankle and knee are commonly found in the gymnasts, one of the possible factors which lead to these injuries is the high level of joint impact loading in lower extremity during performing the gymnastics (Longacre, 1995). However, very little researches regarding to the three-dimensional kinetics of gymnastics during landing were studied. Because
of the high injury rate in the balance beam, the purposes of this study were (1) to develop a three-dimensional model of the lower extremity capable of describing the motion of lower extremity during landings (2) to investigate the joint loads in lower extremity when performing dismount from the balance beam (3) to compare the joint forces and moments of lower extremity during the dismount from the balance beam between the normal subjects and the subjects with functional instability. With the understanding of the kinetics of lower extremity during the dismount form balance beam, the possible injury mechanism of lower extremity of the gymnasts may be revealed and the additional training guideline may be provided for the coaches and athletic trainer. The specific aim was to estimate the intersegmental joint moments and joint forces of the lower extremity during the dismount from balance beam. Also, the spatial-temporal parameters of landing were calculated during the dismount from balance beam.
Reviews
Kinematics of Gymnastics
Takei (1997) identifed the differences in the tucked and extended body positions, and in the spatiotemporal characteristics of the motion of the centre of mass, during the performance of kickout and non-kickout double salto backward tucked dismounts. A 16-mm camera, operating at 100 Hz, was used to record double salto backward tucked dismounts during the 1990 national championships in Japan and the USA. A high-scoring kickout group (n = 24) had a significantly (P < 0.005) higher body centre of mass at the tightest tuck position in the first salto, and shorter time to achieve maximum body extension during the second salto, than did a low-scoring
non-kickout group (n = 24). Furthermore, the kickout group showed greater height of body centre of mass, larger normalized moment of inertia, and smaller body angle from the vertical at
maximum body extension. Consequently, they had longer duration and larger distances of flight than the non-kickout group in which to display the maximum body extension before landing on the mat. It was concluded that the kickout double salto backward tucked dismount is indeed more effective than the non-kickout dismount because it involves (a) greater body extension in an inverted position before passing through the vertical and (b) greater heights of centre of mass at the peak of flight, at the tightest tuck and at maximum body extension. Furthermore, this dismount enhances the display of virtuosity for which bonus points are awarded. The results suggest that this kickout dismount may be helpful in developing the mechanical foundation necessary for learning more advanced dismounts, such as the triple salto backward tucked and double salto backward stretched, with increased effectiveness and safety.
McNitt-Gray (2001) determined how diverse momentum conditions and anatomical orientation at contact influences mechanical loading and multijoint control of the reaction force during landings. Male collegiate gymnasts (n=6) performed competition style landings (n=3) of drop jumps, front saltos, and back saltos from a platform (0.72 m) onto landing mats (0.12 m). Kinematics (200 fps), reaction forces (800 Hz) and muscle activation patterns (surface EMG, 1600 Hz) of seven lower extremity muscles were collected simultaneously. Between-task differences in segment orientation relative to the reaction force contributed to significant between-task differences in knee and hip net joint moments (NJM) during the impact phase.
During the stabilization phase, ankle, knee, and hip NJMs acted to control joint flexion.
Between-task differences in muscle activation patterns indicated that gymnasts scaled biarticular muscle activation to accommodate for between-task differences in NJM after contact. Activation of muscles on both sides of the joint suggests that impedance like control was used to stabilize the joints and satisfy the mechanical demand imposed on the lower extremity. Between-subject differences in the set of muscles used to control total body center of mass (TBCM) trajectory and achieve lower extremity NJMs suggests that control of multijoint movements involving impact needs to incorporate mechanical objectives at both the total body and local level. The functional consequences of such a control structure may prove to be an asset to gymnasts, particularly when required to perform a variety of landing tasks under a variety of environmental constraints.
Joint Strength of Gymnasts
Russell (1995) established the profile of knee dynamic concentric strength in elite male gymnasts after it was found that three of the 10-member Canadian men's gymnastics team had incurred anterior cruciate ligament (ACL) rupture. The dynamic concentric force characteristics of the quadriceps and hamstring muscles of 84 male gymnasts were studied at the Canadian National Championships using a Kin-Com isokinetic dynamometer. These tests were performed at 90 degrees/sec and 230 degrees/sec and revealed that the hamstrings to quadriceps peak torque ratio was not only unusually low (0.5) when compared with data collected in previous research, but that this ratio was consistent across all ages, from 12 to 27 years. The torque ratios were also reported at 30 degrees, 45 degrees, and 60 degrees and it was found that the ratios decreased as the joint angle increased and again was consistent across the four age groups. It was also found that the hamstrings to quadriceps peak torque ratio did not increase (hamstrings becoming stronger relative to quadriceps) as velocity of movement increased as has been reported in other studies. It was hypothesized that the large shear forces that are generated about the knee in gymnastics (extrinsically from backward landing and intrinsically from the quadriceps
eccentrically contracting), combined with the relatively weak hamstrings, could be one cause for the increasing incidence of ACL injuries in that sport. The results of this study indicate that it would be prudent for clinicians involved with gymnasts to test for knee strength imbalance and to prescribe exercises to correct it when necessary.
Proprioception for Gymnasts
If ankle proprioception can be determined to be impaired, then treatment can be more specifically directed toward correcting the proprioceptive deficit, thereby improving functional ability. Forkin (1996) determined if collegiate level gymnasts with unilateral, multiple ankle sprains (ie., chronic ankle sprains) had decreased ability to detect passive plantar flexion of the ankle (ie., decreased ankle proprioception) and to determine if balance deficits existed during one-legged stance. Eleven gymnasts participated in 30 passive movement trials (15 movement and 15 nonmovement) presented randomly on both the injured and noninjured sides. The nonmovement trials consisted of either no movement of the ankle or passive movement of the ankle into 5 degrees of plantar flexion. Luce's choice theory determined that subjects were not biased in responding to a "yes" in perceiving movement or no movement during the
movement during movement trials with their uninjured ankles than their injured ankles. Subjects also performed single 30-second trials of one-legged standing on each leg, with eyes open and with eyes closed. Subjects reported better balance when standing on the uninjured ankle during the one-legged stance conditions. Although our results cannot be extrapolated to balance abilities during complex gymnastic routines, they do suggest that physical therapy assessment includes passive detection of joint position as well as single-legged stance tests, and that perhaps rehabilitation programs incorporate sports-specific balance activities for such injuries.
Balance Beam in Gymnastics
Selder (1979) gave Knowledge of performance (KP) using video-tape replay (VTR) was given to a group of girls aged 12--13, n = 8, learning to perform a beginning balance beam routine. A control group (n =8) was taught utilizing conventional information feedback.
Performance was assessed by three U.S. Federation Gymnastic judges after four weeks and again after six weeks. All S's in the experimental group were judged to be at the associative learning stage. The data were analyzed using a mixed repeated measures design with one between and one within subjects variables. A significant treatment effect (F = 48.7, alpha less than or equal to .01) and treatment by group interaction (F = 19.21, alpha less than or equal to .01) resulted. The experimental group was responsible for the bulk of the significance and it was therefore concluded the KP via VTP for S's in the associative learning stage was beneficial.
Winfrey et al. (1993) assessed the effect of self-modeling on self-efficacy and performance of balance beam routines. Subjects were intermediate-level female gymnasts who were randomly assigned to one of two groups, a self-modeling or a control group. For the self-modeling group, self-modeling videotapes were made of each subject performing her balance beam routine. During a 6-wk. period, self-modeling group subjects viewed the videotape of themselves three times a week prior to practice. During this time, the control group and self-modeling group participated in their normal instructional program. All subjects completed self-efficacy
inventories and balance beam skill tests at four intervals, a pretest, a 2-wk. test, a 4-wk. test, and a6-wk. posttest. Although no significant differences in ratings of self-efficacy or balance beam performance between the groups were found, the correlation between subjects' self-rated
performance scores and actual performance scores for the self-modeling group was significant (r = .92). This correlation was not significant for the control group (r = .02). This significant correlation suggests that self-modeling may enhance performers' ability to assess their own performance realistically, improving their understanding and use of instructional feedback to enhance performance.
Contrary to a strict specificity of learning position, Robertson (1994) have reported that the balance beam performance of expert gymnasts is less affected by the withdrawal of vision than is the performance of novice gymnasts. Robertson (1996) employed a training paradigm in order to exercise complete control over the sensory conditions under which a dynamic balance beam task was acquired. Novice participants were trained either with or without vision to walk across a balance beam as quickly as possible and later tested in the other vision condition. Although participants improved more in the condition in which they trained, practice in one sensory
condition did not negatively affect performance in a different sensory circumstance. The finding that vision was still extremely important after 5 days of practice is problematic for models of motor learning that propose a progression with learning from closed-loop to open-loop control.
Marin (1999) considered the interacting effects of expertise in gymnastics, the type of support surface and the required frequency of head movement on the emergence of postural modes of coordination. A group of elite female gymnasts and a control group of non-gymnasts were asked to track the fore-aft motion of a target with their heads. Two support surface
conditions (a balance beam vs the floor) were crossed with four frequencies of target motion. The relative phase between the angular motion of the ankles and hips was analysed. Two stable pattern semerged: an in-phase mode and an anti-phase mode, with the hip-ankle relative phase close to 0 degrees and 180 degrees, respectively. Increasing target frequency produced a change from in-phase to anti-phase coordination, in conditions where no instructions were given to the participants (Experiment1) as well as in those where participants were instructed to maintain an in-phase mode for as long as possible (Experiment 2). This change, however, occurred earlier for the non-gymnasts than for the gymnasts. We conclude that0 degrees and 180 degrees are two stable postural coordination modes, that expertise in gymnastics leads to a functional
modification of existing patterns of coordination, and that expertise in general can be considered an intrinsic constraint on coordination.
Methods
The joint movement and joint impact loading during landing from the balance beam for the gymnasts were estimated with motion analysis system in this study. The purpose of the data collection for the three-dimensional motion is threefold: the data were used for the calculation of joint kinematics, the center of gravity of the whole body as well as the input for the inverse kinetic model. Therefore, a set of nineteen reflective markers were placed on selected anatomic
landmarks bilaterally in the lower extremities on each subject in order to estimate the movements of segments. The selected anatomic landmarks include: bilateral anterior superior iliac spine, lateral thigh, medial and lateral epicondyles of femur, lateral shank, medial and lateral malleolus, calcaneus, base of second metatarsal bone, and sacrum.
Joint Kinematics
In this section the procedures that will be applied in the kinematic analysis are described. Part of these outputs are necessary to obtain suitable input variables for the simulation model of the lower limbs. The simulation model of the lower extremities need seven input coordinates that describe the orientation of the full lower extremities. There are seven coordinate systems in this project, including the pelvis coordinate system, bilateral thigh coordinate systems, shank coordinate systems and foot coordinate system. Based on the position data, the rotation matrix that define the orientation of the local coordinate systems of foot, shank, thigh and pelvis with respect to the global coordinate system can be computed (Hang, 1992).
these above coordinate systems. The orientation of a distal segment coordinate system relative to a proximal segment coordinate system is used to describe the joint movement with the following equation: d T p p/d R R R where p/d
R is the rotation matrix of joint movements in the global coordinate system and
p
R and Rd are the rotation matrices of the proximal and distal segments. Symbol Tmeans the
matrix transposition. The thigh coordinate system relative to the pelvis coordinate system is used to describe the movement of the hip joint. The shank coordinate system relative to thigh coordinate system is used to describe the movement of the knee joint. The foot coordinate system relative to shank coordinate system is used to describe the movement of the ankle joint.
To systematically describe the joint movements, the joint reference position is defined as the joint position that exists when the body is in the anatomical position. The rotation of joint movements is then modified as:
T j o d p R R R / ( )
whereR is the rotation matrix of joint movements based on the anatomical position and oRj is
the rotation matrix of the anatomical position in the global coordinate system.
The joint rotations will subsequently be decomposed from the rotation matrices to Euler angles along with global or local axes. In general the order y-x'-z'' will be used. Euler angles are used to describe the orientation of a distal segment reference frame relative to a proximal segment reference frame (Haug 1992, An et. al., 1984). The first rotation about the y axis represents the flexion/extension angle (). The second rotation about the x' axis represents the adduction/abduction or side bending angle (). The third rotation about the z" axis represents segmental axial rotation (). The transformation matrix of the distal segment reference frame relative to the proximal segment reference frame is:
C C S S C S C S S S S C S C C S C C S S C C S S C C S S S ij z yx R 3 3 ) , , (The three Euler angles of the distal segment reference frame relative to the proximal segment reference frame are calculated using the following equations:
A A C C A C C tan tan tan 2 2 2 23 13 2 33 2 13 33 21 23 ( ) ( , ) ( , ) ,
where C denotes cosine and S denotes sine. Atan2 is used to extract these rotation angles. Atan2(y, x) computes tan ( / )1 y x but uses the signs of both x and y to determine the quadrant in which the resulting angle lies. It is sometimes called a "4-quadrant arc tangent."
The three-dimensional trajectories of the reflective markers will be smoothed using a generalized cross-validation spline smoothing (GCVSPL) routine (Woltring, 1986) at a cutoff frequency of 6 Hz (Winter et al., 1974). The three-dimensional trajectory of the center of gravity and the Euler angles of each segment will be calculated from the smoothed three-dimensional position data of the markers. The time derivatives of the three-dimensional center of gravity data and the Euler parameters will also be calculated using the GCVSPL routine.
Joint kinetics
When the segment kinematics, the ground reaction forces and moments, and the inertial parameters are available, the three-dimensional net joint resultant loads can be estimated. For this we will use the standard Newton-Euler equations, based on the assumption of free-body diagrams (Hang, 1992). ] [ m pl pl dl dl dl l pl wl dl l pl F r F r M I I M F F a F
In this section the procedures that will be applied in the kinetic analysis are described. The free body diagram shows that there are four segments (foot, shank, thigh, and pelvis), in each lower limb that needs to be analyzed. Equations need to be written for each segment to determine the kinetics. However, it can be seen that each segment has an applied three-dimensional moment and force acting at the proximal and distal aspect of the segment, and a gravitational force acting through a center of mass. The distal force acting on the segments happen to act through the distal joint. Recognizing the similarity in each segment, it is possible to write a general procedure to apply to each segment in determining the kinetics. The procedures for determining the lower extremity kinetics are described:
- Determine the 3D location of the segmental COG (center of gravity) = proximal joint+ (distal joint-proximal joint)(% segment length)
- Determine the segmental COG acceleration in global system (a )G
- Determine COG to proximal joint center vector in global system (rpG)
- Determine COG to distal joint center vector in global system (r )dG
- Determine local coordinate system and orientation matrix
- Rotate COG to proximal joint vector to segmental system (rpl) - Rotate COG to distal joint vector to segmental system (r )dl - Rotate distal forces into segmental system (F )dl
- Rotate distal moments into segmental system (M )dl - Rotate weight vector (mg) into segment system (F )wl - Rotate COG acceleration into segment system (a )l
- Determine the proximal joint resultant forces (Fpl) in the segmental system.
- Determine the proximal joint resultant moments (Mpl) in the segmental system.
The net joint power is related to the type of muscle contraction. It also quantifies the net rate of generating or absorbing energy by all muscles crossing a joint. Net joint power can be calculated as the product of joint moment and angular velocity based on the segmental coordinate system or global coordinate system.
or pG G l pl M M Power
Experimental Protocol
Fourteen female subjects were recruited for this study. The gymnasts who actively participate in gymnastic training of the balance beam at least one year were recognized as qualified subjects. Gymnasts with acute injury were excluded in this study. The subjects of this study were recruited from the school representatives of gymnastic tem in high schools and colleges in Taichung areas. Seven subjects had ankle inversion sprain before, below grade II, at least one year ago. This is defined as the functional instability group. On the other hand, the other healthy subjects were defined as control group.
A written consent form was signed by each participant before any testing starts. After having obtained the subjects' informed consent, the necessary anthropometrical and clinical information will be collected. The inertia values will be obtained from the information based on the works by Yokoi in 1986 and de Leva in 1996. The subjects were first asked to stand still at the anatomical neutral position to provide the reference frame for all the movements. Vicon motion analysis system and the force plates were synchronously used. The dismount from the balance beam was completed with the way the gymnast generally uses in her routine training. The dismount approach was chosen as salto forward tucked since this technique is one of the most frequently used dismount way in the balance beam. Five useful repetitions for each movement were collected for each subject in this study.
The experimental data of this project were collected in the biomechanics laboratory, the School of Sports Medicine, China Medical University, Taichung. VICON Motion Analysis System with 6 cameras and the associated software with sampling frequency of 250 Hz were used to record the trajectories of the reflective markers attached on the specific landmarks of the body.
Three force platform (Kistler, Amhurst, NT, USA) with the sampling frequency of 1000 Hz were used to collect the data of ground reaction forces and moments in order to estimate the joint loading.
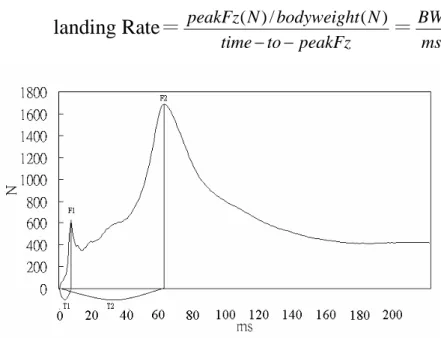
Data Analysis
There were three kind of biomechanical parameters were analyzed in this study, including ground reaction parameters, kinematics parameters, and kinetic parameters. There were also six parameters in ground reaction parameters: T1, T2, NF1, NF2, impulses (NI50, NI70 and NI100), and landing rate (Fig 1). T1 was defined as the duration from landing to the first peak ground reaction force production. T2 was defined as the duration from landing to the second peak ground reaction force production. NF1 was defined as the first peak ground reaction force normalized by the body weight. NF2 was defined as the second peak ground reaction force normalized by the body weight. NI50 was defined as the summation of impulses with the duration of 50 msec from landing. NI70 was defined as the summation of impulses with the duration of 70 msec from landing. NI100 was defined as the summation of impulses with the duration of 100 msec from landing. The landing rate (LR) was defined as the increasing rate of ground reaction force. LR1 was LR within the duration of landing to the first peak ground reaction force. LR2 was LR within the duration of landing to the second peak ground reaction force.
landing Rate=
peakFz to time N bodyweight N peakFz ) ( / ) (=
ms BWIndependent t test was used to test the difference between the instability and control groups. In this model, the biomechanical parameters, such as the joint movements, joint forces and joint moments were the dependent variables. The shock of the dismount from the balance beam were revealed and the landing strategy can be evaluated in this study. The significance level of statistical analysis was set as 0.5.
Results
T1 & T2The averaged T1 values were 10.57 ± 4.13 msec and 12.75 ± 2.97 msec for the control group and functional instability group, respectively. The averaged T2 values were 51.04 ± 13.20 msec and 58.46 ± 11.79 msec for the control group and functional instability group, respectively. No significant difference was found on the T1 and T2 values between the functional instability and control groups (Fig 2).
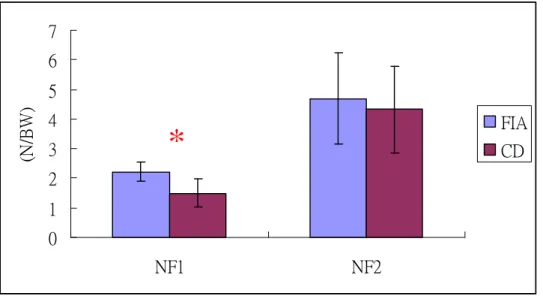
NF1 & NF2
The averaged NF1 values were 1.50 ± 0.48 BW (body weight) and 2.21 ± 0.32 BW for the control group and functional instability group, respectively. The averaged NF2 values were 4.32 ± 1.46 BW and 4.69 ± 1.54 BW for the control group and functional instability group, respectively. Significant difference was found on NF1 between the functional instability and control groups (p<0.05). However, no significance was found on NF2 (Fig 3).
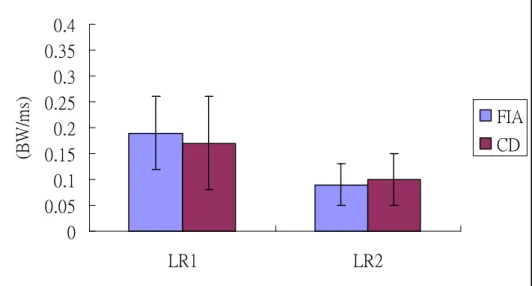
LR1 & LR2
The averaged LR1 values were 0.17 ± 0.09 BW/msec and 0.19 ± 0.07 BW/msec for the control group and functional instability group, respectively. The averaged LR2 values were 0.10 ± 0.05 BW/msec and 0.09 ± 0.04 BW/msec for the control group and functional instability group, respectively. No significant difference was found on the LR1 and LR2 values between the functional instability and control groups (Fig 4).
NI50, NI70 & NI100
The averaged NI50 values were 0.63 ± 0.15 BW*msec and 0.74 ± 0.08 BW*msec for the control group and functional instability group, respectively. The averaged NI70 values were 0.98 ± 0.17 BW*msec and 1.27 ± 0.18 BW*msec for the control group and functional instability group, respectively. The averaged NI100 values were 1.48 ± 0.11 BW*msec and 1.77 ± 0.19 BW*msec for the control group and functional instability group, respectively. No significant difference was found on the NI50 between the functional instability and control groups (Fig 5). However, significant difference was found on NI70 and NI100 between the functional instability and control groups (p<0.05).
Joint Kinematics
Joint kinematics in lower extremity during landing from balance beam was shown in Fig6 . No significant difference was found on the joint kinematics in lower extremity during landing. Joint Kinetics
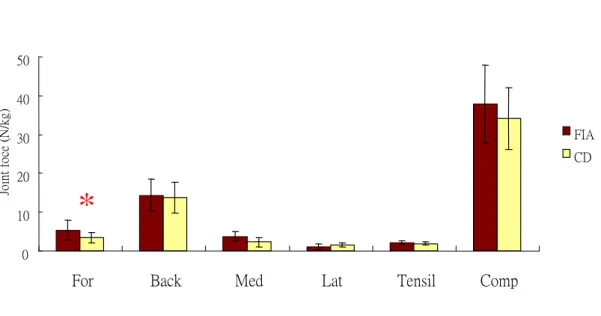
Figs 7–9. Significant difference was found on the forward force in hip joint and forward force in ankle joint between the functional instability and control groups (p<0.05). No significant difference was found in knee joint.
Joint moments in hip, knee and ankle joints during landing from balance beam was shown in Figs 10–12. Significant difference was found on the hip extensor moment, knee flexor moment and ankle plantar flexor moment between the functional instability and control groups (p<0.05).
Discussion
Gymnasts spend 29% of each season modifying their trainings, as a result of injuries. The risk for injury in recreational gymnastics is 0.1 to 4.2 per gymnasts per year. For competitive women’s gymnastics, injury rates range from less than 1 to 3.66 per 1000 training hours, or 65 to 200 per 100 gymnasts per year. The high injury incidence is believed to be correlated with the high impact activities of gymnastics. Prevention of gymnastic injury should be paramount in the minds of coaches, parents and physicians. Although it may be impossible to prevent accidental injury, proper equipment during difficult techniques should minimize accidental injuries. Chronic or overuse injuries, on the other hand, may be lessened by the understanding of the
biomechanical changes of the neuromusculoskeletal system during the performance of gymnastics. Although there were many researches regarding to the landing analysis and gymnastic performance, there were very little study about the kinetic analysis of gymnastic performance, especially the joint impact during landing. The significant findings in this study revealed that normalized ground reaction force (NF1) was 1.5 times of body weight for the uninjured gymnasts but 2.21 times of body weight for the injured gymnasts. Also, the normalized ground reaction impulse for 70 msec was 0.98 BW*ms for the uninjured gymnastrs but 1.27 BW*ms for the injured gymnasts. The normalized ground reaction impulse for 100 msec was 1.48 BW*ms for the uninjured gymnastrs but 1.77 BW*ms for the injured gymnasts. The high impact of landing from balance beam for lower extremity was substantial, especially for the unstable ankle.
The joint force and moment, therefore, were evaluated in this study during dismount from the balance beam in order to systematically understand how high impact in the lower extremity in balance beam of gymnastics. No significant change in joint kinematics of lower extremity during landing from balance beam. However, joint moments of hip extensor, knee flexor and ankle plantar flexor for the uninjured legs were greater than those for the injured legs. The increasing loading in these joint moments would increase the difficulty of stability during landing from balance beam.
Reference
Arampatzis A, Bruggemann GP, Metzler V. The effect of speed on leg stiffness and joint kinetics in human running. J Biomech32:1349-1353, 1999
determine the foot motion during landings. Medicine & Science in Sports & Exercise,34(1):130-138
DiFiori JP. Puffer JC. Aish B. Dorey F. Wrist pain in young gymnasts: frequency and effects upon training over 1 year. Clinical Journal of Sport Medicine. 12(6):348-53, 2002 Nov.
Fellander-Tsai L. Wredmark T. Injury incidence and cause in elite gymnasts. Archives of Orthopaedic & Trauma Surgery. 114(6):344-6, 1995.
Forkin DM. Koczur C. Battle R. Newton RA. Evaluation of kinesthetic deficits indicative of balance control in gymnasts with unilateral chronic ankle sprains. Journal of Orthopaedic & Sports Physical Therapy. 23(4):245-50, 1996 Apr.
Fritz M. Peikenkamp K. Simulation of the influence of sports surfaces on vertical ground reaction forces during landing. Medical & Biological Engineering & Computing. 41(1):11-7, 2003 Jan.
Hintermann B, Nigg BM. Pronation in running implications for injuries. Sports Med 26:169-176, 1998
Kovacs I. Tihanyi J. Devita P. Racz L. Barrier J. Hortobagyi T. Foot placement modifies kinematics and kinetics during drop jumping. Medicine & Science in Sports & Exercise. 31(5):708-16, 1999 May.
*Leardini A, Benedetti MG, Catani FL. Simoncini L, Giannini S. An anatomically based protocol for the description of foot segment kinematics during gait. Clinical Biomech, 14:528-536, 1999
Lindholm C. Hagenfeldt K. Ringertz H. Bone mineral content of young female former gymnasts. Acta Paediatrica. 84(10):1109-12, 1995 Oct.
Marin L. Bardy BG. Bootsma RJ. Level of gymnastic skill as an intrinsic constraint on postural coordination. Journal of Sports Sciences. 17(8):615-26, 1999 Aug.
Mcclay, I., and K. Manal. Coupling parameters in runners with normal and excessive pronation. J.Appl.Biomech. 13:109-124,1997
McNitt-Gray, J. L. Kinematics and impulse characteristics of drop landings form three heights. Int. J. Sport Biomech. 7:201-204,1991
McNitt-Gray JL. Kinetics of the lower extremities during drop landings from three heights. Journal of Biomechanics. 26(9):1037-46, 1993 Sep.
McNitt-Gray JL. Subject specific coordination of two- and one-joint muscles during landings suggests multiple control criteria.[comment]. Motor Control. 4(1):84-8; discussion 97-116, 2000 Jan. Comment on: Motor Control. 2000 Jan;4(1):1-44
McNitt-Gray JL. Hester DM. Mathiyakom W. Munkasy BA. Mechanical demand and multijoint control during landing depend on orientation of the body segments relative to the reaction force. Journal of Biomechanics. 34(11):1471-82, 2001 Nov.
Mitchell JC. Giannoudis PV. Millner PA. Smith RM. A rare fracture-dislocation of the hip in a gymnast and review of the literature. British Journal of Sports Medicine. 33(4):283-4, 1999 Aug.
Nigg BM. Bobbert M. On the potential of various approaches in load analysis to reduce the frequency of sports injuries. Journal of Biomechanics. 23 Suppl 1:3-12, 1990.
*Robertson S. Elliott D. Specificity of learning and dynamic balance. Research Quarterly for Exercise & Sport. 67(1):69-75, 1996 Mar.
Russell KW. Quinney HA. Hazlett CB. Hillis D. Knee muscle strength in elite male gymnasts. Journal of Orthopaedic & Sports Physical Therapy. 22(1):10-7, 1995 Jul.
Selder DJ. Del Rolan N. Knowledge of performance, skill level and performance on the balance beam. Canadian Journal of Applied Sport Sciences - Journal Canadien des Sciences
Appliquees au Sport. 4(3):226-9, 1979 Sep.
Self BP. Paine D. Ankle biomechanics during four landing techniques. Medicine & Science in Sports & Exercise. 33(8):1338-44, 2001 Aug.
Stacoff, A., C. Renschmidt, B. M. NIGG, etal. Effects of foot orthoses on skeletal motion during running. Clin. Biomech. 15:54-64,2000
Takei Y. Dunn JH. A 'kickout' double salto backward tucked dismount from the horizontal bar performed by elite gymnasts. Journal of Sports Sciences. 15(4):411-25, 1997 Aug.
Winfrey ML. Weeks DL. Effects of self-modeling on self-efficacy and balance beam performance. Perceptual & Motor Skills. 77(3 Pt 1):907-13, 1993 Dec.
0 10 20 30 40 50 60 70 80 T1 T2 (m s) FIA CD
Fig 2: T1 and T2 values for the functional instability group (FIA) and control group (CD)
0 1 2 3 4 5 6 7 NF1 NF2 (N /B W ) FIA CD
Fig 3: NF1 and NF2 values for the functional instability group (FIA) and control group (CD) [*: significant difference (p<0.05)]
0 0.05 0.1 0.15 0.2 0.25 0.3 0.35 0.4 LR1 LR2 (B W /m s) FIA CD
Fig 4: LR1 and LR2 values for the functional instability group (FIA) and control group (CD)
0 0.5 1 1.5 2 2.5
NI50 NI70 NI100
(B W * m s) FIA CD
Fig 5: NI50, NI70 and NI100 values for the functional instability group (FIA) and control group (CD) [*: significant difference (p<0.05)]
*
Fig 6: Range of motion for the functional instability group (FIA) and control group (CD) 0 10 20 30 40 50
For Back Med Lat Tensil Comp
Jo in t fo ce (N /k g) FIA CD 0 10 20 30 40 50
For Back Med Lat Tensil Comp
Jo in t fo ce (N /k g) FIA CD
Fig 7: Joint force in hip joint for the functional instability group (FIA) and control group (CD) [*: significant difference (p<0.05)] 0 20 40 60 80 100 120 140
HF/E HAB/AD HIR/ER KF/E AF/E AAB/AD AIR/ER
R an ge of m ot io n (。 ) FIA CD
*
0 10 20 30 40 50
For Back Med Lat Tensil Comp
Jo in t fo ce (N /k g) FIA CD 0 10 20 30 40 50
For Back Med Lat Tensil Comp
Jo in t fo ce (N /k g) FIA CD
Fig 8: Joint force in knee joint for the functional instability group (FIA) and control group (CD) [*: significant difference (p<0.05)] -10 0 10 20 30 40 50
For Back Med Lat Tensil Comp
Jo in t fo ce (N /k g) FIA CD -10 0 10 20 30 40 50
For Back Med Lat Tensil Comp
Jo in t fo ce (N /k g) FIA CD
Fig 9: Joint force in ankle joint for the functional instability group (FIA) and control group (CD) [*: significant difference (p<0.05)]
0 1 2 3 4 5 6 7 AD AB F E IR ER Jo in t m om en t (N -m /k g) FIA CD 0 1 2 3 4 5 6 7 AD AB F E IR ER Jo in t m om en t (N -m /k g) FIA CD
Fig 10: Joint moment in hip joint for the functional instability group (FIA) and control group (CD) [*: significant difference (p<0.05)] 0.0 0.5 1.0 1.5 2.0 2.5 3.0 3.5 4.0 4.5 5.0 AD AB F E IR ER Jo in t m om en t (N -m /k g) FIA CD 0.0 0.5 1.0 1.5 2.0 2.5 3.0 3.5 4.0 4.5 5.0 AD AB F E IR ER Jo in t m om en t (N -m /k g) FIA CD
Fig 11: Joint moment in knee joint for the functional instability group (FIA) and control group (CD) [*: significant difference (p<0.05)]
*
-0.5 0.0 0.5 1.0 1.5 2.0 2.5 3.0 Inv Env PF DF IR ER Jo in t m om en t (N -m /k g) FIA CD -0.5 0.0 0.5 1.0 1.5 2.0 2.5 3.0 Inv Env PF DF IR ER Jo in t m om en t (N -m /k g) FIA CD
Fig 12: Joint moment in ankle joint for the functional instability group (FIA) and control group (CD) [*: significant difference (p<0.05)]
![Fig 8: Joint force in knee joint for the functional instability group (FIA) and control group (CD) [*: significant difference (p<0.05)] -1001020304050](https://thumb-ap.123doks.com/thumbv2/9libinfo/8963388.277598/20.892.130.706.52.309/joint-force-joint-functional-instability-control-significant-difference.webp)
![Fig 10: Joint moment in hip joint for the functional instability group (FIA) and control group (CD) [*: significant difference (p<0.05)] 0.00.51.01.52.02.53.03.54.04.55.0 AD AB F E IR ERJointmoment(N-m/kg) FIACD0.00.51.01.52.02.53.03.54.04.55.0ADABFEIRE](https://thumb-ap.123doks.com/thumbv2/9libinfo/8963388.277598/21.892.120.737.61.339/joint-functional-instability-control-significant-difference-erjointmoment-adabfeire.webp)
![Fig 12: Joint moment in ankle joint for the functional instability group (FIA) and control group (CD) [*: significant difference (p<0.05)]](https://thumb-ap.123doks.com/thumbv2/9libinfo/8963388.277598/22.892.116.721.69.354/joint-moment-ankle-functional-instability-control-significant-difference.webp)
