國立高雄大學國際商業管理碩士學位學程
碩士論文
A Feasibility Study of Installing Piezoelectricity at Mass Rapid
Transport: The Case of Kaohsiung Arena Station
Juan David Duran Suarez
Advisors: Dr. Po-Chih Lee Department of Information Management
Dr. Chien-Hsing Wu
Department of Information Management
National University of Kaohsiung
International Master of Business and Administration Kaohsiung City, Taiwan
I
Acknowledgment
First of all, I want to express my gratitude to Professor Po-Chih Lee, as my teacher and advisor, he has taught me more than I could ever give him credit for here. I am indebted to him for all the support he provided me during my studies, his teachings and advice was invaluable in meeting my goals.
I would like to thank my friends Andres Mauricio and Jesus Alberto, they were very supportive in making the decision to come here to continue with my academic training, with their words and encouragement, they motivated me to take this great adventure in Taiwan.
I thank Katherine and David, who with their support have made my stay in Taiwan much more pleasant, thank you for being there. Also, all the staff from the Office of International Affairs for being an important support throughout these two years.
Nobody has been more important to me in the pursuit of this goal than my family. I would like to thank my parents, Juan and Marina, for their love and guidance, for being there in whatever I pursue. To my brother Eder and my sister Nataly for all the love and unconditional support. Last but not least, I want to thank my loving and supportive partner, Izabella, for her patience, support and inspiration.
II
A Feasibility Study of Installing Piezoelectricity at Mass Rapid
Transport: The Case of Kaohsiung Arena Station
Advisor: Dr. Po-Chih Lee
Department of Asia Industrial and Business Management National University of Kaohsiung
Advisor: Dr. Chien-Hsing Wu Department of Information Management
National University of Kaohsiung Student: Juan David Duran Suarez
International Master of Business and Administration National University of Kaohsiung
ABSTRACT
One of Taiwan's most important goals for the near future is to denuclearize the island, reduce its dependence on fossil fuels for the production of electrical energy, and increase the share of renewable energies by 2025.
To achieve this goal, it is important to look beyond conventional green energies (solar and wind energies), it is here where piezoelectric tiles have a big importance since it does not require large spaces to be installed and it works with footsteps to generate electrical energy, and its implementation will allow reducing greenhouse gas emissions.
The current study is a qualitative analysis and its purpose is to determine the feasibility of installing piezoelectricity in an MRT Station in Kaohsiung, Taiwan, it will be developed using SWOT analysis and PEST analysis. The analysis result will show that even if the technology is not feasible from the economic aspect, it brings another invaluable benefits to the island.
III
Table of Contents
List of Tables ... V List of Figures ... VI
Chapter One: Introduction ... 1
A. Background Information ... 1
B. Main Purpose of the Study ... 3
C. Research Procedure ... 4
Chapter Two: Literature Review ... 7
A. Taiwan Overview ... 7
1. Electricity in Taiwan ... 8
2. Gross Domestic Product in Taiwan ... 11
3. Gross Domestic Product, Energy and CO2 Emissions in Taiwan ... 14
B. Renewable Energies ... 19
1. Solar Energy ... 19
2. Wind Energy... 21
3. Non Pumped Storage Hydroelectric Power ... 23
4. Biomass ... 23
5. Waste ... 24
C. Non Renewable Energies ... 24
1. Coal, Gas, and Oil... 25
2. Nuclear Energy ... 26 D. Piezoelectricity ... 26 1. Applications ... 27 E. Research Methods ... 29 1. SWOT Analysis ... 29 2. PEST Analysis ... 31
Chapter Three: Research Method ... 32
A. Research Framework... 32
IV
Chapter Four: Major Findings ... 35
A. Introduction of Kaohsiung Arena MRT Station ... 35
B. Installation of Piezoelectricity ... 38
C. Replacement of Thermal Generation ... 42
D. Reduction of greenhouse gas emissions ... 49
E. Qualitative Analysis ... 50 1. Strengths ... 50 2. Weaknesses ... 50 3. Opportunities ... 51 4. Threats ... 51 5. Outline SWOT ... 52 F. PEST Analysis... 53 1. Political Factors ... 53 2. Economic Factors ... 54 3. Social Factors... 55 4. Technological Factors ... 56
Chapter Five: Concluding Remarks ... 58
A. Major Contributions ... 58
B. Major Suggestions ... 59
C. Limitations of the Study ... 59
D. Future Studies ... 60
Appendix ... 62
V
List of Tables
Table 1. Key Data of Taiwan 2019 ... 7
Table 2. Daily Ridership in 2018 (unit: 1000 person). (Kaohsiung Rapid Transport Corp., 2018)... 36
Table 3.Piezoelectric technology types (specifications, price, lifespan) (Solban, 2019) ... 40
Table 4. Piezoelectric technology types according to uses and features. (Elhalwagy, 2017) .... 40
Table 5. Cost and generation of electricity using Piezoelectric-Scenario 1. ... 46
Table 6. Electricity price thermal energy in Kaohsiung Arena MRT Station-Scenario 1. ... 46
Table 7. Electricity Saves using piezoelectric in Kaohsiung Arena MRT Station- Scenario 1.. 47
Table 8.Cost and generation of electricity using Piezoelectric-Scenario 2. ... 47
Table 9.Electricity Saves using piezoelectric in Kaohsiung Arena MRT Station- Scenario 2. . 48
Table 10.The unit cost of electric generation. ... 48
Table 11.Carbon emissions of one Pavegen tile. (Bekzhanova, 2019) ... 49
Table 12.SWOT Analysis. ... 52
VI
List of Figures
Figure 1. Flow Chart... 6
Figure 2.Energy Supply and Consumption in Taiwan. (Bureau of Energy, 2019) ... 8
Figure 3.Structure of Electricity Generation. (Bureau of Energy, 2019) ... 9
Figure 4.Electricity Generation by Fuel. (Bureau of Energy, 2019) ... 10
Figure 5.Structure of Electricity Consumption. (Bureau of Energy, 2019) ... 11
Figure 6.Taiwan Gross Domestic Product in the last decade. (Trading Economics, s.f.) ... 12
Figure 7.Taiwan Economic Grow Rates. (Source: Directorate-Generral of Budget, Accounting and Statistics) ... 13
Figure 8. Gross Domestic Product of Taiwan (2018). ... 13
Figure 9.Electricity Consumption, Real GDP, and Elasticity of Domestic Consumption. (Bureau of Energy, 2019) ... 14
Figure 10.Taiwan Electricity Consumption. (International Energy Agency, 2020) ... 15
Figure 11. Taiwan Total CO2 Emissions. (International Energy Agency, 2020) ... 16
Figure 12. CO2 Emissions by Sector (International Energy Agency, 2020) ... 17
Figure 13.CO2 Emissions by Energy Source. (International Energy Agency, 2020) ... 18
Figure 14. Photovoltaic Solar System. (EnergySage, 2019) ... 19
Figure 15.Typical System of Photovoltaic Solar Energy. (VasconcelosSampaio, 2017) ... 20
Figure 16.Wind Turbine System. (Blaabjerg, 2017) ... 21
Figure 17. Global Cumulative Wind Power. (Blaabjerg, 2017) ... 22
Figure 18.Operation of a Simple Piezoelectric. (Garimella, 2015) ... 27
Figure 19.Direct Piezoelectric Effect. (Yang, 2016) ... 29
Figure 20.SWOT/TOWS Matrix. (QuickMBA, n.d.) ... 30
Figure 21.Research Framework. ... 34
Figure 22.Average Daily Ridership in the months of 2018. (Kaohsiung Rapid Transport Corp., 2018)... 36
Figure 23.Kaohsiung Arena MRT Station Concourse Level Plan. (Kaohsiung Metro, 2020)... 37
VII
Figure 25. Pavegen Tiles in London. (Mashaleh, 2018) ... 41
Figure 26. Proposed Tiles Location. (Elhalwagy, 2017) ... 42
Figure 27.Pavegen working model. (Boby, 2014) ... 43
Figure 28. Location of the Tiles on each ticketing gate. ... 45
1
Chapter One: Introduction
A. Background Information
Nowadays, energy in each society is the heart of development. Without energy, communities live with continuous problems and it makes life tougher for those communities, essential services such as clinics, street lighting, and schools suffer, and businesses operate under crippling constraints.
Energy makes possible the investments, innovations, and new industries that are the engines of jobs and growth for entire economies. Universal access to affordable, reliable, and sustainable energy is essential to reach other goals about sustainable development and is at the center of efforts to tackle climate change. (The World Bank, 2018)
Electrical Energy is very convenient due to the explained above, but sadly it also comes with an important environmental impact over the earth. The electricity generated globally produces carbon dioxide CO2 because the power matrix is mainly dominated by fossil fuels. It means that most of the power stations around the world use as a combustible to generate electricity fuel oil, coal, natural gas, and others.
Thus, what is sought is to encourage efficient energy management since the relationship between environmental deterioration and energy consumption is evident. Therefore, it is important to make efficient use of energy to mitigate carbon dioxide (CO2) emissions that occur globally.
In Taiwan and the world in general, high energy consumption generates large amounts of this carbon dioxide (CO2) and other greenhouse gas emissions that lead to the deterioration of the ozone layer, with serious consequences for the environment such as global warming and climate
2
change. That is why it is important to find a balance between environmental sustainability and productivity.
However, once the leaders of the countries noticed this effect, they signed some agreements to mitigate the carbon dioxide and greenhouse gasses that their countries produce daily. Also, as is the case of Taiwan, its president sets some goals, which one of the most important is the transition to green energies, which is based on the sort of source used to produce electricity, to improve the current quality of the air and decrease the CO2 levels.
Currently, just like other countries, Taiwan relies mostly on fossil fuels and also nuclear energy, and when the current president, which is belonging to the Democratic Progressive Party (DPP), started to rule in 2016, opted to denuclearize the country by 2025. Yet, in 2018, Taiwan voted a referendum to abolish this goal, however, Taiwan keeps its target of generating 20% of its electricity through renewable energies. (Taiwan News, 2020)
Right now Taiwan focuses its efforts on two sorts of green technologies to accomplish its goals, these technologies are solar energy and wind energy, either onshore or offshore (Taiwan News, 2020). However, it is also important to consider other sorts of technologies that might not seem to be that important as wind or solar, but it might contribute to Taiwan in this transition to green energies.
Piezoelectricity has not been considered for Taiwan yet, and it appears to be a solution for the energy problems. This is a sort of energy which can be harvested by converting mechanical vibrations into an electrical charge, or by placing a material under significant strain through heavy pressure. This device (piezoelectric) generates electricity based on the amount of force used in compressing or deforming a material. The potential for piezoelectric energy harvesting is,
3
therefore, a great alternative energy technology in order to help Taiwan to meet its goals. (Boughton, 2013)
B. Main Purpose of the Study
With the current policies around the world to promote the preservation of the environment and the creation of programs that stimulates the rational use of energy, the aim is to encourage efficient energy management and also the use of never-ending natural resources to generate electricity, such as sun or wind resources, given that, the relationship between environmental deterioration and energetic consumption is evident.
Different governments worldwide need to have good practices in energy consumption and energy generation, due to the importance of mitigation of greenhouse gasses. Many countries have been implementing non-conventional sorts of electric power generation systems to generate clean energy, for instance, using sea wave, wind or solar electricity
Nowadays Taiwan has been diversifying its energy matrix or power matrix by installing many solar parks just as wind farms, either onshore or offshore, across the country, however, in order to meet its goals, is important for Taiwan keep investing in new technologies that allow the country to develop and strengthen its electrical power system.
Due to the above, the concept of energy efficiency arises, which seeks to generate security of energy supply by incorporating more efficient technologies and good consumption habits by the end-user, seeking the preservation of the environment.
Applying the concept of energy efficiency and energy savings that this entails, a reduction in the carbon footprint will be perceived, besides helping the trade balance or social aspects, among others, and it can be taken into account as a strategy for sustainable development. One sort of
4
technology that has not been used yet in Taiwan arises with the purpose of helping to diversify the energetic matrix and it is the piezoelectricity.
The current study will focus on this kind of technology (piezoelectricity) and through some tools such as SWOT and PEST to determine how feasible might be this technology. In Taiwan one of the most important means of transport is the MRT (mass rapid transit) located in cities such as Taipei or Kaohsiung, these cities are the economic center of the country and where most of the population live. Daily, many people are using the metro to move from one place to another place rapidly and securely and each station has different devices that work with electricity.
With the purpose to figure out different ways to help Taiwan on its energy transition, arise the question, how feasible, considering quality-cost relationship is the installation of piezoelectric to collect electricity to one MRT station in Kaohsiung city?
The objectives of this work will be briefly stated below.
Aim
Conduct an investigation of the feasibility of using piezoelectric in an MRT station to generate electrical energy.
A review of electrical energy consumption in Taiwan
C. Research Procedure
This research is expected to determine how feasible it is using piezoelectricity in an MRT Station. To achieve this, make a literature review is necessary to collect enough information that has been put forward already for different researchers and observe the conclusions that have been found out. In the literature review, we also will find the advantages and disadvantages that
5
piezoelectricity has against other technologies, moreover, the details related to costs-benefits that we can find in this sort of device.
Then an analysis using SWOT and PEST will be conducted in order to learn about the factors the can affect the current project. By working through each point of the SWOT (Strengths, Weaknesses, Opportunities, Threats), it is possible to identify any internal disadvantages or advantages which could benefit or hinder the outcome of a planned project. In addition to evaluating the state internally, this method is also able to identify the external factors which could also make a difference to the success or failure of a project. Using PEST (Political, Economic, Social, Technological), which is more directly aimed at the external macro-environmental factors that might be affecting the project, the reasons behind growth or decline in the market and also identify new directions for the project as a whole (Creately, 2018)
Subsequently, an analysis of results must be carried out to decide if the piezoelectricity proposal is feasible or not. Finally, we will finish the study with some recommendations and conclusions.
6
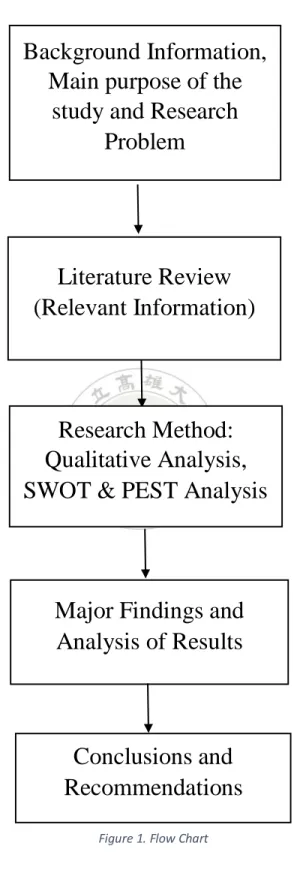
Background Information,
Main purpose of the
study and Research
Problem
Research Method:
Qualitative Analysis,
SWOT & PEST Analysis
Major Findings and
Analysis of Results
Conclusions and
Recommendations
Literature Review
(Relevant Information)
7
Chapter Two: Literature Review
The present chapter will address some important topics that are useful to develop the main idea of the current study, various definitions related to the electrical sector, just as the description of some sort of renewable energies used in Taiwan. Also will be considered concepts about the research methods that will be used in this study.
A. Taiwan Overview
Taiwan is a small island is located in the west pacific between Japan and the Philippines, where three-quarters of the island is non-arable. Taiwan due to its characteristics does not have enough natural resources on the island to generate its electricity demand, this lack of natural resources makes Taiwan rely on imported energy sources.
Despite this disadvantage, Taiwan has managed to stand out and be reference due to its economic performance and is one of the world's largest suppliers of computer chips, LCD panels, DRAM computer memory, networking equipment, and consumer electronics, so the energy supply has been an important factor to develop its economy. (Chang, 2012)
Table 1. Key Data of Taiwan 2019
Area [km^2] 36,197
Population 23,780,452
GDP [billion US dollars] 605.00
GDP per capita (USD) 27,131
Total Primary Energy Consumption[10^3KLOE]
125,234
Total CO2 Emission (Tonnes) 269,000,000
In table 1, we can see some Taiwan key data related to its economy, environment, and energy.
8 1. Electricity in Taiwan
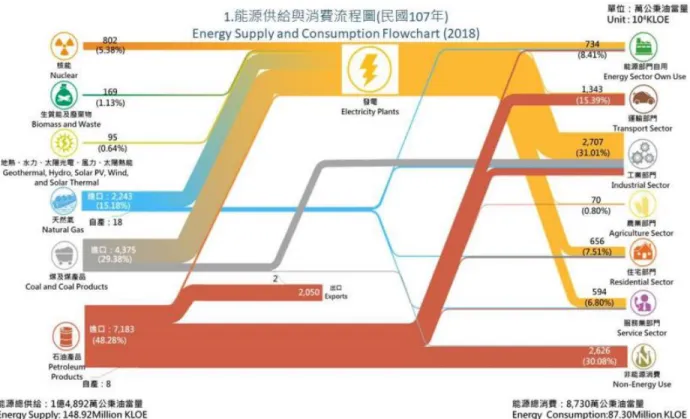
As it has been said, in Taiwan is quite important the Energy supply to the final user in order to perform different sort of activities that help to develop and enhance the economy of the country. Below in Figure 2, shows the flow chart of energy supply and consumption in 2018, the energy units are given in KLOE (kiloliters of oil equivalent).
Figure 2.Energy Supply and Consumption in Taiwan. (Bureau of Energy, 2019)
Having access to energy is a pillar for economic development and poverty alleviation, due to Taiwan is isolated and does not have many energy resources, it has to import most of the energy.
In 2018, the imported energy in Taiwan was 98.06% and the indigenous energy was 1.96%. In Figure 2 is possible to check the flowchart of the energy, it means we are allowed to know the source of the energy and the consumption of it. Most of the imported energy was from petroleum products with 48.28%, then coal and coal products with 29.38%, natural gas with 15.18%, and others.
9
As for energy consumption, the industrial sector has an important share with 31.01%, non-energy uses with 30.08%, transport sector with 15.39%, and others. However, in this study, we will focus more on the electrical sector.
The flowchart shows how dependent is Taiwan of fossil fuels in order to generate electricity, but also how important is the electricity in the industrial, residential, and service sectors.
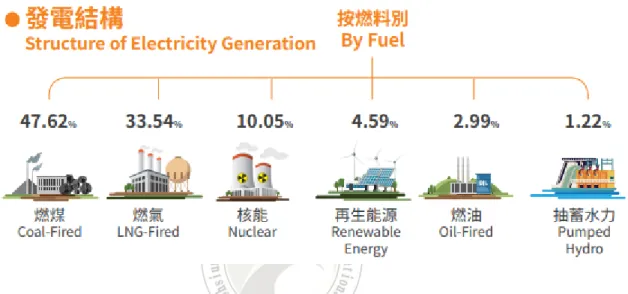
Figure 3.Structure of Electricity Generation. (Bureau of Energy, 2019)
The electricity generation in Taiwan relies mostly on coal and liquefied natural gas (LNG) and of course an important share of Nuclear energy. Taiwan’s electricity generation is mostly fueled by fossil energy, has grown by 14% in the past decade according to Taiwan’s Bureau of Energy. Coal (47.62% share), natural gas (33.54% share), and nuclear power (10.05% share) make up the bulk of the island’s electricity generation portfolio.
It is important to highlight that while coal and gas increase their share in the structure of electricity generation compared to previous years, nuclear energy started to cut down from 2014 due to the new policies. Moreover, the country started to invest in green energies according to its energy transition plan.
10
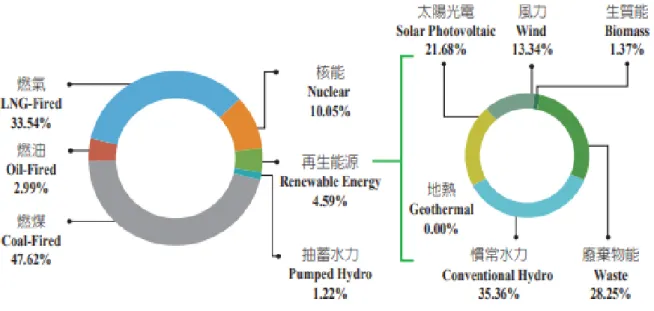
Figure 4.Electricity Generation by Fuel. (Bureau of Energy, 2019)
In Figure 4, the renewable energy share represents 4.59% from the total electricity generation of the country, and it is mainly made up of waste with 28.25%, solar energy with 21.68%, wind with 13.34%, and others. Nevertheless, most of the country’s efforts are focused on exploiting the capacity to generate solar and wind energy.
The mentioned fact that Taiwan imports over 98% of its energy, and due to its rapid economic growth is important for the country to increase its installed capacity, this is why the share of coal and LNG has increased in the last years. While in other countries, power grids are interconnected to each other in order to strengthen its electrical system, and also to develop strategies among countries to search for reducing costs of energy, Taiwan requires higher generation reserve margins looking for the reliability of its electrical system. (Chang, 2012)
Also, the Democratic Progressive Party has as its policy the “nuclear-free homeland”, so in the past few years the share of nuclear energy has been reduced but instead, there is even more share of coal and LNG.
11
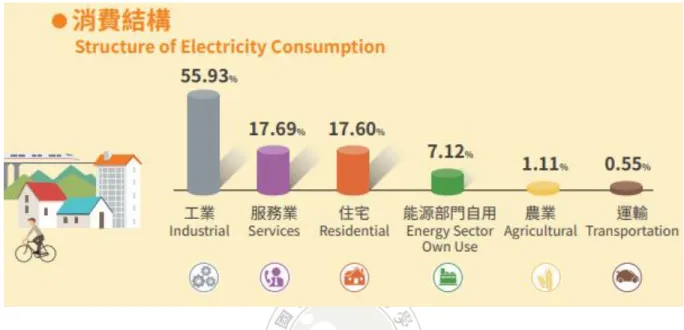
One of the main sources of income for Taiwan is about industrial manufacturing, so it is expected that the industrial sector has an important representation on the electricity consumption, in 2018 the industrial sector had 55.93% of total electricity consumption in the island.
Figure 5.Structure of Electricity Consumption. (Bureau of Energy, 2019)
However, services and residential sectors have an important share with 17.69% and 17.60% respectively.
2. Gross Domestic Product in Taiwan
Gross domestic product (GDP) denotes the aggregate value of all services and goods produced within a country in any given year.
Currently, Taiwan is the 7th largest economy in Asia and the 21st around the world (Economy of Taiwan, 2019), and since last decade, year by year its gross domestic product (GDP) has been increasing or maintain on its current figures.
12
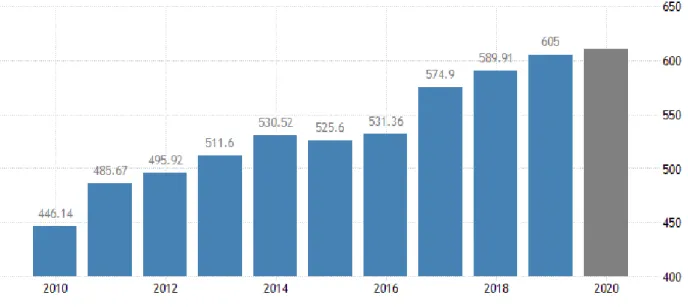
However, at the beginning of the decade, it was not like that, in 2009 Taiwan was one of the countries affected for the global financial crisis, mostly known as “The Great Recession”, this crisis altered the economy when it was mostly healthy and successful.
After The Great Recession, Taiwan developed different sorts of short and long term policies in order to overcome the crisis and also thinking about the future to avoid heavy consequences. (Himpler, 2018)
Figure 6.Taiwan Gross Domestic Product in the last decade. (Trading Economics, s.f.)
Then in 2015, Taiwan faced another crisis, this time because there was weak demand for electronic products worldwide and also due to a falling price of crude oil.
Despite these crises that Taiwan has faced, since 2016 the situation has been improving mostly because of its rapid industrialization as it is appreciated in Figure 6, wherein 2018 Taiwan’s GDP was around $590 US dollars and in 2019 it was $605 billion US dollars. (Government Portal of the Republic of China (Taiwan), s.f.)
13
Figure 7.Taiwan Economic Grow Rates. (Source: Directorate-Generral of Budget, Accounting and Statistics)
By 2018 Taiwan economy grew 2.63% in relation to 2017 as we can see in Figure 7, and it is expected this tendency in the upcoming years.
14
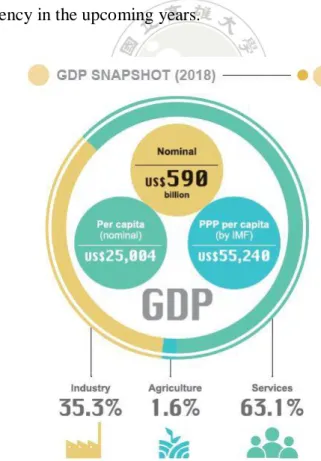
In Figure 8, is observed the breakdown of Taiwan’s GDP in 2018, where services represent 63.1%, the industry 35.3%, and agriculture just 1.6% of the GDP.
After seeing the breakdown of Taiwan’s GDP, we can see how important it is to Taiwan to have a robust electric system in order to keep improving its GDP rates in the service and industry sectors, but also electricity might be important to develop the agriculture sector.
3. Gross Domestic Product, Energy and CO2 Emissions in Taiwan
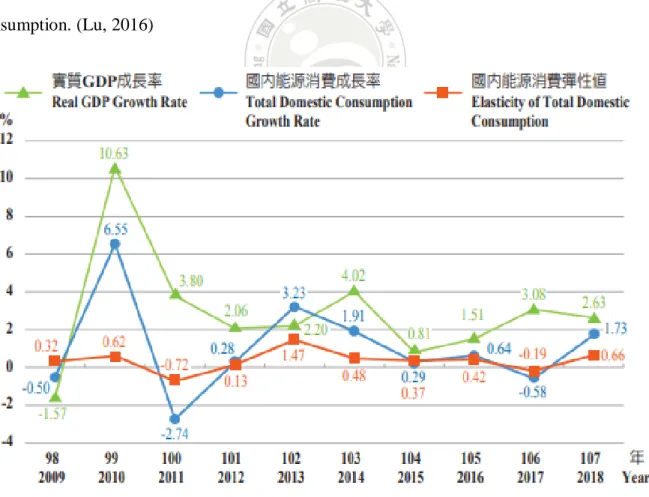
Taiwan is considered one of the Four Asian Tigers, a term that was created to exalt the rapid economic growth in a short period and the fast industrialization of the country. Taiwan's industrialization relies heavily on energy consumption. In Figure 9, it is represented the Real GDP Growth Rate, the Total Domestic Consumption Growth Rate, and the elasticity of total domestic consumption. (Lu, 2016)
15
It is evident that electricity consumption in the country and the growth of real GDP are correlated, which implies the relationship between economic growth and energy consumption.
According to a study performed in Taiwan, it says that there is bidirectional causality between energy consumption and economic growth and implicitly it affects the GDP of the country. These two variables influence each other in the short and long run, which means, there is a tendency that shows that the productive activities in the industrial sector need energy in order to perform as an engine for economic growth. (Lu, 2016)
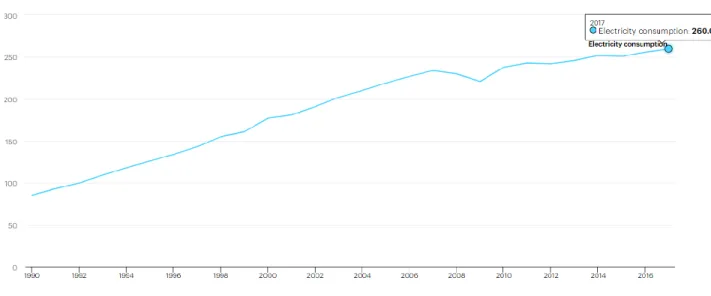
Figure 10.Taiwan Electricity Consumption. (International Energy Agency, 2020)
The fact that Taiwan is increasing its rates related to its GDP, implies also an increase in energy consumption in the country. By 2017 the electricity final consumption increased about 206% compared to 1990, as we can see in Figure 10, and with it the large quantities of CO2.
Considering that high amounts of carbon dioxide bring serious consequences for the environment such as global warming and climate change, establish different strategies to minimize these effects must be defined and implemented.
16
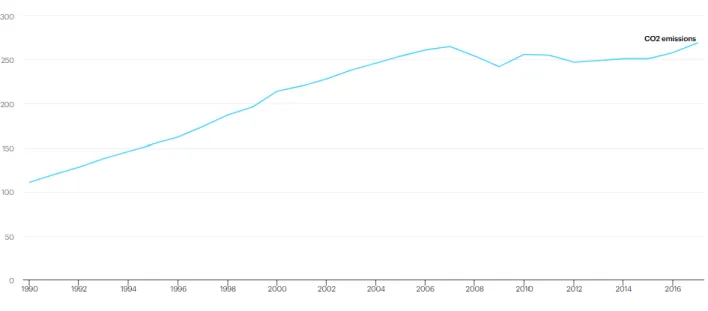
Figure 11. Taiwan Total CO2 Emissions. (International Energy Agency, 2020)
In Figure 11, it is represented how the amount of carbon dioxide has been increasing through the years, and it shows that in almost thirty years of CO2 emissions have increased by about 143% compared to 1990.
As it was explained before, this huge increase in CO2 emissions is due to the rapid industrialization of the country, below we can observe the breakdown of the carbon dioxide emissions by sector.
17
Figure 12. CO2 Emissions by Sector (International Energy Agency, 2020)
The CO2 emissions by sector show how big are the emissions due to electricity, however, the Industry and Transport sector has an important share in this breakdown. The total amount of CO2 emission in Taiwan in 2017 was roughly 269,000,000 tons, where 165,000,000 tons represent electricity and heat producers. (International Energy Agency, 2020)
Regarding the CO2 emissions by energy source, considering that Taiwan electricity is generated mainly using fossil fuels, it is not a surprise that coal, oil, and gas are responsible for a big part of the CO2 emissions.
18
Figure 13.CO2 Emissions by Energy Source. (International Energy Agency, 2020)
Several factors such as the size of the population, gross domestic product, or energy mix explain the amount of CO2 emissions. The important fact that Taiwan has limited domestic energy resources and must rely on oil and coal imports to satisfy the majority of its energy demand helps to understand its carbon dioxide levels.
In the last few years, some efforts creating policies to promote the preservation of the environment, and also through some programs that encourage the rational and efficient use of energy, countries around the world, want to face the current situation related to greenhouse gasses. The Paris agreement is a program that seeks to combat climate change and accelerate and intensify the necessary actions and investments for a sustainable future with low carbon emissions. That is why Taiwan needs to tackle the current situation in reducing its fossil energy dependency.
19
B. Renewable Energies
This sort of energy is commonly known as clean energy or green energy, it can be produced often by using natural sources of energy or also processes that are replenished. Solar energy or wind energy are two well-known renewable energies. However, there are other sources of renewable energy that harness biomass, geothermal energy, or sea-waves energy and can produce either electricity or heat. (Australian Renewable Energy Agency, 2020)
Another definition of renewable energy is given by the Renewable Energy Development Act, which defines. “Refers to solar energy, biomass energy, geothermal energy, ocean energy, wind energy, non-pumped storage hydroelectric power, energy generated by direct use or treatment of domestic general waste and general industrial waste, or other energy approved for sustainable use by the central competent authority” (Laws & Regulations Database of the Republic of China, 2019)
1. Solar Energy
Solar Energy is a sort of renewable energy. The sun is an inexhaustible form of energy present on the earth and also the major existent source. Because of it, many sorts of technologies are being developed, in order to take advantage of its benefits and generate electricity from harvested solar energy. (Kabir, 2018)
20
It is possible to generate electricity from solar energy, this process is called photovoltaic effect, and so, a definition for this process is given as the energy source that converts light directly into electricity without gas emissions or noise. (Mundo-Hernández, 2014)
A typical photovoltaic system is made up of the solar panel (also known as a solar module, which consists of a layer of silicon cells, a metal frame, a glass casing, and various wiring to allow current to flow from the silicon cells), a storage system (battery), a charge controller and an inverter. A scheme for representing this kind of system which shown in Figure 15.
Figure 15.Typical System of Photovoltaic Solar Energy. (VasconcelosSampaio, 2017)
One of the major prospects of solar energy is that this technology helps reducing global carbon emissions, and it has been one of the major environmental, economic, and social issues throughout the last years. Although this technology possesses a huge potential to generate electricity, its contribution to the global energy supply is not that strong as it must be. (VasconcelosSampaio, 2017)
21 2. Wind Energy
According to the Renewable Energy Development Act, wind power system refers to energy generated from wind power is converted into electricity and offshore wind power system refers to energy generated from wind power is converted into electricity with offshore wind farm installed in waters outside the sub-tidal line and not exceeding the bounds of the territorial sea. (Laws & Regulations Database of the Republic of China, 2019)
Just like the sun, the wind is a never-ending source of energy, because of it, it is an essential resource to generate clean electrical energy. The electricity can be generated through the wind, by using wind turbines, the wind spins the blades and this in turn rotates a generator.
Going into more detail, when the wind is blowing, the turbine spins clockwise capturing in this way the energy. This triggers the main shaft of the wind turbine, connected to a gearbox within the nacelle, to spin. Then, the gearbox transferred the energy to the generator and this one converts the energy into electricity. Finally, the electricity is adjusted to voltage levels that match the grid. (General Electric, 2020)
22
The wind has a huge potential to fulfill the world's energy needs. The wind is renewable, clean, and highly favorable to the environment, as it does not produce toxic gases during power generation and requires a small land area, either on-shore or offshore. (Kumar, 2016)
It can be used either directly as mechanical power or indirectly by converting the kinetic energy of wind into electrical energy. The most important element of any wind energy system is the wind turbine, which converts wind energy into mechanical and this one into electricity so that it can be used by the end-user. (Kumar, 2016)
Wind power has become an important element of the modern energy supply. The cumulative wind power capacity from 2001 to 2020 has been increasing through the years as it is shown in Figure 17, by 2016, the installed capacity of wind power achieved 487 GW, with 54 GW in that year. Wind power accounted for 55% of the renewable power capacity globally, not including hydropower, and represented for 3.7% of global electricity production by the end of 2015. (Blaabjerg, 2017)
Figure 17. Global Cumulative Wind Power. (Blaabjerg, 2017)
The design and size of a turbine are really important in electricity generation. Maximum wind capture and cost reductions are two primary motives for wind turbine research.
23 3. Non Pumped Storage Hydroelectric Power
Refers to hydropower generated in ditches or the installed capacity of the system is less than 20,000 kilowatts. (Laws & Regulations Database of the Republic of China, 2019)
Hydroelectric power is an energy that comes from flowing water, it is one of the most cost-effective means to generate electricity. This sort of energy is classed as renewable energy for some organizations or countries, due to relying on the Earth’s natural water cycle to generate electricity and for the fact that no fuels are burnt so no emissions are released to the atmosphere (McEntee, 2020). However, for many others, this sort of energy is considered no renewable energy.
On the other hand, a small scale hydroelectric is considered an environmentally-friendly option to produce electricity, because when hydropower is used without damns, impoundment or reservoirs means, meaning to operate in a river without interfering its flow. Small-scale micro-hydropower projects can make a big difference to communities in remote locations, where its basic principle is using water to drive turbines. (IRENA, 2020)
4. Biomass
There are some interpretations worldwide that define what Biomass energy means, however in Taiwan it refers to energy generated from direct use or treatment of vegetation, marsh gas, and domestic organic waste. (Laws & Regulations Database of the Republic of China, 2019)
When biomass is processed efficiently, by extracting the energy stored in the chemical bonds and the subsequent `energy' product combined with oxygen, the carbon is oxidized to produce CO2 and water. The process is cyclical, as the CO2 is then available to produce new biomass. (PeterMcKendry, 2002)
24
The release of energy from biomass combustion emulates natural processes. That is why, the energy obtained from biomass is a form of renewable energy, and in principle, utilizing this energy does not produce greenhouse gasses, in contrast to fossil fuels. (E.Toklu, 2017)
5. Waste
In the Taiwanese energy matrix, waste energy has an important piece of share along with biomass, there is a small difference between these two energies, and it is about the sort of raw material. Waste-to-energy plants take the process of waste incineration and use it to generate energy.
Waste-to-energy plants also referred to as WTE plants, have the potential to create a cyclical life cycle by converting industrial waste into energy. While most often used to process municipal solid waste, waste-to-energy companies can also transform renewable energy waste into electricity. (Folk, 2020)
Using waste to produce energy is also a waste management opportunity, just producing electricity is only one reason to burn waste material. Burning waste also reduces the amount of material that would probably be buried in landfills. Burning waste reduces the volume of waste by about 87%. (Energy Information Agency, 2019)
C. Non Renewable Energies
When we talk about non-renewable energy, the main energy source to have it are fossil fuels, it means coal, natural gas, and petroleum. The predominant element in fossil fuels is carbon. All the non-renewable energy comes from sources that will run out soon and cannot be replenished in our lifetime or even longer. (National Geographic, 2013)
25
Currently, fossil fuels are the most used source of energy worldwide, because of the extracting cost, the way of transporting it, and the storage is relatively affordable. This source of energy has been used for a long time already, but I was not until the last years, where the human being started to notice the side effects of its use. (National Geographic, 2013)
However, burning fossil fuels is very harmful to the environment. When in power plants or industries, oil and coal are burned, they release particles that pollute the air, water, and land. Some of these particles are caught and set aside, but many of them are released into the air. (National Geographic, 2013)
When fossil fuels are combusted, they release carbon dioxide (CO2) into the atmosphere this is a gas that keeps heat in the atmosphere and this process is called the greenhouse effect, which is necessary to live on Earth, but relies on a balanced carbon budget. This has made that the temperature rises quickly in last years. (National Geographic, 2013)
1. Coal, Gas, and Oil
Fossil fuel power plants burn coal, oil, or both of them to create heat which is in turn used to generate steam to move turbines and finally generate electricity. In countries where is difficult to find gas, it is imported from other countries, but for its transportation, it has to be done in a different state of the matter than gas, it is liquid, and it is called Liquid Natural Gas which is natural gas (predominantly methane, CH4, with some mixture of ethane, C2H6) that has been cooled down to liquid form for ease and safety of non-pressurized storage or transport. In gas plants, the gas is heated to drive a turbine to generate electricity. In 2017, fossil fuels generated 64.5% of electricity worldwide. (World Nuclear Association, 2020) (Wikipedia, 2020)
These plants generate electricity reliably over long periods and are generally affordable to build. However, burning carbon-based fuels produces large amounts of carbon dioxide, which
26
implies climate change. These plants also produce other pollutants, such as oxides of sulfur and nitrogen that affect the atmosphere. (World Nuclear Association, 2020)
2. Nuclear Energy
Nuclear Energy has been a frequent topic when we talk about energy, it is because there have been controversies around the world about its use. The core in a nuclear plant is the nuclear reactors, which mostly use uranium as a nuclear fuel. (Office of Nuclear Energy, 2020)
The nuclear reactors have under control some chain reactions that produce heat, this process is called fission. The mix of hit and water turns into pressurized steam, which drives a turbine generator, just as the process in the fossil fuel power plants, however, the difference between the two plants is the method of heating the water, which in this case is using the uranium. (Office of Nuclear Energy, 2020)
It is important to point out that the heat created by fission turns the water into steam, which spins a turbine to produce carbon-free electricity. (Office of Nuclear Energy, 2020)
D. Piezoelectricity
The word piezo comes from the Greek “Piezin”, which means to press or squeeze. Some materials, those which have this special property called “Direct piezoelectric effect” possess the capacity of generating electricity when a mechanical force stresses them. Overall, the most common crystals used are lead zirconate titanate crystals (PZT). (Garimella, 2015)
It was discovered in 1880 by Jacques and Pierre Curie, these two brothers discovered it during their studies into the effect of pressure on the generation of electrical charge by crystals. (Garimella, 2015)
27
After conducting several experiments, the brothers noticed that materials, such as, ceramic and potassium sodium tartrates, and quartz, after putting them under strain, the formation of charges breaks up, producing an electric voltage. (Mashaleh, 2018)
This process is called energy harvesting, in which its principle of operation is the displacement of ionic charges within a crystal structure and then capture the energy from different sources. (Garimella, 2015)
Figure 18.Operation of a Simple Piezoelectric. (Garimella, 2015)
As we can appreciate in Figure 18, the image represents the operation of a piezoelectric that is under rest, then the material is placed under stress, which in this case is compressing it, producing electricity that can be used in different devices or system that requires it.
1. Applications
28
- Direct piezoelectricity if some substances like quartz, can generate differential of potential.
- Sensing elements, detecting pressure variations. - Ultrasound imaging for medical use.
- Sonar sensors in different sorts of applications. - As chemical and biological sensors.
- Piezo-resistive silicon devices in semiconductors.
- Piezo-resistors, used for measurement of mechanical stress. - Automotive applications.
- To generate electricity from kinetic energy.
The situation about energy management in cities along with developments in technologies for monitoring data, infrastructure, and buildings, has led researchers to investigate the feasibility of energy harvesting in different sorts of infrastructure made by the human being. Bridges, buildings, train stations, stadiums, and roads provide kinetic and vibrational energy for piezoelectric energy harvesting due to wind, vehicle motion, and human traffic, which can be converted into electric energy.
The harvested energy can be used to power nearby devices or systems, such as wireless sensor networks that provide information about road conditions, traffic weight and pattern, and vehicle speeds, or other electronic systems. (Safaei, 2019)
As we can see in Figure 19, it shows the principle of operation of a piezoelectric. Based on that principle, arises the application of converting kinetic energy due to human traffic, where a footfall can stress the tile, and the compressing produced, generates electricy.
29
Figure 19.Direct Piezoelectric Effect. (Yang, 2016)
E. Research Methods
Below we will describe the research methods that will be used in this research in order to answer the research question.
1. SWOT Analysis
SWOT stands for Strengths, Weaknesses, Opportunities, and Threats. SWOT analysis is a powerful tool that helps to develop different sorts of strategies for new or existing businesses. This kind of research method will help to organize the top of the strengths, weaknesses, opportunities, and threats into a list. In summary, the SWOT analysis will help to turn the information into insights. (Parsons, 2018)
Weaknesses and strengths are controllable aspects that support and represent an obstacle to organizations to achieve their mission respectively, those are also known as internal factors. Opportunities and threats are uncontrollable factors that allow and restrict organizations from accomplishing their mission, and also are known as external factors. (Dyson, 2004)
30
The steps of these approaches can be summarized as follows. First, the SWOT analysis is carried out through a brainstorming session to identify the SWOT factors in each group. Then, the relative importance of the SWOT factor is determined through the pair-wise comparison within and between SWOT groups. Finally, the importance degree of the SWOT factors is computed based on the comparison matrix. (Phadermrod, 2016)
From SWOT analysis we can get to the next step of this, usually associated with the externally-focused TOWS Matrix. It helps to think about the options that a business could pursue. To do this is important to match external opportunities and threats with internal strengths and weaknesses. Figure 20 shown the SWOT Matrix (MindTools, n.d.)
Figure 20.SWOT/TOWS Matrix. (QuickMBA, n.d.)
Matching external with internal factor helps you to identify strategic alternatives that address the following additional questions:
Strengths and Opportunities (SO) – How can you use your strengths to take advantage of the opportunities? (MindTools, n.d.)
Strengths and Threats (ST) – How can you take advantage of your strengths to avoid real and potential threats? (MindTools, n.d.)
31
Weaknesses and Opportunities (WO) – How can you use your opportunities to overcome the weaknesses you are experiencing? (MindTools, n.d.)
Weaknesses and Threats (WT) – How can you minimize your weaknesses and avoid threats? (MindTools, n.d.)
2. PEST Analysis
PEST analysis is a strategic planning method to reduce business threats, PEST stands for Political, Economic, Social, and Technological, factors, when examining firms will gain valuable advantages, which will help with the idea phase, product development, product launching, and other factors, that increases the chances of success. (Frue, 2016)
This analysis is a tool used to analyses the macro-environmental factors that have an impact on an organization. The result of which is used to identify threats and weaknesses which are used in a SWOT analysis. (Amable, 2018)
The PEST provides recommendations for improvement of the system performance like for example, how to increase strengths, eliminate weaknesses, take advantage of all opportunities, and reduce threats. (Srdjevic, 2012)
32
Chapter Three: Research Method
A. Research Framework
The current study is about the feasibility of installing piezoelectricity at Kaohsiung Arena MRT Station. In order to determine how feasible it is to install this sort of technology, along with this study, some important information, such as the economic growth of Taiwan through the years, or the types of technology that Taiwan is using to produce its electrical energy, have been studied in detail.
Using tools, like for instance, SWOT and PEST will help to conclude whether piezoelectricity is an option or not to face global warming and the new policies related to green energies.
The research model is shown in Figure 21.
B. Qualitative Analysis
Due to the characteristics of the current study, it is based on qualitative analysis. In chapter two we get familiar with the different sources that Taiwan is using to supply electricity and from this understand the benefits and cons of each technology.
To Taiwan, with the purpose of meeting its future goals about denuclearization, and also to reduce its fossil fuel dependence, it is important to diversify its energetic matrix. The island has been investing a lot of money on solar and wind technologies, however, another technology will help Taiwan to accomplish its target.
33
It is here where the piezoelectricity plays an interesting role that will be analyzed through SWOT and PEST analysis, to examine the piezoelectric as a new sort of technology to be considered in the country as an alternative method to produce electricity.
With SWOT we will be considered the strengths, weaknesses, opportunities, and threats, while PEST is about political, economic, social, and technical factors. Each of the factors mentioned above will be analyzed to determine the piezoelectric feasibility.
As was said in chapter 2, it turns out to be very important to give steps in the right direction, which means to mitigate the CO2 emissions in Taiwan. To move forward, Taiwan needs to get rid of its dependency on fossil fuels (coal, oil, and gas), given that, its total electricity production depends on these kinds of sources. Also, looking for alternative ways to produce electricity is important, due to the current political party ruling Taiwan, has its plan about the phase out the use of nuclear energy.
As a result, Taiwan has invested a lot of money on solar and wind energy, but Taiwan is an island with limited land, and that is why the importance of piezoelectric. This technology does not pretend to take over the total electricity production of the country, instead, it arises as a complement to other sorts of green technologies.
People worldwide have to walk from one place to another place, so it is important to detect where big crowds are concentrate and take advantage of it, to generate electricity.
34
SWOT Analysis
Piezoelectricity
PEST Analysis
Replacement of
Thermal-Generation
Reduction of CO2
Emissions
Policy
Recommendations
Figure 21.Research Framework.35
Chapter Four: Major Findings
A. Introduction of Kaohsiung Arena MRT Station
Kaohsiung is a city located in the south of Taiwan, it is one of the most important cities in the country and possesses some of the most prominent structures in the country. The city has grown through the years from a village until turn into the economic and political center of southern Taiwan. The city has some of the key industries that have helped Taiwan to get the title of one of the four Asian tigers, such as steel-making, oil refining, manufacturing, freight transport, and shipbuilding. (Wikipedia, 2020)
The Kaohsiung International Airport is the second airport regarding the number of passengers in Taiwan, and the Port of Kaohsiung is the largest and more important port in Taiwan. Kaohsiung is well connected to other important cities in Taiwan such as Taichung or Taipei by high speed or conventional rail. (Wikipedia, 2020)
The city has a good transport system that allows its citizens to move into the city conveniently since it is well connected by a bus system and also a mass rapid transport (MRT), which is a robust metro system commonly known as Kaohsiung MRT.
Kaohsiung MRT has in total 45 stations and 3 lines, however, the study will be conducted taking into account which is the most convenient station considering some questions, such as, what are the stations with a high rate of passengers per day? What is the frequency of pedestrians? or What is the size of the station to be chosen in order to locate the tiles?
36
Table 2. Daily Ridership in 2018 (unit: 1000 person). (Kaohsiung Rapid Transport Corp., 2018)
JAN FEB MAR APR MAY JUN JUL AUG SEP OCT NOV DEC
Average Daily Ridership Red Line 132.4 152.1 126.5 135.1 123.8 128.1 133.4 130.0 126.9 132.2 135.4 150.3 133.7 Orange Line 42.7 51.3 41.7 42.5 39.1 40.4 43.8 42.6 39.7 42.9 45.1 41.8 43.6 All Line 175.1 203.4 168.2 177.6 163.0 168.4 177.2 172.6 166.6 175.0 180.5 202.1 177.3
From the annual report of Metro Kaohsiung, it is possible to collect the data about which metro line is the one which carries the most passengers in the city, Table 2 shows the number of passengers per month on each line.
Figure 22.Average Daily Ridership in the months of 2018. (Kaohsiung Rapid Transport Corp., 2018)
As we can see in Figure 22, the red line is the one that carries the highest amount of passengers in every month of the years, however, this line has in total 23 stations. So, from the Kaohsiung City Government Transportation Bureau, it was also possible to know the figure of passengers that each MRT station holds.
According to the document (Appendix 1), Zuoying MRT station is the one that holds the highest number of passengers per day, however, given that Kaohsiung Arena MRT station is
37
surrounded for many popular places, the frequency of passengers seems to be higher, and the difference of passenger between the stations is not that big, it is the chosen one to develop the study. Also, the idea of choosing an MRT Station with average traffic of passengers is to check the amount of energy that can be generated from it and then determine how convenient to implement this solution in other places.
Kaohsiung Arena MRT station is located along the red line in Zuoying District and it is named after Kaohsiung Arena. The station has two levels and the plans of the first level (concourse level plan) are shown in Figure 23 and second level (platform level plan) in Figure 24.
Figure 23.Kaohsiung Arena MRT Station Concourse Level Plan. (Kaohsiung Metro, 2020)
In Figure 23, we can observe the distribution and the sections of the concourse level of the Kaohsiung Arena MRT Station.
38
Figure 24.Kaohsiung Arena MRT Station Platform Level Plan. (Kaohsiung Metro, 2020)
In Figure 24, is appreciated the platform plan level, in both pictures above are some references by numbers, these references are named below.
1. Escalator 2. Elevator 3. Stairs 4. Public Phone 5. Toilets 6. Ticketing Gate
7. Automatic Ticket Issuing Machine 8. Information
9. AED
B. Installation of Piezoelectricity
The electricity consumption of Kaohsiung Rapid Transit Corporation (KRTC) in 2018 was around 137 million kilowatts per hour (kWh), which represents an increase of 0.03% of the previous year considering that it was 134 million kWh. TaiPower, the company that provides the electrical energy to the Mass Rapid Transport, increase the electricity rate at 3% average per year. Considering this, energy-saving with continuous improvement of energy use efficiency is necessary to reduce costs in the electricity bill, likewise, reducing the emissions of CO2. (Kaohsiung Metro, 2020)
39
Considering that there are 45 stations in total operating by KRTC, and the total electrical consumption of the company was 137 million kWh during 2018, we will assume the electrical consumption was the same in each station.
137,000,000 kWh / 45 = 3,044,444.44 kWh per year
It means 3.04 million kWh was the electrical consumed per station in 2018, now we are going to figure out the consumption of energy per day.
3.044.444,44 kWh / 365 days = 8,341 kWh per day
The average electric consumption per station on a single day during 2018 was roughly 8,341 kWh, now considering that Kaohsiung MRT Station is one of the stations with high electric consume, and in order to have a small margin of error, we will suppose the consume per day of this station is the obtained value, 8,341 kWh per day. However, given that piezoelectric, as well as the other existing renewable energies, this technology lacks reliability, since it does not produce energy in a static condition, which means, if there are not people in the station or just a few people, the amount of energy will not be enough to supply its requirements.
Therefore, the installation of piezoelectric is with the purpose of acting as support of the main source of energy, and in this way help to reduce the electric cost of the station, which in turn will be reflected in a reduction of amounts of CO2.
The first step is to identify the piezoelectric existing in the market. Although there is a considerable amount of piezoelectric in the market, only those which their application is aimed at pedestrians will be considered. Below, Table 3 helps to select the type of piezoelectric tiles according to the electricity production, cost of the tiles, and its size.
40
Table 3.Piezoelectric technology types (specifications, price, lifespan) (Solban, 2019)
With table 4 is possible to check the best function for using the tiles, shapes, materials, and configuration of each type.
41
Due to its high cost, we will discard the tiles of the company Sustainable Energy Floor (SEF), then the tiles that will be considered are produced by Waynergy Floor, and Pavegen. Both companies offer slabs with technology that can be used indoor or outdoor. Pavegen tiles will be selected to conduct the study because the slabs after being tested, they generated more power than Waynergy slabs, and also are more affordable (Bekzhanova, 2019).
Moreover, we have to consider the price of one square meter of Pavegen tiles might be lower at the moment of installing piezoelectric tiles, in 2018 the CEO of the company stated that in the upcoming years the price of the slabs would decrease around $125 USD per square meter. (Knowles, 2018)
Figure 25. Pavegen Tiles in London. (Mashaleh, 2018)
As we can see in Figures 23 and 24, Kaohsiung Arena MRT station is big enough to hold a big number of pedestrian, so identifying the right location to place the tiles is important in order
42
to get the maximum power of them, it because is relevant to consider some limitations, and the price of the slabs plays an important role in the current study.
According to a case study conducted in Japan in 2009, the company JR East installed a power-generating floor not all over the station, but at the ticketing gates in one station with high traffic, the intention was to generate enough electricity to power the monitors and the ticket machines in the station. (Laumann, 2017)
Figure 26. Proposed Tiles Location. (Elhalwagy, 2017)
Choosing a different place to locate the tiles than the ticketing gates, could be not suitable given that pedestrians tend to scatter in the station, and it will not be possible to take the maximum power from the tiles, so locating them on the ticketing gates, just as the case study in Japan, is the right option, since all the passengers have to cross the ticketing gates either to go in or out of the station. The proposed location for the tiles can be observed in Figure 26.
C. Replacement of Thermal Generation
The Kaohsiung Arena MRT Station is fed with electricity generated from fossil fuels, the purpose is to know how many piezoelectric tiles would be necessary to replace the thermal generation.
43
To make the analysis is required to know the amount of power that Pavegen tiles can generate per day. In total, and according to the Republic of China calendar, in the year 107, Kaohsiung Arena Station had 5,205,631 passengers going into the station, and 5,366,932 passengers going out from the station, through the whole year (Appendix 1), considering that a year has 365 days, in average the passengers going into the station was 14,262 passengers per day, and passengers going out from the station 14,703.92, it means around 29,000 people transit the station per day.
Figure 27.Pavegen working model. (Boby, 2014)
Figure 27 shows the representation of the working model of Pavegen tiles, to generate energy the person must give a step on the tile, then the energy can be stored or consume immediately depending on the requirements of the company.
According to Pavegen, a single tile can generate 5 joules or what is the same 5 watts per step, to generate this energy a person should have an average weight of 60 to 70 kg, and we assumed the electrical consume of the station is 9,000 kWh per day, and this information along with the number of pedestrians, allow us to calculate the number of required tiles to supply the electric consume of the station.
44
First of all, we will convert kWh into Joules using the next formula. 1 𝑘𝑊ℎ = 3,412 𝐵𝑇𝑈, 𝑤ℎ𝑒𝑟𝑒, 1 𝐵𝑇𝑈 = 1,055 𝐽𝑜𝑢𝑙𝑒𝑠.
1 𝑘𝑊ℎ = 3,412 ∗ 1,055 = 3,600,000 𝐽𝑜𝑢𝑙𝑒𝑠 𝐸𝐽 =9,000 kWh day * 3,600,000 = 32,400,000.000 Joules
The electric consumption of the station per day reaches 32,400,000,000 Joules. And also, as we said above, one tile can generate 5 Joules.
32,400,000,000 Joules / 5 Joules= 6,480,000,000 Joules per tile
We know that Kaohsiung Arena MRT Station holds an average of 29,000 pedestrians per day, with this information we can calculate the footsteps required to power the station.
6,480,000,000 Joules per tile / 29,000 Pedestrian = 223,448.28 footsteps
To generate 6,480,000,000 joules, are required about 223,449 footsteps of each pedestrian per day in order to supply the electric consumption with piezoelectricity.
Assuming every pedestrian hits 30 times the piezoelectric tiles, and that there are 7,000 tiles arranged in the station where each tile costs about $78 USD, under these conditions the energy produced would cover the electric consumption of the station per year. However, the cost per square meter is $620 USD, which indicates that the final value of the tiles will reach roughly $546,000 USD, and the fact that it is impossible to get the maximum power of each tile, it is non-viable condition.
Considering the place where the tiles will be located, the ticketing gates, and the chances to hit them 30 times, it makes of it, an impossible situation to set a big amount of tiles. It means
45
that using piezoelectricity to replace thermal energy by itself is not an option, on one hand, because of the high cost of the tiles and on the other hand because to produce electricity through piezoelectric requires and external factor, it is kinetic energy.
Despite this technology is not suitable to supply the total consumption of the station, it might be a good complement source to produce electrical energy to reduce the electric consumption of the station. Given the location of the ticket gates, the objective is to place 1.5 square meters of the tiles on each gate, just as it is shown in Figure 28.
Figure 28. Location of the Tiles on each ticketing gate.
In the station there are ten gates, so, in total there will be fifteen square meters of Pavegen tiles, it means one-half square meter per ticketing gate. The proposal mat of Pavegen tiles for each ticketing gate is 300 cm x 50 cm in order to make it fit on the floor.
46
There are two scenarios, the first one is with the price of $620 US dollars per square meter of Pavegen tiles and the second one, with a price of $125 US dollars per square meter.
Below it is shown the key data considering the first scenario, in table 5 we can observe the cost of the piezoelectric tiles along with the amount of energy that will produce in the proposed scenario.
Table 5. Cost and generation of electricity using Piezoelectric-Scenario 1.
Number of tiles arrangement (1.5sqr meter) 10
Price of one-half sqr meter of tiles [USD] $930
Steps on the tiles 15
Average Users per Day 29,000
Total Steps Users 435,000
Energy per Step [Joules] 6
Total Energy per Day [Joules] 2,610,000
Total Energy per Day [kWh] 0.73
Total Energy per Year [kWh] 264.63
Total Energy 20 Years [kWh] 5,292.50
Price of kWh in a lifetime [USD] $1.17
As we can see in table 5, the total energy produced during the lifetime of the tiles (20 years) is 5,292.5 kWh, which means, the price of a kilowatt-hour using piezoelectric will be $1.17 USD. Now, the Taiwan electricity price of thermal energy, in 2019 for business or industries was $0.129 USD per kWh (Global Petrol Prices, 2019), which implies a big difference on the electricity price using piezoelectric tiles.
Table 6. Electricity price thermal energy in Kaohsiung Arena MRT Station-Scenario 1.
Electrical Consume of the Station per day 8,340.94 kWh
Price of kWh Thermal Energy, 2019 [USD] $ 0.129
Price per kWh on a day [USD] $ 1,075.98
Price of electricity in one year (2019) [USD] $392,733.3
47
In Table 6, we have the electric consumption of Kaohsiung Arena MRT Station per day, the price of a kilowatt-hour from Thermal Energy in 2019, the price of electricity that Metro Company pays per day and per year, and finally considering that Metro Company claims the electricity bill increases in average 3%, the projection of the electricity bill in 20 years, all the price units in US dollars.
Table 7. Electricity Saves using piezoelectric in Kaohsiung Arena MRT Station- Scenario 1.
Electricity generated in the Station per day [kWh] 0.73 kWh
Saves in [USD] per day $0.093525
Saves in a year [USD] $34.14
Saves in 20 years [USD] $1,042.42
Cost per kWh of the tiles [USD per kWh] $1.75
In Table 7, it shows the electricity generated per day from the tile and the saves generated with the piezoelectric tiles in Kaohsiung Arena MRT Station, where the saves in 20 years will be $1,042.42 US dollars. In the first scenario, we can observe that the price of kilowatt-hour from thermal energy is $0.129 US dollar and from piezoelectric tiles is $1.75 US dollars, where the last one is 13.62 times more expensive. We can see that there is a big difference when comparing the prices of one and another technology.
Now we will consider the second scenario, with a price of $125 US dollars per square meter of Pavegen tiles.
Table 8.Cost and generation of electricity using Piezoelectric-Scenario 2.
Number of tiles arrangement (1.5 sqr mt) 10
Price of an sqr meter of tiles [USD] $187
Steps on the tiles 15
Average Users per Day 29,000
48
Energy per Step [Joules] 6
Total Energy per Day [Joules] 2,610,000
Total Energy per Day [kWh] 0.73
Total Energy per Year [kWh] 264.63
Total Energy 20 Years [kWh] 5,292.50
Price of kWh in a lifetime [USD] $0.35
Table 8 is shown the same information as Table 7, but here the difference is about costs, the price of the tiles is different, and also the cost of a kilowatt-hour in the lifetime of the tiles.
Due to, we already know the key data about the price of thermal energy that was generated in Table 6, we will continue with the saves using piezoelectric in the second scenario.
Table 9.Electricity Saves using piezoelectric in Kaohsiung Arena MRT Station- Scenario 2.
Electricity generated in the Station per day [kWh] 0.73 kWh
Saves in [USD] per day $0.093525
Saves in a year [USD] $34.14
Saves in 20 years [USD] 1,042.42
Cost per kWh of the tiles [USD per kWh] $0.3533
With the second scenario, we can notice the difference between the price of thermal energy and piezoelectricity, given that here, the cost per kWh of tiles comes to $0.3533 US dollars, however, it is still more expensive than thermal energy about 2.73 times.
Table 10.The unit cost of electric generation.
Source of Energy Scenario 1 Scenario 2 Thermal $0.129 $0.129
Piezoelectric $1.75 $0.3533
Relation 13.57 2.74
49
In Table 10, we can see in summary what was found concerning the cost per unit of electrical generation, where clearly shows that piezoelectric is more expensive than thermal energy.
D. Reduction of greenhouse gas emissions
Based on the analysis above, we can determine how much greenhouse gas emissions this type of technology will help to reduce. First of all, it is important to analyze the impact on the environment when a single Pavegen tile is produced and how much carbon dioxide is generated.
Table 11.Carbon emissions of one Pavegen tile. (Bekzhanova, 2019)
Material CO2 produced (Kg)
Recycled rubber car tire 0.248
Recycled aluminum 3.2
Marine-grade 316 stainless
steel 1.87
Toughened clear glass 0.709
TOTAL 6.03 Kg
Pavegen tile is 100% recyclable, so it is considered environmentally friendly, however, despite it is made of recyclable materials in its entirety, yet its production generates 6.03 Kg of CO2 when it is implemented. Nevertheless, comparing the amount of produced carbon dioxide emissions between the amount of CO2 produced during the production of the Pavegen tile, 6.03 kg, and the amount reduced by using the tile, it comes up to 1,664 kg, it can be stated that using the Pavegen technology has countless advantages in terms of environmental issues and is highly recommended. (Bekzhanova, 2019)
The total amount of energy that Pavegen tiles can produce in the current study case is roughly 5,293 kWh along its 20 years of lifetime, the value of greenhouse gas emissions for this