SCRS/2001/139
VERIFICATION OF BIGEYE TUNA LENGTH AND CATCH DATA
CONSISTENCY FOR TAIWANESE LONGLINE FISHERY IN THE ATLANTIC
Chien-Chung Hsu1 and Hsi-Chiang Liu1
SUMMARY
The fishing types are investigated in terms of number of hooks between floats for Taiwanese longline fleets in the Atlantic, and annual mean weight that obtained from different methods is estimated to verify the length frequency and catch data. The results obtained shows that 10 or more hooks between floats could be classified as deep longline fishing type and target tropical species; and that 9 or less hooks between floats as regular longline fishing type and target albacore as usual. Annual mean weight estimated from length frequency sampled is much more coincident to the total catch reported in TASK I, in contrast, mean weight estimated from TASK II reported previously shows discrepancies and fluctuation in comparison with those from length frequency. This verify that the length frequency sample and catch estimation from those length frequency sound accurate and could be used in the stock assessment.
RÉSUMÉ
Les types de pêche sont examinés en termes du nombre d=hameçons entre flotteurs des flottilles
palangrières du Taïpei chinois dans l=Atlantique, et le poids annuel moyen obtenu par
différentes méthodes est estimé pour vérifier les données sur la fréquence des tailles et sur la capture. Les résultats obtenus montrent que 10 hameçons ou plus entre flotteurs pourrait être considéré comme une pêche palangrière de profondeur visant les thons tropicaux, et que 9 hameçons ou moins entre flotteurs comme une pêche palangrière normale visant le germon
comme d=habitude. Le poids annuel moyen estimé d=après la fréquence des tailles
échantillonnées coïncide bien plus avec la prise totale déclarée dans la Tâche I; en revanche,
le poids moyen estimé d=après les données Tâche II déclarées antérieurement montre des
divergences et des fluctuations par rapport à celui qui provient des fréquences de taille. Ceci
étaye l=opinion que l=échantillonnage des fréquences de taille et l=estimation de la capture
d=après ces fréquences de taille semblent corrects et pourraient servir dans l=évaluation du
stock.
RESUMEN
Se investigan los tipos de pesca en términos de número de anzuelos entre flotadores para las flotas de palangre de Taipei Chino en el Atlántico, y se estima el peso medio anual obtenido mediante diferentes métodos para verificar los datos de frecuencia de tallas y de captura. Los resultados obtenidos muestran que 10 o más anzuelos entre flotadores podría clasificarse como palangre profundo dirigido a las especies tropicales; y que 9 o menos anzuelos entre flotadores podría clasificarse como palangre habitual dirigido como de costumbre al atún blanco. El peso medio anual estimado a partir de la frecuencia de tallas muestreada coincide más con el total
1Professor, Institute of Oceanography, National Taiwan University, P. O. Box 23-13, Taipei, Taiwan 106; E-mail: [email protected]
de captura comunicada en la Tarea I, en cambio, el peso medio estimado a partir de la Tarea II comunicada anteriormente muestra discrepancias y fluctuaciones en comparación con el procedente de la frecuencia de tallas. Esto verifica que la muestra de frecuencia de tallas y la estimación de captura a partir de estas frecuencias de tallas parece precisa y podría ser utilizada en la evaluación de stock.
KEYWORDS
Bigeye tuna, longline, tuna fisheries, data collections, fish catch statistics, fishery statistics
INTRODUCTION
Two fishing types are used to target different tuna species for Taiwanese longline fleets in the Atlantic (Hsu and Liu, 1999; Yeh et al., 2001), and catch data compilation has been transferred since 1995 (Hsu and Lin, 1996). Those may result in more or less data discrepancies. The former may affect the estimation of abundance index through standardization of catch per unit effort due to not easily separate fishing efforts directed to the target species; and the latter may cause changes of original data compilation, including raising factors, sample sizes, and estimation procedures. Thus, Data for using to abundance index estimation have to be verified before pursuing stock assessment.
Therefore, the objectives of this report are to investigate the evolution of fishing types in terms of number of hooks between floats for Taiwanese longline fishery in the Atlantic to target on bigeye tuna, yellowfin tuna and albacore, and to verify the catch data by examining the length frequency sampled and annual mean weight of the bigeye tuna.
MATERIALS AND METHODS
This document used daily quadrangle Taiwanese longline logbooks and total catch data, including catch in number, weight, fishing effort and fork length measurements. The 1999 data set was not used because it was preliminary and incomplete.
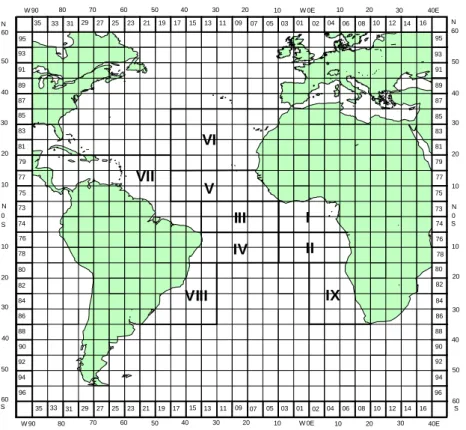
Based on the observation error of commercial fishery data (Hilborn and Walters, 1992), thus, some possible processing is necessary before pursuing assessment analyses. First of all, the spatial and temporal distribution of length frequency should be considered to verify. This report considered the bigeye tuna fishing region in the Atlantic by Taiwanese longline fishery, and in according to the density distribution in the major fishing region (Hsu and Liu, 1999), an appropriate stratification of the major region into 9 sub-areas was made for the present size and catch data verifying study.
A sampling factor for length measurement was made, and classified into time-area length frequency distribution. Accordingly, a von Bertalanffy growth equation of bigeye tuna in the Atlantic (Azevedo, 1983) was used to slice the length compositions into age compositions. Then, the length frequency distributions were compared in terms of age composition. A modified Chi-square criterion was applied for this purpose (Punsley and Deriso, 1991). Therefore, the dissimilarity between two age compositions,
d
( i
i
,
′
)
, is tested by:∑
= ′−
=
′
n j j j i ijp
p
p
n
i
i
i
d
1 2/
)
(
)
,
(
, i ≠i′ (1)where
d
( i
i
,
′
)
is the dissimilarity index between age composition samplesi
and i′,n
s thetotal age groups,
p
ij is the proportion of a age group that was estimated as agej
in thei
sample,and
p
j is the mean proportion of thej
age group in all samples.The comparison resulted from equation (1) could be used to substitution between samples,
depending on the values of
d
( i
i
,
′
)
.Fishing type classification
The fishing type used to catch bigeye tuna is mainly the so-called deep longline fishing type for Taiwanese longline fleets. Yeh et al. (2001) indicated that the fishing type is related to the number of hooks between floats for Taiwanese longline fleets in the Atlantic.
A longline fishing type can be defined as using the number of hooks between floats (or number of hooks per basket) (Suzuki et al., 1977). Further, Lin (1998) and Hsu et al. (2001) observed the great discrepancies of using number of hooks between floats in fishing bigeye tuna in the Indian Ocean in time and space. Thus, The present report was doing same things as Lin (1998) and Hsu et al. (2001) doing so in the Indian Ocean.
Mean weight verification
The annual mean weight of bigeye tuna was estimated by two ways: the total catch in weight divided by total catch in number and transformation from length frequency distribution using length-weight relationship (Aezvedo, 1983). Both of these estimations can be used in cross check the consistency of annual mean weight.
The estimation of annual mean weight is simply used total catch in weight dividing by total catch in number. And to estimate mean weight by length frequency is made by taking the man length for each sub-area (Fig. 1). That is,
∑
∑
= ==
n j ij n j ij ij ix
x
1 1!
!
(2)where
!
i is the mean length estimated from frequency distribution in sub-areai
and weightedby catch in number for each length category,
!
ij is the length of the sub-area and thej
length class,n
is the total length classes,x
ij is the number of samples in thei
sub-area for thej
length class.Thus using the length-weight relationship and the catch in number in the
i
sub-area, the meanweight sampled from the
i
sub-area isi i
i
a
C
W
=
!
, (3)where
W
i andC
i are the mean weight and catch in number, respectively in the sub-areai
,and
a
and b are the parameters of length-weight relationship. For bigeye tuna in the Atlantic,a
= 2.7x10⁻⁵, and b =.2.951 that are adopted from Azevedo (1983).
Hence, the annual mean weight in year
t
can be estimated by weighting the mean weight in thesub-area
i
:∑
∑
= ==
A i ti A i ti ti tC
C
W
W
1 1 , (4)where
W
t is the annual mean weight estimated from length frequency sampled for yeart
,C
tiis the annual catch in year
t
,broken down into sub-area as doing for length frequency distribution.RESULTS
1. Fishing types
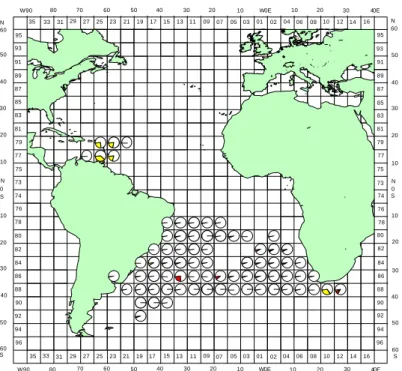
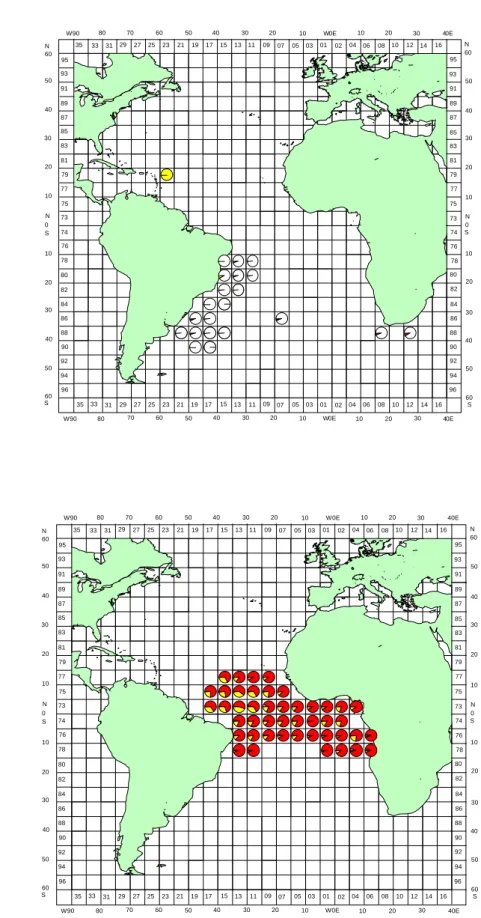
According to the studies of grouping the catches of albacore, yellowfin tuna and bigeye tuna for Taiwanese longline fishery in the Atlantic Ocean by the number of hooks between floats (Fig. 2), the more hooks between floats (likely >11 hooks between floats) are almost used to fish bigeye tuna in the tropical area (Fig. 1), and the less hooks between floats (<10 hooks between floats) may be used to fish tropical tuna in particular space and time, however, those fishing types are almost used to target albacore.
As the results, the estimation of abundance index of bigeye tuna, and even albacore and yellowfin tuna, for Taiwanese longline fishery, a partitioning procedure should be done for separating fishing types before standardization, or the fishing type factor should be used in the standardization models (such as general linear model) to prevent misinterpreting the relationship of abundance index and fishing efforts.
2. Length frequency distributions
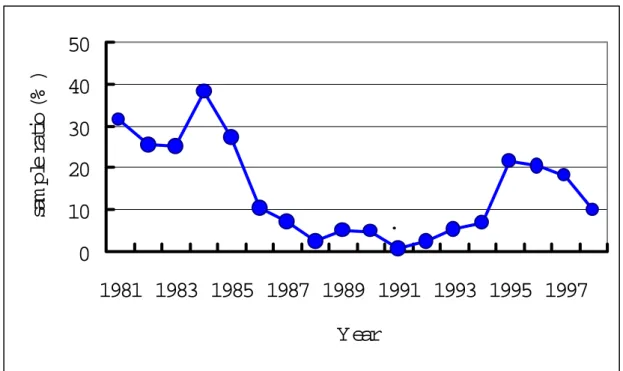
The length frequency distribution was grouped by quarter and sub-areas (Fig. 1). The sampling factor of actual length measurement in the annual catch was shown in Fig. 3. It is obviously, in according to the regulation of sampling for size measurement for Taiwanese longline fishery (Hsu and Lin, 1996), that the sampling factor is low between 1988 and 1992 because either low catch (1988 and 1989) or low logbooks coverage (1990, 1991 and 1992), and is high for the rest years. The drop down percentages of sampling bigeye tuna length in 1998 was due to the incomplete compilation of the size data at hand. The total annual catch in number and samples for length measurements are compared in Fig. 4.
And then, the quarterly-sub-area length frequency was converted to quarter age in sub-areas, e.g., Fig. 5 for those sampled in 1997 and 1998. The modified chi-square criterion of equation (1) was used to compare the age compositions for quarter and sub-area distribution; the results show that there are no significant difference in age compositions among sub-areas and quarters (resultant values for testing are not shown in the report). Therefore, the length frequency data could be used in mean weight estimation through equations (2) to (4).
Mean weight estimation
The annual mean weight was estimated from different methods, the results were shown in Fig. 6. In which the results obtained indicated that the mean weight estimated by total catch in weight divided by total catch in number and TASK II reported previously to ICCAT were worse than those from length frequency distribution. Again, the total catch in weight estimated from both length frequency conversions is better than the other two (Fig. 7). The better means its consistency with the reported TASK I.
DISCUSSION
The catch compositions for each category of the number of hooks between floats indicated that 10 and more hooks between floats are used in targeting tropical tunas, such as bigeye tuna and yellowfin tuna in the Atlantic. Therefore, it is easy to partition fishing efforts for different directed species by the number of hooks between floats when the standardization of abundance index is pursued.
There are weight and number of catch by species recorded within logbooks of Taiwanese longline fleets. Usually the number recorded is recognized as accurately as expected, however, the weight recorded is estimated by captain on board. And the TASK II catch in weight was raised from the summed weight in logbooks to gilled and gutted factor (=1.192) and to the total catch verified from other sources, such as trade reports. As the result, the weight in the logbooks is confirmed not to be accurate enough. Thus, this fact reflects that the catch estimation from total catch in weight divided by total catch in number may not be satisfied.
Summarized the results obtained above, when the nominal catch per unit effort was used in the standardization of abundance index, to use catch in number and mean weight is recommended, because this may be given a much more appropriate representative index as usual done on using catch in weight directly.
REFERENCES
Azevedo, M. A. 1983. Management of the population of bigeye tuna (Thunnus obesus) of the Atlantic. International Commission for the Conservation of Atlantic Tunas, Coll. Vol. Sci. Pap., 18:363-375.
Hilborn, R. and C. J. Walters. 1992. Quantitative fisheries stock assessment: Choice, dynamics and uncertainty. Chapman & Hall, New York.
Hsu, C. C. and M. C. Lin. 1996. The recent catch estimation procedure of Taiwanese longline fisheries. International Commission for the Conservation of Atlantic Tunas, Coll. Vol. Sci. Pap., 43:171-178.
Hsu, C. C. and H. C. Liu. 1999. The updated catch per unit effort of bigeye tuna for Taiwanese longline fishery in the Atlantic. International Commission for the Conservation of Atlantic Tunas, Coll. Vol. Sci. Pap., (SCRS/99/130).
Hsu, C. C., H. H. Lee, Y. M. Yeh and H. C. Liu. 2001. On targeting problem, partitioning fishing effort and estimating abundance index of bigeye tuna for Taiwanese longline fishery in the Indian
Ocean. Document of the 3rd Working Parties on Tropical Tunas, Indian Ocean Tuna Commission.
June 19-27, 2001 Victoria, Seychelles.
Lin, C. J. 1998. The relationship between Taiwanese longline fishing patterns and catch compositions in the Indian Ocean. M.S. Thesis, Institute of Oceanography, National Taiwan University, Taipei, Taiwan. 57pp.
Punsley, R. G. and R. B. Deriso. 1991. Estimation of the abundance of yellowfin tuna, Thunnus
albacares, by age groups and regions within the eastern Pacific Ocean. Inter-American Tropical
Tuna Commission, Bulletin, 20(2):99-131.
Suzuki, Z., Y. Warashina and M. Kishida. 1977. The comparison of catches by regular and deep tuna longline gears in the western and central equatorial Pacific. Bull. Far Seas Fish. Res. Lab., 15:51-89.
Yeh, Y. M., C. C. Hsu, H. H. Lee and H. C. Liu. 2001. A consider procedure to partition fishing efforts when fished with different types in space and time as the case of Taiwanese longline fleets in the Atlantic. (manuscript)
20 40 30 10 0 N S 10 82 20 30 40 50 60 S 86 84 77 75 73 74 76 78 80 79 87 95 93 91 89 85 83 81 N 80 35 33 W 90 60 50 27 29 88 90 92 94 96 35 33 31 W 90 80 70 60 31 29 27 70 60 17 19 25 23 21 50 40 25 23 21 19 17 15 13 11 50 40 15 13 11 30 20 10 81 83 85 87 89 91 93 95 30 20 10 W 0E 10 20 30 40E 30 W 0E 10 20 40E 79 77 84 82 80 78 76 74 73 08 09 07 05 03 01 02 04 06 08 02 09 07 05 03 01 04 06 10 12 14 16 60 N 60 10 12 14 16 96 94 S 50 86 88 92 40 50 75 0 N S 10 20 30 90 40 30 20 10 VII VIII VI V III II IV I IX
20 40 30 10 0 N S 10 82 20 30 40 50 60 S 86 84 77 75 73 74 76 78 80 79 87 95 93 91 89 85 83 81 N 80 35 33 W90 60 50 27 29 88 90 92 94 96 35 33 31 W90 80 70 60 31 29 27 70 60 17 19 25 23 21 50 40 25 23 21 19 17 1513 11 50 40 15 13 11 30 20 10 81 83 85 87 89 91 93 95 30 20 10 W0E 10 20 30 40E 30 W0E 10 20 40E 79 77 84 82 80 78 76 74 73 08 0907 0503 01 0204 06 08 02 09 07 0503 01 04 06 10 12 14 16 60 N 60 10 12 14 16 96 94 S 50 86 88 92 40 50 75 0 N S 10 20 30 90 40 30 20 10 1996-1998 NHBF=9 1 0.5 0.1 alb bet yft 20 40 30 10 0 N S 10 82 20 30 40 50 60 S 86 84 77 75 73 74 76 78 80 79 87 95 93 91 89 85 83 81 N 80 35 33 W90 60 50 27 29 88 90 92 94 96 35 33 31 W90 80 70 60 31 29 27 70 60 17 19 25 23 21 50 40 25 23 21 19 17 15 13 11 50 40 15 13 11 30 20 10 81 83 85 87 89 91 93 95 30 20 10 W0E 10 20 30 40E 30 W0E 10 20 40E 79 77 84 82 80 78 76 74 73 08 09 07 05 03 01 02 04 06 08 02 09 07 05 03 01 04 06 10 12 14 16 60 N 60 10 12 14 16 96 94 S 50 86 88 92 40 50 75 0 N S 10 20 30 90 40 30 20 10 1996-1998 NHB F=10 1 0.5 0.1 alb bet yft
Fig. 2. The catch composition of 9 and 10 hooks between floats used by Taiwanese longline fleets in the Atlantic,
20 40 30 10 0 N S 10 82 20 30 40 50 60 S 86 84 77 75 73 74 76 78 80 79 87 95 93 91 89 85 83 81 N 80 35 33 W90 60 50 27 29 88 90 92 94 96 35 33 31 W90 80 70 60 31 29 27 70 60 17 19 25 23 21 50 40 25 23 21 19 17 15 13 11 50 40 15 13 11 30 20 10 81 83 85 87 89 91 93 95 30 20 10 W0E 10 20 30 40E 30 W0E 10 20 40E 79 77 84 82 80 78 76 74 73 08 09 07 05 03 01 02 04 06 08 02 09 07 05 03 01 04 06 10 12 14 16 60 N 60 10 12 14 16 96 94 S 50 86 88 92 40 50 75 0 N S 10 20 30 90 40 30 20 10 1996-1998 NHBF=8 1 0. 5 0. 1 alb bet yft 20 40 30 10 0 N S 10 82 20 30 40 50 60 S 86 84 77 75 73 74 76 78 80 79 87 95 93 91 89 85 83 81 N 80 35 33 W90 60 50 27 29 88 90 92 94 96 35 33 31 W90 80 70 60 31 29 27 70 60 17 19 25 23 21 50 40 25 23 21 19 17 15 13 11 50 40 15 13 11 30 20 10 81 83 85 87 89 91 93 95 30 20 10 W0E 10 20 30 40E 30 W0E 10 20 40E 79 77 84 82 80 78 76 74 73 08 09 07 05 03 01 02 04 06 08 02 09 07 05 03 01 04 06 10 12 14 16 60 N 60 10 12 14 16 96 94 S 50 86 88 92 40 50 75 0 N S 10 20 30 90 40 30 20 10 1996-1998 NHBF=16 1 0.5 0.1 alb bet yft
0
10
20
30
40
50
1981 1983 1985 1987 1989 1991 1993 1995 1997
Year
sam
p
le
rat
io
(%)
.
Fig. 3. Annual sampling ratio (=samples in no./catch in no.) for length frequency analysis from 1981 to
1998 in the Atlantic Ocean by Taiwanese longline fleets.
0
100000
200000
300000
400000
500000
600000
1981 1983 1985 1987 1989 1991 1993 1995 1997
Year
Nu
m
b
e
rs
Catch (no)
sam ple no.
Fig. 4. The annual total catch in number and sample sizes for length measurement from 1981 to 1998 in the
Q1A6 0 0.1 0.2 0.3 1 4 7 10 13 16 19 22 25 28 31 34 37 40 Quarter age Fr e q u e n c y Q2A6 0 0.05 0.1 0.15 0.2 0.25 1 4 7 10 13 16 19 22 25 28 31 34 37 40 Quarter age Fr e q u e n c y
Fig.5. The age composition of bigeye tuna caught by Taiwanese longline fleets in the Atlantic in 1997 by
Q1A2 0 0.05 0.1 0.15 0.2 0.25 1 4 7 10 13 16 19 22 25 28 31 34 37 40 Quarter age F re que nc y Q2A2 0 0.05 0.1 0.15 0.2 0.25 1 4 7 10 13 16 19 22 25 28 31 34 37 40 Quarter age F re que nc y Q3A2 0 0.05 0.1 0.15 1 4 7 10 13 16 19 22 25 28 31 34 37 40 Quarter age F re que nc y Q4A2 0 0.05 0.1 0.15 0.2 1 4 7 10 13 16 19 22 25 28 31 34 37 40 Quarter age F re que nc y Fig.5-1
Q4A4 0 0.05 0.1 0.15 0.2 1 4 7 10 13 16 19 22 25 28 31 34 37 40 Quarter age F re q ue nc y Q3A4 0 0.05 0.1 0.15 0.2 0.25 1 4 7 10 13 16 19 22 25 28 31 34 37 40 Quarter aage F re q ue nc y Q2A4 0 0.05 0.1 0.15 0.2 1 4 7 10 13 16 19 22 25 28 31 34 37 40 Quarter age F re q ue nc y Q1A4 0 0.05 0.1 0.15 0.2 1 4 7 10 13 16 19 22 25 28 31 34 37 40 Quarter age F re q ue nc y Fig. 5-2
Q1A5 0 0.05 0.1 0.15 1 4 7 10 13 16 19 22 25 28 31 34 37 40 Quarter age Fr e q ue nc y Q2A5 0 0.05 0.1 0.15 1 4 7 10 13 16 19 22 25 28 31 34 37 40 Quarter age F re q ue nc y Q3A5 0 0.05 0.1 0.15 1 4 7 10 13 16 19 22 25 28 31 34 37 40 Quarter age F re q ue nc y Q4A5 0 0.02 0.04 0.06 0.08 0.1 0.12 0.14 0.16 1 3 5 7 9 11 13 15 17 19 21 23 25 27 29 31 33 35 37 39 Quarter age Fr eq u en cy Fig. 5-3
Q1A9 0 0.1 0.2 0.3 0.4 1 4 7 10 13 16 19 22 25 28 31 34 37 40 Quarter age Fr e q u e n c y Q2A9 0 0.1 0.2 0.3 0.4 0.5 1 4 7 10 13 16 19 22 25 28 31 34 37 40 Quarter age Fr e q u e n c y Q3A9 0 0.1 0.2 0.3 1 4 7 10 13 16 19 22 25 28 31 34 37 40 Quarter age Fr e q u e n c y Fig. 5-4
98Q1A2 0 0.05 0.1 0.15 0.2 1 4 7 10 13 16 19 22 25 28 31 34 37 40 Quarter age F re que nc y 98Q1A4 0 0.05 0.1 0.15 1 4 7 10 13 16 19 22 25 28 31 34 37 40 Quarter age F re que nc y 98Q1A5 0 0.05 0.1 0.15 0.2 1 4 7 10 13 16 19 22 25 28 31 34 37 40 Quarter age F re que nc y 98Q1A6 0 0.1 0.2 0.3 0.4 0.5 1 4 7 10 13 16 19 22 25 28 31 34 37 40 Quarter age F re que nc y Fig. 5-5 for 1998
98Q2A1 0 0.05 0.1 0.15 0.2 0.25 1 4 7 10 13 16 19 22 25 28 31 34 37 40 Quarter age F re que nc y 98Q2A4 0 0.05 0.1 0.15 1 4 7 10 13 16 19 22 25 28 31 34 37 40 Quarter age F re que nc y 98Q2A5 0 0.05 0.1 0.15 0.2 1 4 7 10 13 16 19 22 25 28 31 34 37 40 Quarter age F re que nc y Fig. 5-6 for 1998
98Q3A2 0 0.1 0.2 0.3 0.4 1 4 7 10 13 16 19 22 25 28 31 34 37 40 Quarter age F re que nc y 98Q3A4 0 0.05 0.1 0.15 1 4 7 10 13 16 19 22 25 28 31 34 37 40 Quarter age F re que nc y 98Q3A5 0 0.05 0.1 0.15 0.2 1 4 7 10 13 16 19 22 25 28 31 34 37 40 Quarter age F re que nc y Fig. 5-7 for 1998
98Q4A2 0 0.05 0.1 0.15 0.2 0.25 1 4 7 10 13 16 19 22 25 28 31 34 37 40 Quarter age F re que nc y 98Q4A4 0 0.05 0.1 0.15 0.2 1 4 7 10 13 16 19 22 25 28 31 34 37 40 Quarter age F re que nc y 98Q4A5 0 0.05 0.1 0.15 0.2 1 4 7 10 13 16 19 22 25 28 31 34 37 40 Quarter age F re que nc y Fig. 5-8 for 1998
0
10
20
30
40
50
60
70
80
90
100
110
120
130
140
150
1981
1983 1985 1987 1989 1991
1993 1995 1997
Year
M
e
a
n
w
e
ig
ht
(
kg)
MW(1)
MW(2)
MW(3)
MW(4)
Fig. 6 Annual mean weight estimated from different methods: MW(1): mean weight estimated from LW
weighted by samples of each L; MW(2):mean weight transformed from mean length; MW(3):Totaal catch in weight/total catch in number; MW(4):Total catch in weight/total catch in number in TaskII.
0
5000000
10000000
15000000
20000000
25000000
1981 1983 1985 1987 1989 1991 1993 1995 1997
Year
Ca
tch
(
kg)
catch (3)
catch (4)
catch(1)
catch(2)
Fig. 7 Annual catch in weight estimated from different catch in number multiplying annual mean weights that