國
立 交 通 大 學
生物資訊研究所
碩士論文
Leu29 與 His93 位置之飽和定點突變抹香鯨肌紅蛋白對其
過氧化能力之影響
Mutational Analysis of Leu29 and His93 from Sperm
Whale Myoglobin on the Effect of Peroxidase Activity
研究生:
吳育勳
指導教授:
吳東昆 博士
Leu29 與 His93 位置之飽和定點突變抹香鯨肌紅蛋
白對其過氧化能力之影響
Mutational Analysis of Leu29 and His93 from Sperm
Whale Myoglobin on the Effect of Peroxidase Activity
研究生: 吳育勳 Student: Yu-Hsun Wu
指導教授: 吳東昆 博士 Advisor: Dr. Tung-Kung Wu
國 立 交 通 大 學
生物資訊研究所
碩士論文
A Thesis
Submitted to Department of Bioinformatics
College of Science
National Chiao Tung University
in partial Fulfillment of the Requirements
for the Degree of
Master
in
Bioinformatics
July, 2009
Hsinchu, Taiwan, Republic of China
中華民國九十八年七月
Leu29 與 His93 位置之飽和定點突變抹香鯨肌紅蛋
白對其過氧化能力之影響
研究生:吳育勳 指導教授:吳東昆 博士
國立交通大學 生物資訊研究所碩士班
摘要
肌紅蛋白(myoglobin)為一種血基質蛋白(heme-protein),在脊椎動物體內具 有儲存及攜帶氧氣的功能。本論文研究主要是將不具酵素活性的肌紅蛋白利用飽 和 定 點 突 變 成 H93X ; 及 將 具 有 過 氧 化 酵 素 (peroxidase) 活 性 的 突 變 H64D/V68L/I107M 肌 紅 蛋 白 , 再 Leu29 位 置 利 用 飽 和 突 變 技 術 改 變 L29X/H64D/V68L/I107M 這個推測可改變活性的胺基酸,以進一步分析比較這些 突 變 蛋 白 的 過 氧 化 酵 素 能 力 。 將 其 與 過 氧 化 氫 和 2,2’-azinobis (3-ethylbenzothiazoline-6-sulfonic acid),ABTS,反應後利用 UV-Vis 分光光譜儀偵測 並分析其一個電子傳遞的過氧化酵素活性與機制。發現四突變的過氧化氫催化能力不比三突變的活性差,但是對 ABTS 的催化活性不到三突變的一半,可得知
Leu-29 這位置對於 ABTS 進入反應中心有非常重要的調控機制。而 His-93 的突 變幾乎沒有活性,證明過氧化催化能力,主要取決於反應的環境,與鐵金屬的原 子軌域影響較小。
Multiple Sites Mutational Analysis of Sperm Whale
Myoglobin on the Effect of Peroxidase Activity
Student: Yu-Hsun Wu Advisor: Dr. Tung-Kung Wu
Institute of Bioinformatics and Systems Biology
National Chiao Tung University
Abstract
Myoglobin (Mb) is a heme-protein, functioning as oxygen carrier in vertebrates. In previous study, MbH64D/V68L/I107M had been engineered into an enzyme with peroxidase activity. We further investigated the L29X/H64D/V68L/I107M and site-saturated H93X mutational effects on peroxidase activity. A well established peroxidase activity with one-electron oxidation reacted with 2’-azinobis (3-ethylbenzothiazoline-6-sulfonic acid) (ABTS) was observed by the UV/Vis spectrophotometer and demonstrated its capability in electron transfer reaction. When ABTS was used as substrate, the results showed that the activity of quadruple mutants was less than triple mutant, indicating the important role of Leu-29 in maintaining peroxidase function, especially the catalysis of ABTS. The catalyses of H2O2 of
MbL29I/H64D/V68L/I107M, MbL29F/H64D/V68L/I107M, and MbL29M/H64D/V68L/I107M were as good as that of triple mutants. The H93X mutants exhibited no activity, indicating that the peroxidase activity was related with the environment.
Contents
1. Introduction 1-1 Myoglobin ... 1 1-2 Heme proteins ... 2 1-3 Peroxidase ... 4 1-4 Mutated Myoglobin ... 61-5 Peroxidase Cycle of Mutated Mb ... 10
1-6 Enzyme Kinetics ... 11
1-7 Research Goal ... 14
2Materials and Methods ... 21
2-1 Materials ... 21
2-1-1 Chemicals ... 21
2-1-2 Buffers and Reagents ... 23
2-1-3 Equipments ... 25
2-1-4 Bacterial strains, vectors, animal, and cell ... 25
2-2 Method ... 26
2-2-1 Molecular modeling ... 26
2-2-2 Preparation of Myoglobin Variants ... 26
2-2-3 Preparation of Clones ... 31
2-2-4 Preparation of SDS-polyacrylamide gel electrophoresis (SDS-PAGE) ... 31
2-2-5 Protein detection ... 32
2-2-6 Crude Extract ... 34
2-2-7 Expression of Apo-Mb ... 35
2-2-8 Crude extract of inclusion body ... 35
2-2-9 Denature and refolding of inclusion body ... 36
2-2-10 Purification of Apo-Mb ... 36
2-2-11 Reconstitution of Apo-Mb with heme ... 37
2-2-12 Analysis of Peroxidase Activity ... 38
3 Results and Discussion ... 39
3-1 All clones ... 39
3-2 Protein detection ... 41
3-3 Activity Test of Crude Extract ... 42
3-4 Purification of mutated Mbs ... 46
3-5 Reconstitution of mutated Mbs ... 48
3-6 Enzyme kinetics measurements ... 50
5 References ... 62 6 Appendix ... 64
Figures
Figure. 1 The structure of Myoglobin ... 1
Figure 2. The structure of heme... 2
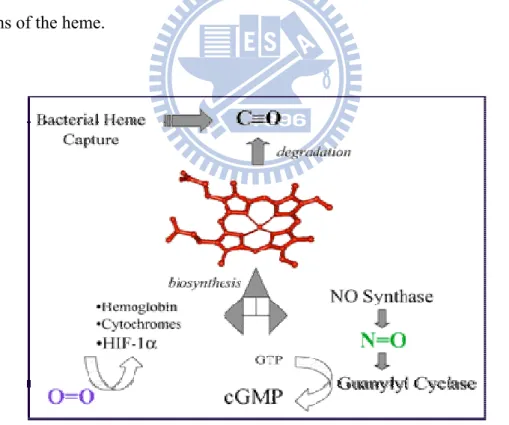
Figure 3. The functions of heme protein ... 3
Figure 4. The proposed mechanism of compound I formation. The distal histidine first functions as a general base, and then the protonated imidazole serves as a general acid to cleave the O-O bond. 4 ... 5
Figure 5. Comparison of reaction cycles of peroxidase and cytochrome P450. Compound I, a ferryl porphyrin radical cation, is a critical catalytic species for both hemoenzymes 4. ... 6
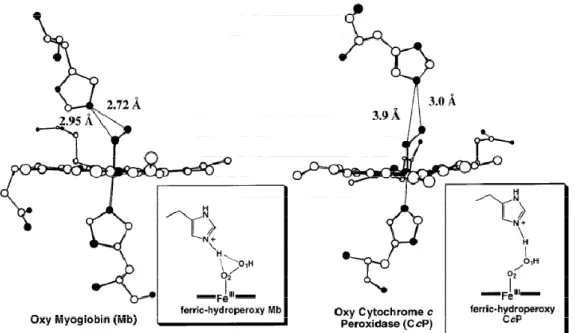
Figure 6. X-ray crystal structures of oxy forms of cytochrome c peroxidase mutant (W191F CcP) and myoglobin (Mb).4 ... 7
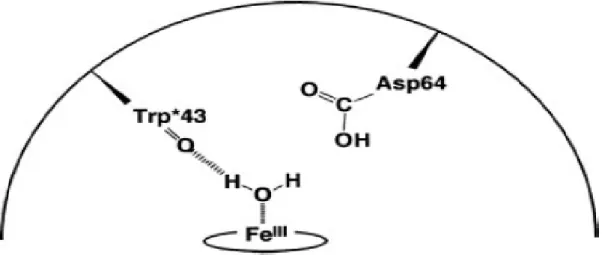
Figure 7. The Asp-64 effect of resting state9 ... 8
Figure 8. Using known changes in valency of the heme iron, one can the derive functional cycle12. ... 10
Figure 9. Chemical formulae of ABTS and its oxidation products14 ... 11
Figure 10. Michaelis-Meten plot ... 13
Figure 11. Lineweaver-Burk plot ... 14
Figure 12. MbCO structure showing juxtaposition of Val 68 on the bound CO, and the steric interactions path through Leu69 to Val17, at the AB corner.17 ... 18
Figure 13. The distance of MbWT crystal structure (PDB: 104M)(white one) and molecule modeling of MbV17W(yellow one) ... 19
Figure 14. Illustration of the Phe 43 and 46 displacements, and the connecting CD loop17 ... 20
Figure 15. Amino acid residues mutation in sperm whale Mb. ... 20
Figure 16. Western blotting experiments for clone expression ... 42
Figure 17. Comparisons of (a) wavelength scan and (b) peroxidase activity of crude extract from MbH64D/V68L/I107M clone (red) and BL-21 without insert (black) ... 44
Figure 18. (a) The peroxidase activity of MbL29X/H64D/V68L/I107M clones. (b) The activity of H93X clones. (c) The peroxidase activity of V17W, F43Y, and F46Y clones. ... 46
Figure 19. 20% SDS-PAGE analysis of purified mutated apoMb. (a) Lane M: marker, lane 1:before adding IPTG, lane 2:after IPTG induced, and lane 3:purified 17kDa Mb. (b) Lane M:marker, lane 1:MbWT, lane 2: MbH64D/V68L, lane 3:MbH64D/V68L/I107M, lane 4:MbV17W, lane 5: MbL29C/H64D/V68L/I107M, lane 6:MbL29F/H64D/V68L/I107M, lane 7: MbL29I/H64D/V68L/I107M, and lane 8:MbL29M/H64D/V68L/I107M ... 48
Figure 20. The UV-visible spectra of reconstituted MbH64D/V68LI107M and Apo-MbH64D/V68L/I107M in 100 mM potassium phosphate buffer at pH 7.0 ... 49
Figure 21. The absorbance change at 730 nm for MbH64D/V68LI107M, Apo-MbH64D/V68L/I107M, and heme in 100 mM potassium phosphate buffer at pH 7.0 ... 50
Figure 22. General reaction cycles of heme proteins with peroxide9 ... 53
Figure 23. The catalytic efficiency of ABTS ... 55
Figure 24. The catalytic efficiency of H2O2 ... 55
Figure 25. The shortest distance of Leu-68 and Val-68 to iron atom by crystal of MbV68L(PDB: 1MLQ) and MbWT(PDB: 104M) ... 57
Figure 27. The Soret band of L29X/H64D/V68L/I107M clones ... 65 Figure 28. The Soret band of H93X clones ... 67 Figure 29. The Soret band of V17W, F43Y, and F46Y clones ... 68 Figure 30. The Michaelies-Menten plot of mutant myoglobin catalyzing different
concentration of ABTS, and the Lineweaver-Burk plot of mutant myoglobin for calculating K’m and V’max. (a) MbH64D/V68L(b)
MbH64D/V68L/I107M(c) MbL29M/H64D/V68L/I107M(d) MbL29C/H64D/V68L/I107M (e)
MbL29F/H64D/V68L/I107M (f) MbL29I/H64D/V68L/I107M (g) MbV17W ... 75
Figure 31. The Michaelies-Menten plot of mutant myoglobin catalyzing different concentration of H2O2, and the Lineweaver-Burk plot of mutant
myoglobin for calculating K’m and V’max. (a) MbH64D/V68L(b)
MbH64D/V68L/I107M(c) MbL29M/H64D/V68L/I107M(d) MbL29C/H64D/V68L/I107M (e)
Scheme and Table
Scheme 1. Experimental procedures-1 ... 26
Scheme 2. Experimental procedures-2 ... 34
Scheme 3. Experimental procedures-3 ... 35
Scheme 4. Experimental procedures-4 ... 37
Scheme 5. Experimental procedures-5 ... 38
Scheme 6. Heme dependence of tryptophan oxidation9 ... 49
Scheme 7. The rates of the slow kinetic processes were made based on a simple reaction scheme. 10 ... 52
Table 1. The residues and distances away from iron atom of the wild type of sperm Mb. ... 17
Table 2. The His-93 mutants and distances away from iron atom ... 17
Table 3. Primer design for site-saturated mutagenesis ... 27
Table 4. QuikChange Site-Directed Mutagenesis Kit PCR composition ... 29
Table 5. QuikChange Site-Directed Mutagenesis Kit program ... 29
Table 6. QuikChange Site-Directed Mutagenesis Kit PCR products digestion ... 30
Table 7. 20% separating gel and 4% stacking gel of SDS-PAGE ... 32
Table 8. List of all clones. ... 40
Table 9. Kinetic data of ABTS by mutated Mb ... 54
Table 10. Kinetic data of H2O2 by mutated Mb ... 54
Table 11. Possibly homologous residues of Mb and CPO ... 61
1. Introduction:
1-1 Myoglobin
Myoglobin (Mb) was the first breakthrough towards understanding the three-dimensional structure of a globular protein by using x-ray diffraction studies developed by John Kendrew in the 1960s.1 Mb is a single-chain globular protein (44 x 44 x 25 Å) made up 153 amino acids. The molecular weight is approximately 16,700 Daltons. It is composed of eight alpha helices (75 percent), named A-H, and it has a hydrophobic core (Fig.1). Mb is a relatively small oxygen-carrying pigment of muscle cells, and it is particularly abundant in the muscles of diving mammals such as the sperm whale. It contains a heme (iron-containing porphyrin) prosthetic group in its center, around which the remaining apo-protein folds. The same heme group is found in hemoglobin (Hb), the oxygen-binding protein of erythrocytes, and is responsible for the deep red-brown color of both Mb and Hb.2
.
The flat heme group rests in a crevice, or pocket, within the myoglobin molecule.3(Fig. 2) The iron atom is at the center of the heme group, a large heterocyclic organic ring known as a porphyrin, has two bonding (coordination) positions perpendicular to the heme plane. One of these is bound to the R group of the Histidine residue at position 93 in sperm whale Mb; the other is the site at which an O2 molecule binds. Within this pocket, the accessibility of the heme group to
solvent is highly restricted. Free heme groups in an oxygenated solution are rapidly oxidized from the ferrous form, which is active in the reversible binding of O2, to the
ferric form that does not bind O2.
Figure 2. The structure of heme
1-2 Heme proteins
The four principal biological functions of heme proteins are the transport of oxygen (e.g., hemoglobin, Mb), the transport of electrons (e.g., cytochrome b5), the catalysis of redox reactions (e.g., horseradish peroxidase, cytochrome P450, catalase), and the sensing of oxygen, carbon monoxide (e.g., FixL, CooA) or nitric oxide4 (Fig. 3). A common strategy used for structure-function studies of a particular enzyme involve substitution of amino acid residues followed by investigations into the effect(s) caused by thosee substitution(s) on the catalytic activity4. The electron carrier
hemoproteins have two strong axial ligands. The coordination site on the distal side of the heme pocket is either vacant or occupied by a water molecule, which is easily exchanged for other ligands such as an oxygen molecule. A histidine residue on the proximal side serves as one of the axial ligands, and the distal histidine stabilizes binding of O2 through a hydrogen-bonding interaction. The heme in FixL, an
oxygen-sensing hemoprotein, appears to have one accessible coordination site, as observed in globins. CooA from Rhodospirillum rubrum, which regulates the expression of coo operons with carbon monoxide as an effecter, is another sensor hemoprotein that plays a role in homeostasis. Despite the differences in functions, all of these proteins have an iron protoporphyrin IX (heme) as a prosthetic group. The amino acid residues surrounding the prosthetic group appear to control the intrinsic functions of the heme.
1-3 Peroxidase
Horseradish peroxidase (HRP) is a common peroxidase enzyme. Generally speaking, peroxidases react with H2O2 to produce a species known as compound I, an
oxoferryl (O=FeIV) species paired with a porphyrin radical cation4. On the basis of such evidence, Michaelis and Menten showed that such relationships could be explained by the assumption that an intermediate compound of enzyme and substrate was formed: E + S→ ES → E + P5. During compound I formation (Fig. 4), the distal histidine first serves as a general base to allow the binding of H2O2 to the iron
embedded in the heme. The protonated distal histidine then transfers the proton to the single protonated oxygen atom of the bound HO2-. Heterolytic O-O bond cleavage
results in the release of a water molecule. The positively charged distal arginine also contributes to this process in polarization of the O-O bond. The combination of catalytic functions in the distal histidine and arginine residues has been described as the “pull effect”. On the other hand, the cytochrome P450 monooxygenases bind O2
instead of H2O2 and require the input of two electrons for the formation of a putative
hydroperoxide bound to the iron. Heterolytic O-O bond cleavage generates a highly reactive catalytic species equivalent to compound I. The cytochrome P450 monooxygenase reaction cycle differs from that of the peroxidases in that the oxo-ferryl oxygen atom is transferred to the substrates.4
Figure 4. The proposed mechanism of compound I formation. The distal histidine first functions as a general base, and then the protonated imidazole serves as a general acid to cleave the O-O bond. 4
Figure 5 illustrates the overlapping nature of the various types of reactive intermediates involved in peroxidase and monooxygenase chemistry. Structural features of the cytochrome P450s include a cysteine thiolate ligand, the absence of obvious catalytic functional residues in the distal heme pocket, and the presence of a water shuttle pathway from the exterior of the protein to the distal heme pocket. The catalytic efficiency of the cytochrome P450s has long been attributed to O-O bond cleavage induced by strong electron donation of the thiolate ligand. It called “push effect”. The transition from compound I to compound II is a reduction process: Compound I + AH2 → Compound II + AH, and the transition from compound II to
Figure 5. Comparison of reaction cycles of peroxidase and cytochrome P450. Compound I, a ferryl porphyrin radical cation, is a critical catalytic species for
both hemoenzymes 4. 1-4 Mutated Myoglobin
Ozaki et al. have attempted to convert a non-enzymatic heme protein, (i.e., Mb) into a heme enzyme (i.e., peroxidase). This strategy provided valuable insight into the general structural requirements for the activation of H2O4.
They proved that the distal histidine of sperm whale Mb (i.e., His-64) is a critical residue for activating H2O2 and for destabilizing a ferryl porphyrin radical cation,
compound I. However, compound I could not be produced in the wild type Mb7. After comparing the crystals of Mb and W191F Cytochrome C Peroxidase(CcP), the distances between Nεof the distal histidine and the oxygen atoms of oxy-Mb were
determind to be 2.7 Å for the terminal oxygen atom (O1) and 3.0 Å for the oxygen
atom bound to the iron (O2), while the values for oxy-W191F CcP were 3.0 and 3.9 Å,
respectively.(Fig. 6) It is expected that when CcP reacts with H2O2, the protonated
imidazole forms a hydrogen bond only with the terminal oxygen atom (O1) during
with H2O2, both oxygen atoms would be positioned to accept a proton from Nε of the
distal histidine. It is considered that this arrangement is responsible for the poor reactivity of Mb with H2O24. Replacement of His-64 with a hydrophobic amino acid
such as Ala significantly decreases the reactivity of H2O2.7,8 Moreover, Pfister et al.
set forth the following conclusion9. A water molecule may provide the sixth ligand and result in a less reactive ferric state (Fig. 7). Compound I has been successfully observed for the distal histidine deletion mutants. This result was obtained by Alayash
et al10. In constrast, compound I of the wild type Mb was not detected with H2O2
because of its simultaneous decay to compound II (i.e., a ferryl species).
Figure 6. X-ray crystal structures of oxy forms of cytochrome c peroxidase mutant (W191F CcP) and myoglobin (Mb).4
Figure 7. The Asp-64 effect of resting state9
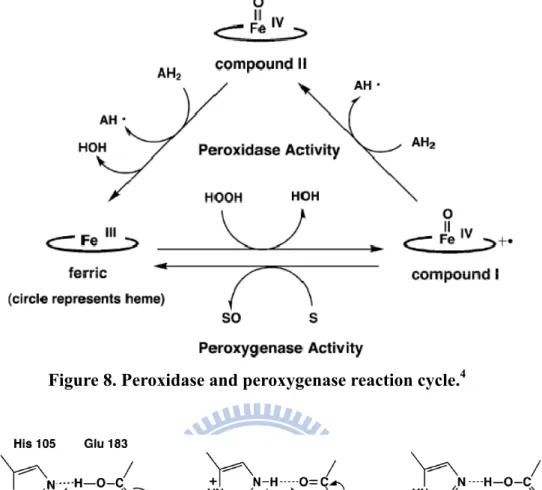
Interestingly, the substitution of His-64 with a negatively charged aspartate residue accelerated the reaction with H2O2 and improved peroxidase (i.e.,
one-electron oxidation) and peroxygenase activity (i.e., two-electron oxidation associated with a ferryl oxygen transfer) (Fig. 8). Additional H-bonding may also be provided by Asp-64. Among the distal histidine deletion mutants, MbH64D is the best enzyme engineered to date for oxidation in the presence of H2O2. Ozaki et al. found
that the distal histidine of Mb can be replaced with Asp to mimic chloroperoxidase (CPO), in which Glu-183 and His-105 function cooperatively as catalytically important amino acids in compound I formation (Fig. 9). This process may be mediated by similar mechanisms to peroxidase activity.
Figure 8. Peroxidase and peroxygenase reaction cycle.4
Figure 9.Possible Functions of Chloroperoxidase (CPO) Glu-183 in Compound I Formation11
Previously mutagenesis of Val-68 in MbH64D was carried out to improve the enantioselectivity since residue 68 as well as residue 64 (i.e., His-64 and Val-68 in wild-type Mb) is known to influence the association and dissociation rate constants for ligand binding (e.g., O2 and CO). The replacements of Val-68 with Leu in MbH64D
successfully improved the peroxidase activity and enhanced the peroxygenase activity.
1-5 Peroxidase Cycle of Mutated Mb
In its natural state, the ferrous-dioxygen, iron(II), bond in Mb plays a vital role in their physiological functions. However, the iron of heme on the peroixdase cycle begins from ferric, iron(III). There are two ways by which iron(II) is led to iron(III). First, during reversible oxygen binding, the oxygenated form of myoglobin or hemoglobin is oxidized easily to the ferric met form, subsequently causing the generation of the superoxide anion12. Second, where equation 1 represents the primary formation of ferryl-Mb(IV) from deoxy-Mb(II), which is in equilibrium with MbO2, a
two-equivalent oxidation occurs with H2O2. Once the ferryl species is formed, it
rapidly reacts with another deoxy-Mb so as to yield 2 units of metMb.13 After leading iron(II) to iron(III), the Mb mutants initiat the peroixdase cycle. Mb mutants react with H2O2 to give a two-electron oxidized heme (compound I), which is normally a
ferryl porphyrin cation radical (FeIV=O Por+‧) followed by the addition of a reduced 2,2'-azino-bis(3-ethylbenzthiazoline-6-sulphonic acid) (ABTS) and the loss of one-electronequivalent-oxidized ABTS to yield compound II. Further addition of ABTS and release of the ABTS radical then regenerates iron(III) (Fig. 8)11,14.
Figure 8. Using known changes in valency of the heme iron, one can the derive functional cycle12.
MbO2 ↔ Mb(II) + O2
Mb(II) + H2O2 → ferryl-Mb(IV) + 2OH
-MbIV+ MbII → 2MbIII
Equation 1 The metMb formation by ferryl-Mb(IV)13
ABTS is commonly used as a substrate of H2O2 for the peroxidase enzyme. The
absorbance change at 405 nm and 730 nm (ε= 1.4x 10⁴ M-1 cm-1) can be easily analyzed with a spectrophotometer.
Figure 9. Chemical formulae of ABTS and its oxidation products14
1-6 Enzyme Kinetics
The central approach used for studying the mechanism of an enzyme-catalyzed reaction is to determine the rate of the reaction. Enzyme kinetics is the study of the chemical reactions that are catalyzed by enzymes, with a particular focus on their reaction rates.
Because enzymes are not consumed by the reactions they catalyze, enzyme assays usually trace concentration changes of either substrates or products to obtain accurate measurements of the reaction. Spectrophotometric assays are the most
convenient measurements.
A key factor affecting the rate of a reaction catalyzed by an enzyme is the concentration of the substrate [S]. One simplified approach in kinetics experiments is to measure the initial rate, designated V0. As enzyme-catalyzed reactions are saturable,
their rate of catalysis does not show a linear response to increasing substrate concentrations. If the initial rate of the reaction is measured over a range of [S], the V0
increases as [S] increases (as shown on the right). However, as [S] gets higher, the enzyme becomes saturated with substrate and the rate reaches the enzyme's maximum rate, Vmax.
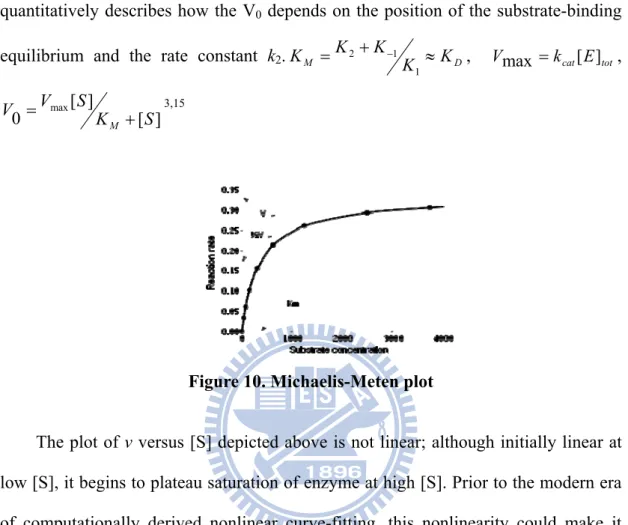
The Michaelis-Menten kinetic model of a single-substrate reaction and a single intermediate complex is shown Figure 10. Some enzymes, that have more than one substrate, do not fit this single-substrate mechanism. Peroxidase is an example of this; as the enzyme reacts with a first H2O2
substrate molecule, it becomes compound I and is then reduced by a second molecule of substrate. Although a single substrate is involved, the existence of a modified enzyme intermediate means that the mechanism of peroxidase is actually a ping–pong mechanism. Peseudo single-substrate reactions and multi-substrate reactions are thus grouped as single-substrate reaction. An initial bimolecular reaction occurs between the enzyme E and substrate S leading to the formation of the enzyme–substrate complex ES. Typically, one rate-determining enzymatic step allows this reaction to be modeled as a single catalytic step with an apparent unimolecular rate constant, kcat.
If the reaction pathway proceeds over one or several intermediates,
kcat will be a function of several elementary rate constants; whereas in the simplest
case of a single elementary reaction kcat will be identical to the elementary
unimolecular rate constant k2. The apparent unimolecular kcat rate constant is also
P E ES S E K K K ⎯⎯→ + ⎯ ⎯→ ← + − 2 1 1 P E ES⎯K⎯→⎯cat +
known as the turnover number and denotes the maximum number of enzymatic reactions able to be catalyzed per second. The Michaelis–Menten equation quantitatively describes how the V0 depends on the position of the substrate-binding
equilibrium and the rate constant k2.KM =K +K− K ≈KD
1 1 2 , , tot cat E k Vmax = [ ] ] [ ] [ 0 Vmax S K S V M + = 3,15
Figure 10. Michaelis-Meten plot
The plot of v versus [S] depicted above is not linear; although initially linear at low [S], it begins to plateau saturation of enzyme at high [S]. Prior to the modern era of computationally derived nonlinear curve-fitting, this nonlinearity could make it difficult to estimate Km and Vmax accurately. Therefore, several researchers developed
linearizations of the Michaelis-Menten equation, such as the Lineweaver–Burk plot. This linear type of representation continues to be useful for initial visualization of the data, but should not be used to determine kinetic parameters. As computer software is now readily available more accurate determination by nonlinear regression methods can be easily achieved. The Lineweaver–Burk plot, or double reciprocal plot is a common way of illustrating kinetic data and is produced by taking the reciprocal of both sides of the Michaelis–Menten equation. As shown on the right, the linear form of the Michaelis–Menten equation produces a straight line via the equation y = ax + b where the y-intercept is equivalent to 1/Vmax and the x-intercept of the graph
represents -1/Km.(Fig. 11) max max 1 ] [ 1 V S V K V = m + 3,15
Figure 11. Lineweaver-Burk plot 1-7 Research Goal
The non-enzymatic myoglobin was functionally converted into a heme enzyme with peroxidase activity. In a previous study, an MbH64D/V68L/I107M enzyme with peroxidase activity had been engineered. This mutant version of myoglobin was capable of over-expression and, hence, purification. The activity of MbH64D/V68L/I107M was determined to be approximately 30% of H2O2 and 60% of ABTS better than that
of MbH64D/V68L.16
The Ile-107 was located 6.8Å away from the iron of heme. When the Ile-107 was replaced with Met, the peroxidase activity of mutated Mb was further improved. The distance between each residue and the center of heme has been summarized in Table 1. The Leu-29 was located 7.64Å away from the iron of heme. Alayash et al. determined that the Leu-29 affected the binding activity of O2 with heme10. We believe this
residue may have an important role in mediating peroxidase activity. To examine this hypothesis, we engineered the Leu-29 to construct MbL29X/H64D/V68L/I107M.
Residue number Residue name Nearly atom Distance Residue number Residue name Nearly atom Distance Residue number Residue name Nearly atom Distance
1 Val CG1 -25.02 52 Glu OE2 20.47 103 Tyr OH -12.87 2 Leu CD1 -21.05 53 Ala CB 23.68 104 Leu CD2 -6.54 3 Ser OG -28.16 54 Glu OE1 21.17 105 Glu OE2 -17.46
4 Glu OE2 -27.26 55 Met CE 16.06 106 Phe CD2 12.84 5 Gly CA -28.67 56 Lys NZ 21.25 107 Ile CD1 6.76 6 Glu OE2 -26.5 57 Ala CB 21.56 108 Ser OG -11.7 7 Trp CH2 -18.96 58 Ser OG 15.55 109 Glu OE2 17.08 8 Gln NE2 29.89 59 Glu OE2 18.92 110 Ala CB 12.8 9 Leu CD2 27.28 60 Asp OD2 12.73 111 Ile CD1 10.53
10 Val CG1 18.79 61 Leu CD1 10.79 112 Ile CD1 17.33
11 Leu CD2 19.64 62 Lys NZ 19.57 113 His NE2 20.89
12 His ND1 27.01 63 Lys NZ 15.55 114 Val CG2 16.19
13 Val CG2 20.39 64 His CD2 8.48 115 Leu CD2 17.25 14 Trp CH2 13.11 65 Gly CA 9.56 116 His NE2 25.89
15 Ala CB 22.86 66 Val CG1 13.08 117 Ser OG 21.27 16 Lys NZ 27.49 67 Thr CG2 7.15 118 Arg NH2 19.52 17 Val CG1 15.96 68 Val CG2 4.99 119 His NE2 20.7 18 Glu OE2 16.25 69 Leu CD2 10.32 120 Pro CD 26.38 19 Ala CB 22.75 70 Thr OG1 12.44 121 Gly CA 29.08 20 Asp OD1 19.63 71 Ala CB 7.89 122 Asp OD2 27.24 21 Val CG1 13.9 72 Leu CD1 10.4 123 Phe CZ 20.28 22 Ala CB 16.56 73 Gly CA 13.49 124 Gly CA 27.54 23 Gly CA 17.5 74 Ala CB 13.52 125 Ala CB 28.7
24 His ND1 17.93 75 Ile CD1 -10.1 126 Asp OD1 28.5 25 Gly CA 12.16 76 Leu CD2 -15.02 127 Ala CB 24.54 26 Gln OE1 17.37 77 Lys NZ 18.69 128 Gln OE1 23.08 27 Asp OD1 17.94 78 Lys NZ -20.08 129 Gly CA 23.7 28 Ile CG2 10.73 79 Lys NZ -25.64 130 Ala CB 23.2 29 Leu CD2 7.64 80 Gly CA -19.4 131 Met CE 17.6 30 Ile CG1 15.2 81 His ND1 -22.87 132 Asn OD1 18.66 31 Arg NH1 18.98 82 His ND1 -15.76 133 Lys NZ -26.19 32 Leu CD2 8.35 83 Glu OE1 -20 134 Ala CB -17.52 33 Phe CZ 9.33 84 Ala CB -17.44 135 Leu CD1 14.03 34 Lys NZ 21.19 85 Glu OE2 -16.73 136 Glu OE2 -19.09
35 Ser OG 17.21 86 Leu CD1 -12.72 137 Leu CD1 -18.88
36 His NE2 15.61 87 Lys NZ -17.63 138 Phe CZ -8.17 37 Pro CG 17.72 88 Pro CB -11.24 139 Arg NH2 -14.07
38 Glu OE1 15.62 89 Leu CD1 -6.2 140 Lys NZ -21.4 39 Thr CG2 10.72 90 Ala CB -10.76 141 Asp OD2 -17.03
40 Leu CD1 12.3 91 Gln NE2 -13.71 142 Ile CD1 -9.6 41 Glu OE1 16.17 92 Ser OG -6.79 143 Ala CB -15.44 42 Lys NZ -11.36 93 His NE2 -2.18 144 Ala CB -18.04 43 Phe CZ 5.25 94 Ala CB -11.24 145 Lys NZ -16.77 44 Asp OD2 13.14 95 Thr OG1 -12.5 146 Tyr OH -8.47 45 Arg NH1 10.88 96 Lys NZ -10.07 147 Lys NZ -23.24 46 Phe CE2 8.94 97 His NE2 -5.69 148 Glu OE1 -19.11
47 Lys NZ 13.86 98 Lys NZ -14.52 149 Leu CD1 -14.36
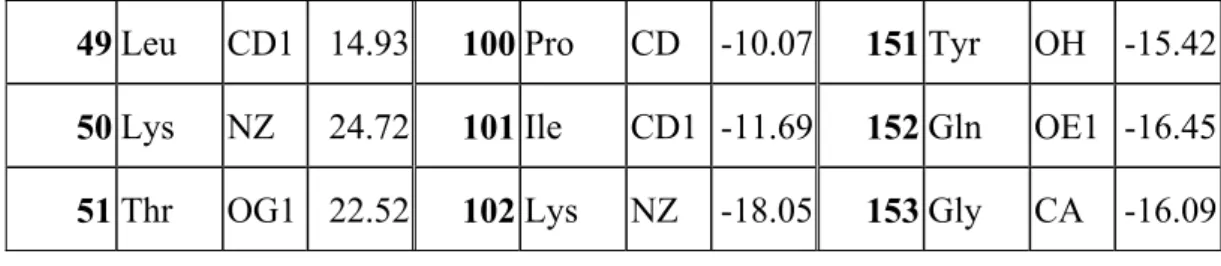
49 Leu CD1 14.93 100 Pro CD -10.07 151 Tyr OH -15.42 50 Lys NZ 24.72 101 Ile CD1 -11.69 152 Gln OE1 -16.45
51 Thr OG1 22.52 102 Lys NZ -18.05 153 Gly CA -16.09 Table 1. The residues and distances away from iron atom of the wild type of
sperm Mb.
When CO binds and later leaves the heme, the distance between the His-93 and the iron of heme becomes longer and shorter respectively. His-93, which binds the heme directly, could affect the position of iron17. We performed the molecular
modeling of H93X, first. Next, we identified some mutants close to the heme that may affect the steric and electric orbital existence of iron(Table 2). We then engineered the His93 to construct MbH93X.
Mutant Distance(Å) Atom Mutant Distance(Å) Atom H93H 2.08 NE2 H93I 6.32 CG2 H93A 6.62 CB H93N 5.66 ND2 H93F 2.19 CZ H93W 5.54 CH2 H93E 2.79 OE2 H93V 6.37 CG1 H93D 6.91 OD1 H93T 5.7 OG1 H93C 6.02 CB H93S 7.54 OG H93G 7.22 O H93R 2.19 NH2 H93M 4.12 CE H93Q 2.47 NE2 H93L 5.42 CD2 H93P 6.85 CG H93K 2.39 NZ H93Y 2.74 OH
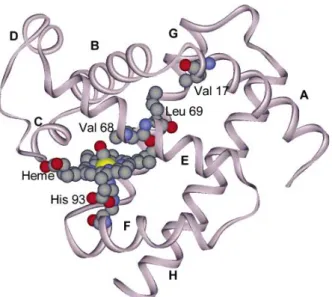
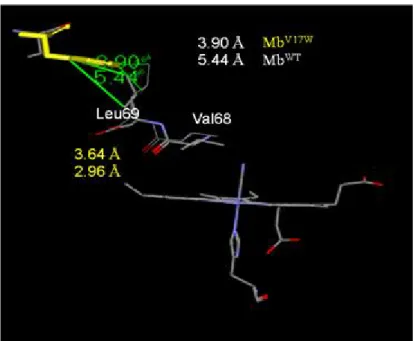
Alayash et al. additionally found that MbV68L exhibited peroxidase activity10. The Val17 in helix A, which acts as a steric interaction path by which Leu-69 is to Val-68 at helix E (Fig. 12), is changed to Trp for different size17. We expect the Val68 will close the iron atom if we change the size of amino residue 17. We compared the distance of Val17 to Leu69 and Trp17 to Leu69. The distance of V17W was determined to be shorter than that of the wild type(Fig. 13), similar to Val-68 → Leu. We then performed molecular modeling of V17W.
Figure 12. MbCO structure showing juxtaposition of Val 68 on the bound CO, and the steric interactions path through Leu69 to Val17, at the AB corner.17
Figure 13. The distance of MbWT crystal structure (PDB: 104M)(white one) and molecule modeling of MbV17W(yellow one)
The physical mechanism involved non-bonded contact of the water molecule with the side chains of the CD loop residues Phe-43 and Phe-46, which moved out away when the H2O molecule was introduced (Fig. 14)17. When Phe-43 and Phe-46
were replaced with Tyr, the protein character was transformed from hydrophobic to hydrophilic, and we expected enhancement of the H2O2 binding ability.
Figure 14. Illustration of the Phe 43 and 46 displacements, and the connecting CD loop17
We conjectured these mutants could affect the peroxidase activity of Mb so we summarized the relative positions of these mutants. (Fig. 15).
2Materials and Methods
2-1 Materials 2-1-1 Chemicals
Acetic acid (Merck)
40% Acrylamide (GE Healthcare) Agarose (USB)
APS (GE Healthcare)
2,2,-azino-bis(3-ethybenthiazoline 6-sulfonic acid) (ABTS) (Sigma) BactoTM Agar (DIFCO)
Bromophenol blue (USB) Citric acid (Sigma)
Coomassie® Brilliant blue R 250 (Merck) Dimethyl sulfoxide (MP Biomedicals) DEAE sepherose (Bio-Rad)
Dodecyl sulfate sodium salt (Merck)
dNTP Set, 100 mM Solutions (GE Healthcare) Ethylenediamine-tetraacetic acid (Merck) Glycerol (Merck)
Glycine (Merck)
Guanidine hydrochloride (Gdm-HCl) (Sigma) Hydrogen chloride (Merck)
IPTG (GeneMark, Taiwan) Kanamycin sulfate (USB) LB Broth, Miller (DIFCO) 2-mercaptoethanol (Merck)
Methanol (Merck)
N,N’-methylene-bis-acrylamide (Bis-Acrylamide)(Sigma)
Potassium chloride (Merck) Potassium diphosphate (Merck) Potassium phosphate (Merck) Primers (Bio Basic Inc., Taiwan)
Restriction enzymes (New England Biolabs) Sodium azide (Merck)
Sodium chloride (AMRESCO) Sodium hydroxide (Merck) Sodium diphosphate (Merck) Sodium phosphate (Merck) SYBR® Green I (Roche) T4 DNA ligase (Promega) TEMED (GE Healthcare) Tris base (USB)
BCA Protein Assay Reagent and Albumin Standard (PIERCE)
BigDye® Terminator v3.1 Cycle Sequencing Kit (Applied Biosystems) CNBr-activated Sepharose 4B(GE)
GFXTM PCR DNA and Gel Band Purification Kit (GE Healthcare) LMW-SDS Marker Kit (GE Healthcare)
Plasmid Miniprep Purification Kit (GeneMark)
rTth DNA polymerase, XL & XL Buffer II Pack (Applied Biosystems) QuickChange Site-Directed Mutagenesis Kit (Stratagene)
2-1-2 Buffers and Reagents
50X TAE Buffer:
242 g Tris base,57.1 mL acetic acid,0.5 M EDTA in 1 L H20,[pH=8.5]
6X DNA loading dye:
0.25% bromophenol blue, 30% glycerol, stock at -20℃ 30% Acrylamide Mix:
40% acrylamide 750 mL,10 g bis-acrylamide in 1 L ddH20, stock at 4 °C in
dark place
Separation Gel Buffer:
1 M Tris pH 8.8, stock at 4 ℃ Stacking Buffer:
1 M Tris pH 6.8, stock at 4 ℃ 20% SDS:
20 g SDS, in 100 mL H20, tock at room temp.
10X Running Buffer:
144 g glycine, 30 g Tris-base,10 g SDS, in 1 L H20, stock at 4 ℃.dilute it to
1X
5X Sample Buffer:
1 mL 1M Tris-HCl (pH 6.8), 0.8 mL glycerol, 1.6 mL 10% SDS, 0.4 mL 2-mercaptoethanol, 0.05% bromophenol blue, in 8 mL H20
0.1% Coomassie blue R-250 Stain Solution:
1 g Coomassie brilliant blue R-250, in 400 mL methanol, with 100 mL acetic acid, in 1 L H20
Destain Solution I:
Destain Solution II:
50 mL methanol, 70 mL acetic acid, in 1 L H20
Lysis buffer:
Tris-HCl 100mM, KCl 100mM and EDTA 1mM, pH 8.0 Solubilization buffer Tris-HCl 100 mM, pH 8.0, Gdm-HCl 8 M Disruption buffer Tris-HCl 100 mM, pH 8.0 Equilibration buffer: Sodium phosphate 50 mM, pH 7.2 Luria-Bertani medium
10 g Bacto-Tryptone, 5 g yeast extrac, 5 g NaCl, in 1 L H20
IPTG
IPTG (isopropyl β-D-thiogalactoside) solute in ddH20, filtered through a
0.22 μm cellulose acetate filter, stock at -20 °C Tetracycline
Tetracycline 20 mg/m with Ethanol, -20 °C LB-Tet medium
Agar 15 g/1L LB medium with 1 mL Tetracycline at 4 °C, in dark Kanamycin (25 mg/mL)
250 mg kanamycin sulfate with 10 ml ddH20, filtered through a 0.22 μm
cellulose acetate filter, stock at -20 °C LB-Kan medium
2-1-3 Equipments
DC120 Kodak Electrophoresis Documentation and Analysis System 120(Kodak) ABI PRISM® 3100 Genetic Analyzer (Applied Biosystems)
Orbital shaking incubator Model-S302R (Firstek Scientific) AllegraTM 21R Centrifuge (Beckman)
Avanti® J-E Centrifuge (Beckman) Centrifuges 5415R (Eppendorf) Spin Vaccum SPD-111V (SAVANT) DU-7500 spectrophotometer (Beckman) Amicon (Ultrafiltration System)
Packard (Fusion Universal Microplate Analyzer) GeneAmp® PCR System 9700(Applied Biosystems) Amersham Pharmacia
8453 UV-Visible Spectrophotometer (Agilent Technologies)
2-1-4 Bacterial strains, vectors, animal, and cell
Escherichia coli XL1-Blue (Stratagene) Escherichia coli BL21(DE3) (Novagen)
2-2 Method
2-2-1 Molecular modeling
‧ Molecular-modeling studies were performed, using the DiscoveryStudio program with X-ray structure of wild type Mb as the template. We inputted mutant Mb and counted by the program. This software are provided by National Center for High-Performance Computing (NCHC) institution.
2-2-2 Preparation of Myoglobin Variants
pET28-H64D/V68L/ I107M Mb + L29X primer pET28-wild Mb + H93X, V17W,F43Y,F46Y primer
PCR E.coli strain XL1-Transform into
blue Getting the plasmid and sequencing analysis Transform into E.coli strain BL21(DE3) Stock
Scheme 1. Experimental procedures-1
sequence is from NCBI. The expression vector of wild-type sperm whale Mb was from Hung-Ming Lin.16 The cassette including silent EcoR V restriction site was inserted between the BamH I and Nco I sites. The expression was in Escherichia coli strain pET-28a(+).
The mutations of MbL29X/H64D/V68L/I107M, MbH93X, MbF43Y, MbF46Y, and MbV17W were constructed by Site-Directed mutagenesis strategies.
(1) Primer design:
YHWu-Mb-L29X-1 G Q D I X I L F K 5’ ggT Cag gAT ATC NNN ATT CgA CTg TTC 3’
EcoR V
YHWu-Mb-H93X-1 L A Q S X A T K I 5’ CTT gCg CAA TCg NNN gCT ACT AAA CAT 3’
YHWu-Mb-V17W-1 V W A K W E A D V 5’ gTT Tgg gCT AAA Tgg gAA gCT gAC gTC 3’
YHWu-Mb-F43Y-1 T L E K Y D R F K 5’ ACT CTg gAA AAA TAC gAT CgT TTC AAA 3’
YHWu-Mb-F46Y-1 E K P D R Y K H L K
5’ gAA AAA TTC gAT CgT TAC AAA CAT CTg AAA AC 3’ Table 3. Primer design for site-saturated mutagenesis
The letters with gray background in the sequence line of primers show the target mutations, and “N” means A, T, C, G four bases, which are arranged in order to form 20 possible amino acids. The bolded letters indicate silent mutation for EcoR V mapping analysis and these constructions are marked with underline.
(2) QuikChange PCR:
Reagent
Volume(µL)
Template 1 Primer 1 (10 μM/μl) 1 Primer 2 (10μM/μl) 1 10X Pfu Buffer 5 dNTP (10 mM) 4 DDW 37 Pfu polymerase 1 Total reaction volume 50Table 4. QuikChange Site-Directed Mutagenesis Kit PCR composition
segment
Cycles
Temperature
time
1 1 95 ℃ 2 min 2 18 95 ℃ 30 sec Primer Tm – 5~8 ℃ 30 sec 72 ℃ 12 min 3 1 72 ℃ 10 min 4 1 4 ℃ ∞
(3) Dpn I digest parental DNA template:
The digest reaction was incubated at 37 ℃ for 3 hours to digest the parental supercoiled DNA.
Reagent
Volume(µL)
PCR products 17 10X NEBuffer 4 1 DDW 1 Dpn I 1 Total reaction volume 20Table 6. QuikChange Site-Directed Mutagenesis Kit PCR products digestion (4) Transformation into XL1-Blue and enzyme mapping:
The digestion of QuikChange products were added into 100 µl E.coli XL1-Blue competent cells of each reaction and incubated on ice for 20 min. The cells were transformed by heatshock methods for 1 min at 42 ℃, following 1 min on ice. Then, the cells were transferred to 1 ml LB medium immediately and shaken at 200 rpm for 1 hour at 37 ℃ incubator. After that, the cells were centrifuged at 8,000 rpm for 1 min and propagated on LB plate containing 25 µg/ml kanamycin. These plates were incubated at 37 ℃overnight. Selected and cultured the transformed colonies in 3 ml LB medium containing 25 µg/ml kanamycin at 37 ℃overnight. The plasmid DNAs were isolated by Plasmid Miniprep Purification Kit, according to the manufacturer instructions.
(5) Sequencing analysis of myoglobin mutants:
The exact amino acid substitution at Val17, Leu29, Phe43, Phe46, and His93 positions were determined by sequencing of the DNA using ABI PRISM 3100 auto-sequencer. Nucleotide sequencing was performed using the dideoxynucleotide chain-termination method with only one forward of reverse primers. Sequencing reactions were carried out with BigDye® Terminator v3.1 Cycle Sequencing Kit, according to manufacturer protocol. Each of the samples were performed with 1 µl each forward or reverse primer, 2 µl plasmid DNA, 3 µl 5X sequencing buffer, 1 µl premix and ddH2O to get a final volume of 20 µl. Each of reactions was performed on
ABI PRISM® 3100 Genetic Analyzer, following the manufacture’s guidelines.
2-2-3 Preparation of Clones
The plasmids after checked were added into 100 µl E.coli BL21 (DE3) competent cells of each reaction mixture and incubated on ice for 20 min. The cells were transformed by heatshock methods for 1 min at 42 ℃, following 1 min on ice. Then, the cells were propagated on LB plate containing 25 µg/ml kanamycin with 40 µl. These plates were incubated at 37 ℃ overnight. Injected the colonies and cultured in 1ml LB medium containing 25 µg/ml kanamycin at 37 ℃ overnight. Taking one of the medium mixed the same volume of glycerol and stocked at -80 ℃.
2-2-4 Preparation of SDS-polyacrylamide gel electrophoresis (SDS-PAGE)
The glass-plate sandwich of the electrophoresis apparatus was assembled according to manufacturer’s instructions. The gel solution was prepared as follows:
Solution Separating gel (20%) ddH2O 2 ml 30% acrylamide mix 6.6 ml 1.5 M Tris ( pH 8.8) 2.5 ml 20% SDS 50 µl 10% ammonium persulfate 200 µl TEMED 10 µl
Solution Stacking gel (4%)
ddH2O 3 ml 30% acrylamide mix 0.67 ml 1 M Tris ( pH 6.8) 1.25 ml 20% SDS 50 µl 10% ammonium persulfate 50 µl TEMED 10 µl
Table 7. 20% separating gel and 4% stacking gel of SDS-PAGE
2-2-5 Protein detection
For expression experiments, protein detection was competed with SDS-PAGE and Western blotting methods. All the clones were inoculated in 3 ml LB medium containing 25 µg/ml kanamycin at 37 ℃ overnight. The cells were centrifuged at 8,000 rpm for 1 min and re-suspended with 200 µl lysis buffer. After that, the solutions were immediately frozen in liquid nitrogen, then defrosted at 42 ℃ water
bath and repeated for several times. The solutions were centrifuged at 13,000 rpm for 1 min. The 20 µl supernatant was mixed with 5X sample treatment buffer (125 mM Tris-HCl, pH 6.8, 2% SDS, 10% glycerol, 5% β-mercaptoethanol , and 0.05% bromophenol blue), and heated at 100 ℃ for 10 min. Electrophoresis was performed according to the manufacturer’s instructions. After electrophoresis, the gel was soaked in Coomassie Blue R 250 staining solution for 20 min, and the gel was destained with the destaining solution I (40% methanol, 7% acetic acid) and II (5% methanol, 7% acetic acid) until the stained band was distinct against a clear background.
In Western blotting experiments, the supernatants were electrophoretically separated with SDS-PAGE and transferred onto polyvinylidene difluoriede (PVDF) membranes. The PVDF membranes were washed by the PBS buffer (pH 7.6) containing 0.05% Tween 20 (PBST) for 10 min, and immunodetection was carried out by following the procedure for the ECL Western blotting system, using monoclonal antibody raised against the hemolysin (1:500) and anti-mouse immunoglobulin HRP-peroxidase conjugate (1:5000). Excess ligand was washed away with PBST for 30 min, and the detection of the proteins was performed according to the manufacturer’s instructions (Amersham Pharmacia Biotech, Piscataway, NJ, USA). Membranes were exposed to Hyperfilm ECL (Amersham) for different times or until a suitable signal was obtained from the exposed films.
Inoculate one colony to 6 ml LB for 20 hr.
Cell lysis and
centrifugation supernatantTake the
Activity test:
20 μL of the sup. to react with 1 mL of 1 mM ABTS and 5 mM H2O2
Scheme 2. Experimental procedures-2
2-2-6 Crude Extract
For high speed sieving the peroxidase activity of clones, all the clones were inoculated in 6 ml LB medium containing 25 µg/ml kanamycin at 37 ℃more than 20 hours. The cells were centrifuged at 8,000 rpm for 1 min and re-suspended with 200 µl lysis buffer. After that, the solutions were quick-frozen in liquid nitrogen, then defrosted at 42 ℃ water bath to repeat for several times and centrifuged at 13,000 rpm for 1 min. The 10 µl supernatant was mixed with 1ml of 1 mM ABTS and 5 mM H2O2.The rate of the ABTS cation radical formation was monitored at 730 nm (ε730=
1.4 X10⁴ M-1cm-1) where the absorption of Mb was negligible so it can detect the difference at 730 nm in size. + + ⎯ ⎯ ⎯ → ⎯ +ABTS H O ABTS O H Peroxidase 2 2 2
Stock the mutated apo-form Purify by DEAE column Dialysis with Tris and NaPi buffer
Re-suspended and high frequency sound waves through inclusion body Cell lysis and centrifugation
Added the IPTG to 0.4mM overnight at 37 ℃
Transferred the cells to 1000 ml LB medium for 3 hr at 37 ℃ Inoculate one colony to 3 ml LB overnight at 37 ℃.
Scheme 3. Experimental procedures-3
2-2-7 Expression of Apo-Mb
The clones which had better peroxidase activity than others were chosen to incubate in 3ml LB medium containing 25 µg/ml kanamycin at 37 ℃ overnight, and the cells were transferred to 1000ml LB medium at 37 ℃ for 3 hours then induced with 0.4 mM of IPTG at 37 ℃ overnight. The cells were centrifuged at 8,000 rpm for 20 min and re-suspended with 20ml lysis buffer.
2-2-8 Crude extract of inclusion body
We used ultrasonicator to agitate and lyse cells. To prevent excessive heating, ultrasonic treatment was applied in multiple short bursts to a sample immersed in an ice bath. The sonication set with 30 % energy, pulsed 2 s, rest 1s, total 30 s, 6 cycles. The solution was centrifuged at 12,000 rpm for 30 min. The pellet was dissolved with 20 ml solubilization buffer.
2-2-9 Denature and refolding of inclusion body
We used ultrasonicator to scatter the inclusion body. To prevent excessive heating, ultrasonic treatment was applied in multiple short bursts to a sample immersed in an ice bath. The sonication set with 30% energy, pulsed 2 s, rest 1 s, total 30 s, 3 cycles. Disruption buffer was slowly added into the solution each time 10 ml, total 80 ml. The solution was dialyzed with 500 ml of Tris buffer twice each time for 2 hours, 2 L of Tris buffer overnight, and with 1 L of solubilization buffer twice each time for 2 hours, and 5 L of solubilization buffer overnight. The solution was centrifuged at 12,000 rpm for 30 min at 4 ℃.
2-2-10 Purification of Apo-Mb
The supernatants added into DEAE column. The DEAE column was equilibrated with 5 bed volumes of 100 mM KPi buffer and the protein was recovered in the flow throughout. The CM column was equilibrated with 5 bed volumes of equilibration buffer but the protein was recovered with KPi buffer. The examination of expression yield and protein profile purification was performed by 20% SDS–polyacrylamide gel electrophoresis (SDS–PAGE).
Mix apo-form, DMSO 1.5 ml, and 100 mM Kpi 1ml
Adjust solution pH 12 at ice bath
Add 1.5-fold heme and 500 ul pyrimidine per-mix for 15 min
Adjust solution pH 6.8 at 4 ℃ for 6 hr
Dialyzed with dH2O for 3 hr twice and Kpi for 6 hr
Scheme 4. Experimental procedures-4
2-2-11 Reconstitution of Apo-Mb with heme
Reconstitution of heme into apo-Mb followed the modified method of Axup et al.(10) A 1.5-fold stoichiometric amount of heme in 100 mM KPi/pyrimidine (1/1, v/v, 500 μl) solution was dropwisely added to an apo-Mb solution in 100 mM KPi/DMSO (4/1) buffer pH 12 (7.5 mL) cooled in an ice bath. After incubation for 15 min, the solution was adjusted to pH 6.8 and slowly stirred at 4℃ for additional 6 hrs. The solution was transferred into a dialysis membrane against ddH2O, with two times
change of ddH2O to remove organic solvent, followed by additional dialysis against
100 mM KPi buffer pH 6.8 for overnight. The solution was then filtrated with 0.45 μm cellulose membrane before applied to a Sephadex G-25 column, equilibrated with 100 mM KPi buffer pH 6.8, and eluted with the same buffer at 4 ℃. The protein band was collected and stored at -20 ℃.
Enzyme
Catalytic of
ABTS
• Mb variants were mixed with 7.5 mM of H2O2and 0.02 to 5 mM of ABTS.[Mb mutants] = 0.01 μM
• Monitored at 730 nm
Enzyme
Catalytic of
H
2O
2• Mb variants were mixed with 0.05 to 15 mM H2O2 and 1 mM
ABTS. [Mb mutants] = 0.01 μM • Monitored at 730 nm
Analysis
• Michaelis-Menten plots and Linewaver-Burk plots
Scheme 5. Experimental procedures-5
2-2-12 Analysis of Peroxidase Activity
Activity for one-electron oxidation of ABTS was measured at room temperature in 100 mM potassium phosphate buffer (pH 7.0) on 8453 UV-Visible spectrophotometer. At least three experiments were performed for each experimental data point. The rate of the ABTS cation radical formation was monitored at 730 nm (ε730=1.4X10⁴M-1 cm-1) where the absorption of Mb was negligible. The reaction
mixture contained ABTS (0.1-5 mM) and variable amounts of H2O2 (0.2-15 mM). The
3 Results and Discussion
3-1 All clones
The site directed mutagenesis strategy is a general method used in structural function studies for enzymes. In a previous study, MbH64D/V68L/I107M had been engineered to form an enzyme with peroxidase activity16. By using H2O2 and ABTS
as substrates in a peroxidase activity assay, the activity of MbH64D/V68L/I107M was determined to be better than MbH64D/V68L. We further engineered the Leu-29 in MbH64D/V68L/I107M and His-93 in MbWT to construct MbL29X/H64D/V68L/I107M and MbH93X by site-saturated mutants. The X designation for each mutant represents the positions that were replaced with 19 amino acids. Inaddition, Val-17 was changed to Trp to construct MbV17W by site-directed mutagenesis. Phe-43 and Phe-46 were replaced with Tyr to construct MbF43Y and MbF46Y, respectively. The sequences of the above-mentioned clones were confirmed by DNA sequencing. The mutated plasmids were transformed into BL21(DE3) to facilitate protein expression. The results have been summarized in Table 8.
Mb Sequence Transform to BL21(DE3)
MbH64D/V68L/I107M sequence Transform to
BL21(DE3) H93A(Ala) V V L29A(Ala) V V H93R(Arg) V V L29R(Arg) V V H93N(Asn) V V L29N(Asn) V V H93D(Asp) V V L29D(Asp) V V H93C(Cys) V V L29C(Cys) V V
H93E(Glu) V V L29E(Glu) V V H93Q(Gln) V V L29Q(Gln) V V H93G(Gly) V V L29G(Gly) V V H93L(Lus) V V L29H(His) V V H93I(Ile) V V L29I(Ile) V V H93K(Lys) V V L29K(Lys) V V H93M(Met) V V L29M(Met) V V H93F(Phe) V V L29F(Phe) V V H93P(Pro) V V L29P(Pro) V V H93S(Ser) V V L29S(Ser) V V H93T(Thr) V V L29T(Thr) V V H93W(Trp) V V L29W(Trp) V V H93Y(Tyr) V V L29Y(Tyr) V V H93V(Val) V V L29V(Val) V V Mb sequence Transform to BL21(DE3) Mb sequence Transform to BL21(DE3) F43Y(Tyr) V V V17W(Trp) V V F46Y(Tyr) V V
3-2 Protein detection
We incubated all clones in 6 ml LB medium at 37 ℃ for 20 hours and then lysed the cells. To confirm that our clonescould express mutated Mbs efficiently in BL-21, the crude extracts were analyzed by Western blotting. The results revealed that all of our clones could express mutated Mbs efficiently (Fig. 16).
Lane 1: positive (MbWT) Lane 2: MbL29G/H64D/V68L/I107M Lane 3: MbL29A/H64D/V68L/I107M Lane 4: MbL29V/H64D/V68L/I107M Lane 5: MbL29I/H64D/V68L/I107M Lane 6: MbL29M/H64D/V68L/I107M Lane 7: MbL29S/H64D/V68L/I107M Lane 8: MbL29T/H64D/V68L/I107M Lane 9: MbL29C/H64D/V68L/I107M Lane 10: MbL29P/H64D/V68L/I107M
Lane 1: MbL29N/H64D/V68L/I107M Lane 2: MbL29Q/H64D/V68L/I107M Lane 3: MbL29F/H64D/V68L/I107M Lane 4: MbL29Y/H64D/V68L/I107M Lane 5: MbL29W/H64D/V68L/I107M Lane 6: MbL29K/H64D/V68L/I107M Lane 7: MbL29R/H64D/V68L/I107M Lane 8: MbL29H/H64D/V68L/I107M Lane 9: MbL29D/H64D/V68L/I107M Lane 10: MbL29E/H64D/V68L/I107M
Lane 1: positive (MbWT) Lane 2: MbH93G Lane 3: MbH93A Lane 4: MbH93V Lane 5: MbH93I Lane 6: MbH93M Lane 7: MbH93L Lane 8: MbH93S
Lane 9: MbH93T Lane 10: MbH93C
Lane 1: MbH93P Lane 2: MbH93N Lane 3: MbH93Q Lane 4: MbH93F Lane 5: MbH93Y Lane 6: MbH93W Lane 7: MbH93K Lane 8: MbH93R Lane 9: MbH93D Lane 10: MbH93E
Lane 1: positive (MbWT) Lane 2: MbV17W Lane 3: MbF43Y Lane 4: MbF46Y
Figure 16. Western blotting experiments for clone expression
3-3 Activity Test of Crude Extract
In order to prove that the mutated Mb clones can express and confer peroxidase activity, we analyzed the peroxidase activity between BL-21 clones with MbH64D/V68L/I107M insert and BL-21 clones without insert. We detected the Soret band of Mb. The characteristic Soret band of Mb is expected to be around 410 nm and is contributed by heme in Mb. The Soret band will shift in accordance with different pH values, different solutions, or different mutants.
First, we lysed the cells to obtain, the crude extract. We then analyzed the difference in the UV-Vis spectrum. Acoording to the absorbance pattern at 410nm, the results indicated that the MbH64D/V68L/I107M clone could expressed the mutated protein consistently. No absorbance was detected at 410nm for the BL-21 clone without insert
(Fig. 17-a).
Next, we attempted to confirm functional peroxidase activity. The activity was from the MbH64D/V68L/I107M which was expressed by the inserted clone. 20 μl of extract was allowed to react with 1 ml mixed solution of 1 mM of ABTS and 5 mM of H2O2.
The absorbance change detected at 730 nm, (ε730= 1.4 X10⁴ M-1cm-1) where the
absorption of Mb was negligible, was recorded and compared. The results indicated; there was no absorbance change at 730 nm for the crude extract of BL-21 clone without insert. On the other hand, the absorbance change at 730 nm for the crude extract of MbH64D/V68L/I107M clone was increased gradually. It was confirmed that the peroxidase activity was from the MbH64D/V68L/I107M, and not from other proteins in the BL-21 cell (Fig. 17-b). (a) Tri:0.0871(410nm) 0 0.1 0.2 0.3 0.4 0.5 0.6 0.7 0.8 0.9 1 240 340 440 540 640
Ab
sorbance
(A
U)
Wavelength (nm)
UV‐Vis
Triple mutant BL‐21(no insert)(b)
0
0.1
0.2
0.3
0.4
0.5
0.6
0.7
0.8
0.9
1
1.1
1.2
1.3
0 50 100 150 200 250 300 A(730nm)Time(s)
Peroxidase Activity of Crude Extract
Triple mutant BL‐21(no insert)Figure 17. Comparisons of (a) wavelength scan and (b) peroxidase activity of crude extract from MbH64D/V68L/I107M clone (red) and BL-21 without insert (black)
Also, the influence of MbL29X/H64D/V68L/I107M, MbH93X, MbV17W, MbF43Y, and MbF46Y on peroxidase activity was analyzed using the crude extracts. The concentrations of all crude extracts were normalized by the absorbance of Soret band (shown in Appendix Figs. 27, 28, and 29). All of the crude extract concentrations were adjusted to 0.058 μM and mixed with 1 ml of 1 mM ABTS and 5 mM H2O2. The peroxidase activity of these crude proteins was analyzed spectrophotometrically at 25°C by using the H2O2-dependent oxidation of ABTS at 730 nm.Peroxidase activity
results from of MbL29X/H64D/V68L/I107M, MbH93X, MbV17W, MbF43Y, and MbF46Y have been shown in Figure 18, by using the triple mutant MbH64D/V68L/I107M as positive control and wild type Mb as negative control. In crude extract of MbL29X/H64D/V68L/I107M, each clone exhibited peroxidase activity but worse than that of MbH64D/V68L/I107M (Fig. 18-a). In crude extract of MbH93X, most did not have detectable peroxidase activity (Fig. 18-b). In crude extract of MbV17W, MbF43Y, and MbF46Y, only the MbV17W clone
showed activity (Fig. 18-c). (a) 0 0.2 0.4 0.6 0.8 1 1.2 A(730nm) MbL29X/H64D/V68L/I107M
Peroxidase Activity of Crude Extract
(b) 0 0.1 0.2 0.3 0.4 0.5 0.6 0.7 0.8 0.9 1 A(730nm) MbH93XPeroxidase Activity of Crude Extract
(c)Figure 18. (a) The peroxidase activity of MbL29X/H64D/V68L/I107M clones. (b) The activity of H93X clones. (c) The peroxidase activity of V17W, F43Y, and F46Y
clones. 0 0.1 0.2 0.3 0.4 0.5 0.6 0.7 0.8 0.9 1
Wild type Triple mutant V17W F43Y F46Y
A(730nm)
Mb Variant
Peroxidase Activity of Crude Extract
Based on peroxidase activity results obtained using the crude cell extract, we further purified those clones with better activity. These were MbL29C/H64D/V68L/I107M, MbL29F/H64D/V68L/I107M, MbL29I/H64D/V68L/I107, MbL29M/H64D/V68L/I107M, and MbV17W.
3-4 Purification of mutated Mbs
To produce highly pure and large amount of Mb variants, we deferred to the research of Ribeiro et al.18, which produces inclusion bodies. When we isolated the inclusion bodies, we were to remove the miscellaneous proteins easily.
First, we used IPTG to induce Escheria coli. to produce inclusion bodies of our variant Mbs. Then, we lysed the cells. There were many inclusion bodies in the crude extracts. The inclusion bodies were isolated via centrifugation. The inclusion body was expected to be in the pellet because of its high density, and the miscellaneous proteins, which were in the supematent, were able to be efficiently removed. The inclusion bodies recovered were re-dissolved by Guanidine hydrochloride (Gdm-HCl). Upon removal of the Gdm-HCl by dialysis, Mbs would slowly refold to avoid
subsequent aggregation. Last, Mbs were purified by using DEAE column, and analyzed by 20% SDS-PAGE to confirm the purity of the extracted proteins. The results showed that these Mb variants were pure and expressed in large quantities. (Fig.19).
(a)
Figure 19. 20% SDS-PAGE analysis of purified mutated apoMb. (a) Lane M: marker, lane 1:before adding IPTG, lane 2:after IPTG induced, and lane 3: purified 17kDa Mb. (b) Lane M:marker, lane 1:MbWT, lane 2:MbH64D/V68L, lane
3:MbH64D/V68L/I107M, lane 4:MbV17W, lane 5:MbL29C/H64D/V68L/I107M, lane 6:
MbL29F/H64D/V68L/I107M, lane 7:MbL29I/H64D/V68L/I107M, and lane 8:
MbL29M/H64D/V68L/I107M
3-5 Reconstitution of mutated Mbs
In the extreme high or low pH range, Mbs are unfolding and the heme can exist as monomer or dimer. For this reason, Mb and heme were mixed in pH 12 solution and slowly adjusted to pH 6.8, in hopes of improving cofactor reconstitution. At the same time, heme was dissolved in pyridine to prevent aggregation, and dimethyl sulfoxide (DMSO) was added to the protein solution to increase the protein solution’s co-solubility. After the solution was completely adjusted to pH 6.8 and dialyzed, the heme that had not reconstituted with myoglobin was aggregated. We separated out that form of heme by passing through 0.45 μm filter and desalting column and discarded it.
To ensure the reconstituted Mbs had peroxidase activity, 10 μl of reconstituted MbH64D/V68L/I107M, apo-MbH64D/V68L/I107M, and heme only ([Mb]= 0.53 μg/ml=0.031 μM=[heme]) (Fig. 20) were reacted with ABTS (1 mM) and H2O2 (5 mM). Only the
reconstituted protein had peroxidase activity (Fig. 21). This result was in agreement with the results published by Pfister et al.(Scheme 5).
Scheme 6. Heme dependence of tryptophan oxidation9
Figure 20. The UV-visible spectra of reconstituted MbH64D/V68LI107M and Apo-MbH64D/V68L/I107M in 100 mM potassium phosphate buffer at pH 7.0
0 0.1 0.2 0.3 0.4 0.5 0.6 350 400 450 500 550 600 650 700
Absorbance
Wavelength(nm)Triple mutant & Apo-form
H64D/V68LI107M Mb H64D/V68L/I107M Apo‐Mb
Figure 21. The absorbance change at 730 nm for MbH64D/V68LI107M, Apo-MbH64D/V68L/I107M, and heme in 100 mM potassium phosphate buffer at pH
7.0 ‐0.1 0 0.1 0.2 0.3 0.4 0.5 0.6 0.7 0.8 0 15 30 45 6 A(730nm) Time(s)
Peroxidase Activity
0 heme H64D/V68L/I107M Apo‐Mb H64D/V68LI107M Mb3-6 Enzyme kinetics measurements
Enzyme kinetics is an older approach used to understand enzymatic mechanisms and remains to be the most important aspect. The purified MbL29C/H64D/V68L/I107M, MbL29F/H64D/V68L/I107M, MbL29I/H64D/V68L/I107, MbL29M/H64D/V68L/I107M, and MbV17W were subjected to enzyme kinetics assay. First, we analyzed the enzyme catalytic velocity of ABTS based on altering the concentration of ABTS. Mb variants were mixed with 7.5 mM of H2O2 and 0.01 to 5 mM of ABTS. The final concentration of Mb mutants
was 0.01 μM. The results of the enzyme kinetics assay were analyzed by using Michaelis-Menten plots. The initial reaction rate v0 was used as Y axis and the
substrate concentration [ABTS] was used as X axis. For enzymes that obey the Michaelis-Menten relationship, we used 1/ v0 as Y axis versus 1/ [ABTS] as X axis to
draw the Linewaver-Burk plots. Also, we analyzed the enzyme catalytic velocity of H2O2 based on altering the concentration of H2O2. Next, Mb variants were mixed with
0.05 to 15 mM H2O2 and 1mM ABTS. The [H2O2]Michaelis-Menten and
Linewaver-Burk plots of MbL29C/H64D/V68L/I107M, MbL29F/H64D/V68L/I107M, MbL29I/H64D/V68L/I107, MbL29M/H64D/V68L/I107M, MbH64D/V68L/I107M, MbH64D/V68L, and MbV17W have been shown in showed Appendix figure 30 and 31.
These two substrates are subject to substrate inhibition, especially H2O2. Alayash
et al. had detailed the reactions of Mb with hydrogen peroxide in previous
reports10,12,13,19. In their research, Mb reacted with H2O2 but not with ABTS. The
ferryl iron species (compound I) changed to the ferric state via auto-reduction (Scheme 6). The mechanism of this process is not well understood, and the identity of the electron donor remains unknown. It may produce the compound III (superoxide radical anion), and it has been shown to slowly reduce to the ferric state. The peroxidase enzyme formed the compound III, which does not have peroxidase activity, when the concentration of H2O2 was high20. In the experiment, the enzyme did not
Scheme 7. The rates of the slow kinetic processes were made based on a simple reaction scheme. 10
The steps of the peroxidase reaction are shown in equation 3 below. First, the enzyme is reacted with H2O2 to form compound I. The rate constant is represented by
k1. Second, the ABTS reduced the complex to compound II. Finally, the ABTS
continued to reduce the compound II until it reached the resting state and the iron of heme became ferric (Fig. 21). The constants for these reactions are represented by k2
and k3, respectively. Consequently, by changing the concentration of H2O2 we were
Figure 22. General reaction cycles of heme proteins with peroxide9
(1)
(2)
(3)
Equation 3. The equations of peroxidase catalysis
MbH64D/V68L, MbH64D/V68L/I107M, MbL29I/H64D/V68L/I107M, MbL29F/H64D/V68L/I107M, MbL29C/H64D/V68L/I107M, MbL29M/H64D/V68L/I107M, and MbV17W exhibited better peroxidase activity in crude extract analysis. We purified and reconstituted heme with these mutants; afterward, we finished the kinetic measurements. We have summarized the results in the table below and calculated the turnover number and catalytic efficiency.
ABTS Mutated Mb apparent V'max apparent K'm turnover number(kcat) catalytic efficiency (kcat/Km) [Enzyme]=1.00E-05 (mM/min) (mM) (min-1) (mM-1min-1)
H64D/V68L 0.099 0.389 9893 25448 H64D/V68L/I107M 0.116 0.324 11567 35765 L29I/H64D/V68L/I107M 0.052 0.211 5213 24737 L29F/H64D/V68L/I107M 0.026 0.153 2584 16913 L29C/H64D/V68L/I107M 0.017 0.102 1681 16542 L29M/H64D/V68L/I107M 0.057 0.196 5679 28954 V17W 0.010 0.063 994 15784
Table 9. Kinetic data of ABTS by mutated Mb
H2O2 Mutated Mb apparent V'max apparent K'm turnover number(kcat) catalytic efficiency (kcat/Km) [Enzyme]=1.00E-05 (mM/min) (mM) (min-1) (mM-1min-1)
H64D/V68L 0.113 1.723 11294 6556 H64D/V68L/I107M 0.121 1.586 12146 7705 L29I/H64D/V68L/I107M 0.009 0.113 868 7645 L29F/H64D/V68L/I107M 0.010 0.117 1008 8585 L29C/H64D/V68L/I107M 0.010 0.200 970 4840 L29M/H64D/V68L/I107M 0.071 1.039 7118 6853 V17W 0.008 0.168 765 4546
0.00 5000.00 10000.00 15000.00 20000.00 25000.00 30000.00 35000.00 40000.00 45000.00
Catalytic Efficiency of ABTS
Figure 23. The catalytic efficiency of ABTS
0 1000 2000 3000 4000 5000 6000 7000 8000 9000 10000