相對常數原則在中國媒介消費的驗證
46
0
0
全文
(2) Mass Media Expenditures in China: The Principle of Relative Constancy Examined. 研 究 生:張 為 詩. Student:Wei-Shih Chang. 指導教授:唐 瓔 璋. Advisor:Dr. Edwin Tang. 國 立 交 通 大 學 經 營 管 理 所 碩 士 論 文. A Thesis Submitted to Institute of Business and Management College of Management National Chiao Tung University In partial Fulfillment of the Requirements For the Degree of Master of Business Administration June 2005 Hsinchu, Taiwan, Republic of China. 中華民國九十四年六月. ii.
(3) 致謝. 如果說一切是命中注定,那麼老天一定很厚愛我,讓我成為一個很幸運的 人兒。因為此時此刻,我完成了學業上的夢想,也在這求學生涯中結識了許多 志同道合的好友。 感謝親愛的家人,即使在家中經濟拮据下,仍然支持我繼續完成我的理想。 一路走來的艱辛,你們無怨無悔付出與等待,讓一個依賴成性的小女孩,長大 成為獨立堅強的大女孩。 感謝一路相伴的同窗好友們,小米、小陸、小紅、小美、敏惠、嘉哲、健 偉、宥任、昭仁,是你們讓我的研究生涯中不再孤獨而且充滿著樂趣,也是你 們的支持與鼓勵,讓這本論文有了完美的句點。 感謝你,麒文!求學路程中有你相伴,是我人生中最大的幸運。. 張為詩 謹誌 國立交通大學經營管理所 二00五 六月. iii.
(4) Abstract This study is to test the time-trend and income-share hypotheses in China. Due to the different characters in China’s situation, this article goes beyond the principle of relative constancy (PRC) by testing some new models of advertising expenditures using 1981-2003 Chinese data. Unlike the traditional PRC models, these new models contain additional regressors which are more useful for China and lagged form. In China, GNP is a good predictor of changes in advertising expenditures. GNP can be proven in all mass media and total advertising expenditures. Clearly it is equally important to run regression analysis with individual categories of mass media expenditures as it is with GNP. The fact that lagged advertising expenditures (Adt-1) was found to be good predictor for some of the regressions such as TV and magazine.. Key Words: PRC (Principle of relative constancy), Media Economics, Advertising Expenditures, Mass Media, China. iv.
(5) 摘要. 中國從 70 年代末期,改革開放以來,不論經濟或政治都遭受到重大的變革演 進,而經濟的發展也帶動了媒體的成長以及廣告投資逐年的劇增,這些現象的背 後是否存在著某種定律呢? 本篇文章乃是建立在相對常數原則下,針對中國媒介廣告市場的所做的實證 分析,以 1981 年至 2003 年間不同媒體廣告量與四項總體經濟指標作為分析對象, 目的除了檢驗相對常數原則在中國是否受到支持以外,且以統計結果來審視近二 十多年來媒體廣告量與國家經濟發展的互動影響。. 關鍵字: 相對常數假說、媒介經濟、廣告消費、大眾媒介、中國. v.
(6) Contents Contents ............................................................................................................................ i Figure Contents............................................................................................................... iii 1. INTRODUCTION ....................................................................................................... 1 1.1 The Principle of Relative Constancy ................................................................. 1 1.2 The Overview in China ...................................................................................... 2 1.3 After Entering into the WTO ............................................................................. 3 1.4 The Purpose of the Research.............................................................................. 5 2. LITERATURE REWIEW............................................................................................ 6 2.1 Relative Constancy Hypothesis ......................................................................... 6 2.2 The Evolution of Economic in China ................................................................ 8 2.3 Introduction to Advertising and Mass Media................................................... 10 2.3.1 Advertising............................................................................................ 10 2.3.2 Mass Media........................................................................................... 10 2.4 Overview of Advertising Industry in China..................................................... 11 2.4.1 Spending Types Aspect ......................................................................... 13 2.4.2 Geographical Aspect ............................................................................. 14 2.4.3 Economically-Composed Aspect .......................................................... 15 2.4.4 The Relative Issue of Advertising in China .......................................... 16 2.5 Overview of Mass Media in China .................................................................. 17 2.5.1 Print Media............................................................................................ 18 2.5.2 Radio and Television............................................................................. 18 2.6 Advertising in Consumer’s Market in China ................................................... 20 2.6.1 Consumer behavior on advertisement in China .................................... 20 2.6.2 The relationship between Engel law and mass media spending ........... 21 3. MODEL BUILDING AND HYPOTHESES ............................................................. 23 3.1Original PRC Models........................................................................................ 23 3.2Hypotheses........................................................................................................ 24 3.3Data Collection ................................................................................................. 25 3.4Data Analysis .................................................................................................... 26 4. RESULTS................................................................................................................... 28 4.1 H1 & H2: GNP and Absolute Advertising Spending. ....................................... 28 H3: Relative Spending Over Time.......................................................................... 29 H4: Path-Diverting of Advertising Expenditures in 1992. ..................................... 29 5. CONCLUSIONS........................................................................................................ 34 5.1 Discussion ........................................................................................................ 34 5.2 Future Research ............................................................................................... 34 REFERENCE................................................................................................................. 36 i.
(7) Table Contents. Table 1. Different stages in the economic development of the PRC (except Hong Kong and Macao).......................................................................................... 9. Table 2. Adverting Market Statistics in 1992............................................................. 13. Table 3. The Impartment Issue in Advertising Industry in China .............................. 16. Table 4. Audience exposure to advertising media...................................................... 20. Table 5. Media use per consumer segment ................................................................ 20. Table 6. Buying motive, promotional media and product types ................................ 21. Table 7. Static Regression Models of Advertising Expenditures (1981-2003) .......... 30. Table 8. Dynamic Regression Models of Advertising Expenditures (1981-2003) .... 31. Table 9. Static Regression Models of Advertising Expenditures on citizen income (1981-2003).................................................................................................. 32. Table 10 Relative Advertising Expenditures Regressed on Time ............................... 33 Table 11. The Path-Diverting Effect of Advertising Expenditure in 1992................... 33. ii.
(8) Figure Contents. Figure 1 Dual Product Market ...................................................................................... 10 Figure 2 The types of spending on life material ........................................................... 14 Figure 3 Advertising operation units in China.............................................................. 15 Figure 4 Engel law between Rural and Urban in China ............................................... 22 Figure 5 Path-Diverting of Advertising Expenditures .................................................. 29. iii.
(9) 1. INTRODUCTION. 1.1 The Principle of Relative Constancy In 1972, McCombs, a mass communication researcher, coined the Principle of Relative Constancy (PRC), which assumed that the amount of money consumers and advertising spend on mass media products and services remains relatively constant over time and that change in the absolute amount of spending is determined primarily by general state of the economy, not competition or technological change within mass communication industries. In this original discourse, McCombs wrote about the relative constancy hypothesis fist postulated by Scripps. The hypothesis stated:” The level of spending on mass media by consumers and advertising is determined by the general state of the economy. Any change in level of the economy causes a parallel change in spending on mass media” (McCombs, 1972). Scripps speculated this occurred because mass communication had become a staple of consumption in the United Sates, similar to housing, clothing and food (McCombs, 1972). Base upon the income and media expenditure data, McCombs concluded that the hypothesis was in reality a principle. Wood (1986) labeled this interpretation the time-trend constancy hypothesis. McCombs (1972) also elaborated on the second key element of Scripps’s reasoning—function e1uivalence—whereas the level of total media expenditures is expected to remain uniform over time. As an alternative to time-trend constancy approach, Wood (1986) presented the income-share constancy hypothesis, which holds that when income change, the share of income spend on media does not significantly change. Since 1972, a handful of other studies have tested the hypotheses. However, empirical support for the PRC has been mixed. Whereas some studies have reported that consumer mass media expenditures have remained relatively stable over several decades (Dupagne, 1994; McCombs, 1972; Son & McCombs, 1993; Wood & O’Hare, 1991), it was also found that consumer spending on mass media could deviate 1.
(10) noticeably in the 1970s and 1980s as a result of the video cassette recorder (Dupagne, 1994; Glscock, 1993; McCombs & son, 1986; Noh, 1994; Son & McCombs, 1993; Wood & O’ Hare, 1991). Contrary to PRC, McCombs and Son (1986) found that increasing expenditures on cable TV were offset by a sharp decrease in expenditures on other media from 1975 to 1984. Fullerton (1988) reported that innovators and early adopters in 1949 and 1950 increased their levels of total media spending to accommodate the price of television receivers. In addition, Dupagne (1995) pointed out that although the assumption of functional equivalence can be phrased in economic terms, there is no such validation for the assumption of constancy. That latter assumption was found to be inconsistent with the Engel law, a traditional microeconomic model of consumer choice. Besides, for operating the variables, although the initial explanation of PRC included advertising, the researchers did not test as many as consumer’ spending. Outside the United States, Werner (1986) found that Norwegian’s mass media expenditures were relatively constant from 1985 to 1982 and increased more slowly than expenditures on other leisure and educational activities. In the United Kingdom, consumers spent a relatively stable share of their disposable personal income on mass media from 1963 to 1989(Dupagne, 1994). On the other hand, Dupagne’s (1996) multivariate Belgium study found that price and population were better predictors of mass media expenditure than income. 1.2 The Overview in China Since reform began in the late 1970s, the China government opened the media to an unprecedented degree, but the government’s opening up was not equal to the government‘s giving up of its control an use of media. A high-ranking official was once quoted as saying “under all circumstances, the media should adhere to the party leadership and should adhere to the principle of action in the party spirit” (“China’s Communist Party,”2002). Before the mid-1980s, the central authority often decided what to buy, where to import and how to select foreign programs. Since the early 1980s after advertising was allowed again, there has been a. 2.
(11) steady increase in the advertising industry in China. The expenditures of the advertising industry has grown rapidly, and, naturally, so has expenditure on advertising. Part of the growth is the result of an increase in the cost of advertising, 20-30% for newspaper advertising and about 70% for television advertising during the Opening Policy (Guo et al., 1995). Despite the increase in price, the cost of advertising in China is still relatively low, making it a cost-efficient tool of marketing. The first comprehensive advertising law became effective in the beginning of 1995. The advertising regulations include prohibition of claims that play on superstitious, and directions that the content of the advertising has to fit the national culture, and consumer tastes (Luk et al., 1995). For example, advertising should not show scenes where children disrespect adults. Many people are convinced of nationwide China will have one of the largest media industries in the world. Currently China has more than 300 million TV sets with an audience of 1.1 billion views. There are approximately 1,500 cable systems in China, severing 90 million cable households (Motion Picture Association, 2003). Claydon Gescher Associates, a Beijing-based media consultancy service, estimates China’s television advertising market was around $2 billion dollars in 2002(“Creativity a necessity,”2002). Compared with the U.S. television advertising market of $28.9 billion dollars in 2002 (“U.S. Entertainment Industry,”), the Chinese television market undoubtedly has enormous growth potential. 1.3 After Entering into the WTO In 2001, China joined into WTO officially. China has made substantial commitments to liberalization in the service sectors, at the time of full implementation, these commitments are generally more extensive than those that any other group f economies made during the Uruguay Round (Findlay & Pangestu, 2002). However, Authorities still want to keep media under their control. In terms of the audiovisual sector, China’s commitments are quite limited and the Chinese leadership shows no willingness to open the media sector to. 3.
(12) foreign investments. Within the WTO, media sectors are categorized as service, and fall under the GATS (General Agreements on Trade in Services) while the other prong of WTO. The GATS requires WTO members to embark on successive negotiations to progressively liberalize trade in services. Among the most contentious issues during the GATS negations is the audiovisual sector or cultural industry as a whole. The opponents, like EU, Canada and Australia believe the political, cultural, and social role of cultural products goes beyond commercial dimensions. The European Union and other countries refuse to open up their media sectors for the defense of cultural diversity, whereas China may do so more out of political considerations (Mu Lin, 2004) In fact, media in China still serve as state ideological apparatuses and extension of the power structure. This political aspect will to a large extent determine how far China will go in opening its media sector, and obviously political consideration has priority over economic considerations. From April 1979 to the present, the People's Bank of China has conducted 21 adjustments of deposit and loan interest rates, 14 of which occurred in the 1990s. But the country did not accelerate the pace of market-oriented reform of interest rates until after 1996, when it established a nationwide unified inter-bank lending and borrowing market. It lifted the control over inter bank offered rates in June of the same year and tried the market bidding system for the interest rates on the part of the treasury bonds, thus realizing the market transition of interest rates on the primary and the secondary treasury bond markets. On the other hand, the Chinese government has achieved remarkable successes in its financial repression policy in maintaining financial stability, and in promoting economic development and financial deepening. But it has also paid a price for its interest rate control. With the imminent accession to the WTO and the opening of the financial market, it has become a historical necessity to link the interest rates to market forces. However, there are many restraints with regard to market transition of interest rates. Only when these restraints are removed, will it be possible for China to surely and steadily push its market-oriented reform of 4.
(13) interest rates. 1.4 The Purpose of the Research Most of researches are inquired at the micro level and partial analysis level dominates in China, whereas research regarding the macro level and media as whole as almost entirely absent. Picard (1989) proposes that media economics is concerned with how media operators meet the informational and entertainment wants and needs of audiences, advertisers, and society with available resources. It is deal with the factors influencing production of media goods and services and the allocation of those products for consumption. This study will analyze media economics in China. According to the brief background of chapter one, it shows there are many differences in the mass media environment in China. Unlike other capitalist countries, the china’s government controls most of economic indicators such as product price, interest rate, even the whole resource of mass industry. Besides, the China’s economic environment is still not a complete and mature, even though China is entering for the WTO. Therefore, this study is going to examine the PRC model in China and that will be interesting and meaning. The purpose of this study is to test the time-trend and income-share hypotheses in China. Due to the different characters in China’s situation, this article goes beyond the principle of relative constancy (PRC) by testing some new models of advertising expenditures using 1981-2003 Chinese data. Unlike the traditional PRC models, these new models contain additional regressors which are more useful for China and lagged form. Besides, this study is also applying regression techniques to aggregate advertising expenditure as well as to analyze inter-media variations during the same period. Despite some methodological differences, the study closely follows the approach of Wood and O’Hare (1991) to conceptualize and operationalize the relative constancy hypothesis.. 5.
(14) 2. LITERATURE REWIEW 2.1 Relative Constancy Hypothesis MaCombs developed the relative constancy hypothesis after reading an article published in 1965 by Scripps, former chairman of the board of Scripps-Howard Newspapers, who observed that in spite of the increasing complexity of mass communication with the advent of new media, the pattern of economic support has been relatively constant, and more closely related to the general economy than to the various changes and trends taking place within the mass media field itself. (McCombs, 1972) McCombs (1972) interpreted this and other comments in the article to mean that a relatively constant proportion of the available wealth — Gross National Product, for example — will be devoted to mass media. When they have more money, consumers and advertisers will spend more on mass media. When they have less, they spend less on mass media. The important points that this ebb and flows the general economy, not the competition and technological changes within mass media communication industries. Note that there are two separate hypotheses in this statement. The relative refers to relative changes in media spending and is descriptive: The relative amount of money spent on the mass media by consumers and advertisers will remain constant over time. The second refers to absolute changes in spending and is explanatory or causal: The greater the personal income, the greater the personal income, the greater the absolute amount of money spent on mass media. To test the relative an absolute constancy hypotheses, McCombs (1972) collected data on the amount of money consumers and advertisers spent on mass media products and advertising in USA over a 40-year period (1929-11968). He found that total consumer spending for media did not change significantly when controlling for inflation, population growth, and real increases in personal income due to economic growth.. 6.
(15) Wood (1986) extended the data from McCombs’s (1972) study to 1981, but he used disposable personal income rather than personal income as a control and explanatory variable, arguing that it was a better measure because, as an after-tax measure, it is a measure of the actual amount available for spending and saving. He found that consumer spending on the media did not increase or decrease significantly over the entire time 60-year period, and absolute changes in DPI was good predictor of changes in the absolute amount of money spent on mass communications. Wood and O’Hare (1991) extended Wood’s (1986) data set to the year 1988 to study the development of new video technology and cable television on media spending. Consistent with Wood’s previous study, they found that, although consumer spending over the entire time period remained relatively constant, there were several departures from constancy when shorter time periods were examined. A more recent study by Glascock (1993) also supported these findings. He found that, contrary to the relative constancy hypothesis, both consumer and advertising spending on cable increased significantly from 1978 to 1990. In a review of the literature, McCombs and Nolan (1992) recommended that researchers focus on the question of whether these apparent departures from a pattern of relative constancy are short-term aberrations or permanent changes in consumer behavior. In a more recent article, Son and McCombs (1993) appear to have retreated from McCombs’s (1972) position of unqualified support for the relative constancy hypothesis. They provided that the emergence and diffusion of new media in the marketplace theoretically can have impact on audience support both fro existing media in the marketplace and for non-media goods and services. Clascock (1993) reported that, from 1978 to 1990, the advertising expenditures have an increase greater than the rate of increase for GNP and personal income. Moreover, Demers (1994) use the money spent in. advertising as a dependent variable. He argued that the need for information and advertising grows as a social system because more structurally pluralistic and that general economic conditions (i.e.,. 7.
(16) national income) alone are insufficient to explain changes in relative and absolute spending In sum, the empirical evidence provides mixed support for the relative constancy hypothesis. 2.2 The Evolution of Economic in China The economic history of China can be divided into 4 different stages according to the shifts in the economic policy: centrally planned economy (19532-78), planned commodity economy (19793-92), socialist market economy (1993-1999) and post-industrialism. Table 1 summarizes the general stages of economic development during the last 40 years. In 1997 Hong Kong was unified to the Mainland China as a Special Administrative Regions (SAR) and in 1999 Macao became a SAR. Their history and development is different from China. The political orientation since 1979 can also be called an “Opening Policy”, as foreign investment was allowed at the end of 1978 and the planned economy restrictions were removed. Since the end of the 1970s there have been changes not only in the applied economic policy, but also in the economic ideology. The old planned economy system was never totally abandoned, but rather, parallel new ideas cultivated a dual-track transition to a market economy (Gang, Perkins and Sabin, 1997). The objective of the reforms is to develop a socialism that is suitable to the conditions in China. According to Chinese scholars, socialism has not failed but rather, China has failed to interpret socialism in a proper way (Hsu, 1991). Understanding of these changes in the economic philosophy or ideology is essential for the full comprehension of the current situation. It is necessary to emphasize that the old system and ideology have not been abandoned, and that the new system has to operate parallel within the constraints of the old structures.. 8.
(17) Table 1 Different stages in the economic development of the PRC (except Hong Kong and Macao) Characteristi Economic stage cs Post-industrialism Socialist market Planned Centrally (2000-) commodit economy planned (1993-1999) y economy economy (1953-78) (1979-92) Economic law, Diminishe Indirect control Direct Government indirect control d direct administrative intervention control control Orientation of business. Production oriented, plan fulfillment. Ownership. State, collective. Product policy. State plan. Price. Fixed. Advertising. Prohibited. Operation oriented, profitabilit y, sale State, collective, emergence of private and foreign Limited freedom, meeting plan first Fixed, floating, black market Allowed. Market oriented, profitability. Higher consumer demands. State (still dominant in some fields of industry), collective, private (high growth),foreign Autonomy. More sophisticated local players (state, collective and private) foreign (after WTO intensified competition) Branding (local and international). Free market price (except raw material). Value-added pricing. Long term and brand effectiveness Source: Adapted from Ying Fan,1994, Blending East and West, How Can Western Management Know-how be Transferred to China's Socialist Market Economy, Durham University Business School, Durham; Schlevogt K.-A.,2000, The Branding Revolution in China, The China Business Review, vol. 27, no. 3, p. 54) (cited from Pia Polsa, Stella L.M. So and Mark W. Speece). 9. Allowed.
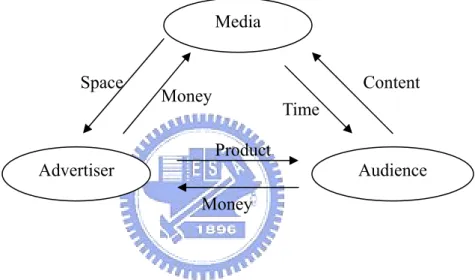
(18) 2.3 Introduction to Advertising and Mass Media Media products have an unusual characteristic which is their joint product nature. Picard (1989) pointed that media industry is operating in two product markets; media product market and advertising product market, also called “Dual Product Market”. In media product market, it provides program contents to consumers, the audience, who spend the money and time to change the programs in leisure time. In the other hand, in advertising product market, media provides advertisers with the time and space of advertisements as the figure 1 shows. Media Space. Content. Money. Time Product. Advertiser. Audience Money. Figure 1 Dual Product Market. 2.3.1 Advertising The advertising industry is a mirror of economic and social development. In our complex society, advertising also has evolved into a vital communications system from both consumers and business. In market-based economies, consumers have learned to rely on advertising and other forms of promotion for information they can use in making purchase decisions. 2.3.2 Mass Media The channel (or medium) used to deliver the massage to the target audience. At the broadest level, channels of communication are of two types, personal and non-personal. Personal channels of communication are direct interpersonal. 10.
(19) contract with target individuals or groups. Non-personal channels are generally referred to as the mass media such as TV, newspaper, internet and so on. Television and radio, or the broadcast media, are the most pervasive media in most consumer’s daily lives and offer advertisers the opportunity to reach vast audiences. TV has grown faster than any other advertising medium in history and has become the leading medium for national advertiser. Radio has evolved into a primarily local advertising medium that offers highly specialized programming appealing to narrow segments of the market. Magazine and newspapers are the two major forms of print media. Newspapers represent the largest advertising medium in terms of total volume, receiving nearly a fourth of all advertising dollars. Magazines are a very selective medium and are very valuable for reaching specific types of consumers and market segments. After 1994, the Internet has been the most rapidly adopted medium. Appearance of online advertisement further widened the advertising market, offering advertisers another transmission option. The above facts indicate that the advertisement release industry was moving to the buyer’s market, and no media could monopolize the transmission space. Meanwhile, the geographical partition by traditional means was not viable. Advertisers started to pay more and more attention to the coverage of one media, reading rate, watching and listening rate, as well as quality of service, rather than the factors associated with human feelings, governing power and relationships, even though they have some influences in selection of media. Intense competition awareness has enabled the operation and management of media operation units to be more market-oriented and internationalized. 2.4 Overview of Advertising Industry in China A common criticism of advertising is that it manipulates consumers into buying things that they do not need;That is, this kind of need is created by advertisements. From Marx view, that is like “false need” and they believed that the false needs would cause human were controlled by the physical desire.. 11.
(20) Therefore, Chinese government ever prohibited the commercial advertisements and media was just a tool for political propaganda. After late 1970s, China began to adopt a reform and open-door policy and its economic has maintained steady, high speed growth for more than 20 years. Chinese households are spending more on entertainment with more money at hand and leisure time. Zhao (1998) pointed that in the backdrop of nationwide economic reform; Chinese media industry also began its market-orientated commercialization during the 1980s and gained accelerated momentum in the 1990s, a new operating environment in the making. For Chinese politics and media development, a watershed of the year is 1978.In that year, the third plenum of the 11th Central Committee of the Chinese Communist Party adopted the open-door policy and identified modernization and linearization were undertaken. The year to 1979 to 1982 witnessed the initial growth phase of China’ Advertising industry. The China Advertising Association was founded in 1982, indicating the growing industrial self-consciousness of the advertising industry. From 1983 to 1992, advertising industry in China took a leap because of the first statute regarding the advertising industry was introduced. Around 1989, some foreign advertising companies successively set up offices in large cities in China. 1992 was a milestone for China’s advertising industry. The advertising expenditure in the whole country broke through the 6 billion Yuan market in that year, an increase of 93.4% compared to the yesteryear. Advertising input accounted for 255% for GNP, which is an increase of 57.4% compared to the last year; the average cost of advertising in China increased to 5.79 Yuan, an 91.2% increasing rate than previous year. During 1992, the turnover of advertising companies increased by 169.1% compared the yesteryear. The advertising operation in media turnover kept growing fast, especially in TV which the turnover increased by 105.4%. (See Table2). 12.
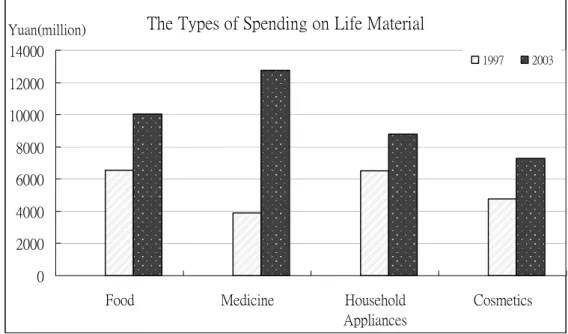
(21) Table 2 Adverting Market Statistics in 1992 Compared to Enterprises Classification Turnover(million) yesteryear(%) & Units Ad. 1864.03 169.1 1156 companies TV station 2054.71 105.4 838 Broadcasting 199.20 37.5 623 station Newspaper 1618.32 68.2 1387 agency Magazine 172.67 72.8 2327 Source: China Advertising Yearbook, 1999. Compared to yesteryear(%) 7.4 12.2 3.7 6.9 5.9. The Advertising Low of People’s Republic of China was launched on October 27 of 1994, and carried out a re-standardizing of advertising practice and maintenance of market order on February 1 of 1995, enabling the advertising market to be standardized and therefore mature further. Media developed to multiple varieties, and transition to the buyer’s market in the late 1990s. Advertisement became more specialized in contrast to the large and complete and small and complete natural economic characteristics reflected in the advertising companies in the early 1990s, the advertising industry in the late 1990s started to change to specialization. Some specialized companies such as marketing planning type, media agency type, professional production type (divided into movie and television ad production and plane ad production), technical service type, information counseling type, comprehensive service type, and so forth, emerged. Although the most of them were still in the initial stage, the advantages of specialization became more and more obvious, enabling more unified service and more reliable quality of service. At present, some local advertisement companies have directly served foreign large clients to great acclaim. 2.4.1 Spending Types Aspect Advertisement investments in China divided into three product types: production material, life material and others types. The advertisement investments of life material took the lead and increased rapidly. The leading for products in the. 13.
(22) regards in life material are food, household appliances, medicine and cosmetics which dominated the industry since late 1990s. In the spending on medicine advertising valued 12.74 billion Yuan, an increase of 222.63% compared to 1997, accounting for 11.82% of the total amount; spending on foods valued 10.04 billion Yuan, increasing by 53.01% compared to 1997, accounting for 9.31% of the total amount; for household appliances and cosmetics, the value are 8.8 billion Yuan, 7.3billion Yuan, an increase of 8.16%, 6.77% compared to 1997. The four main types are reached 36.05% in the whole real martial category. The Types of Spending on Life Material. Yuan(million). 14000. 1997. 2003. 12000 10000 8000 6000 4000 2000 0 Food. Medicine. Household Appliances. Cosmetics. Figure 2 The types of spending on life material 2.4.2 Geographical Aspect Due to the unbalanced geographical development, difference cultures and policies, the advertising industry is also having non-equilibrium development. Since the reform and opening up, economy in coastal areas has developed relatively fast, and its degree of development was remarkably higher than middle and western areas. Development of the advertising industry mirrored this trend, and this gap is becoming more apparent. According to statistics, among the 10 leading provinces, municipalities and directly affiliated cities regarding advertisement turnover, there are eight which are in coastal areas. In 2003, the sum of advertisement turnovers in Beijing, Guangdong, Shanghai, reached 55,551 billion Yuan, accounting for 51.5% of the total turnover in the whole 14.
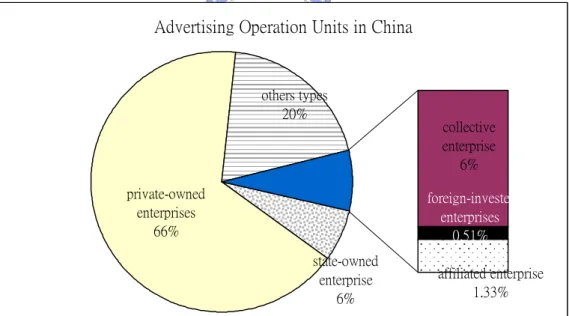
(23) country. Moreover, advanced advertisement technologies and talents are also concentrated in these economically-developed areas. 2.4.3 Economically-Composed Aspect According to operation units, advertising companies could divide into six classifications: state-owned enterprise, collective enterprise, private-owned enterprises, foreign-invested enterprises, affiliated enterprise and others. In 2003, the turnovers of affiliated enterprise are the fast growing in whole classifications, their units increased by 11.35% and their turnover increased by 54.75%. However, advertising market is composed by private-owned enterprise, state-owned and foreign-invested enterprise. To sum up, it can be concluded that the advertisement operation of state-owned and collective units were experiencing slight fluctuations, while the private and co-operation enterprises were still maintaining their dynamic growth. Advertising Operation Units in China. others types 20%. private-owned enterprises 66%. collective enterprise 6% foreign-invested enterprises 0.51%. state-owned enterprise 6%. affiliated enterprise 1.33%. Figure 3 Advertising operation units in China The advertising agencies connected with the government units are the ones with a close relationship with government-owned media. It is also argued that many agencies engage in creating advertising, but cannot provide a full range of marketing services (Guo et al., 1995). However, Luk et al. (1995) point out that relationship management, a crucial marketing function in the Chinese cultural context, can be provided by many agencies. Because media firms are in “a. 15.
(24) superior political position to advertising agencies,” in many cases they decide with whom they will deal and what kinds of advertising they will accept. Therefore, in-house media agencies provide good connections to media, but most of the time they are unable to provide other marketing services (Luk et al., 1995). Many multinational advertising agencies operate in China, serving mainly foreign-funded or joint-venture companies (Cheng and Frith, 1996,). They provide internationally skilled marketing services, but consider as their main problem connections to media organizations. For example, media rates vary according to how ‘foreign’ the advertised product is (Cheng and Frith, 1996). Since WTO membership foreign advertising agencies are no longer required to operate in China through joint-ventures. 2.4.4 The Relative Issue of Advertising in China Table 3 The Impartment Issue in Advertising Industry in China Year. Issue. archae-society. Yangshao culture z Use pictures depict history. Warring States Period. Hang billings which relative with its own business in store. 1883. The first magazine is published in Guangzhou. 1942. The first media reform. 1945. The second media reform. 1949. Mainland China is unsettled and advertising industry is stagnant. 1956. The hired media reform. 1958. Television was introduced into China. 1965. Cultural Revolution began. 1950s-1960s. Advertisement as a tool of political propaganda. 1978. The watershed for Chinese politics z Open doors and embarked on a market-oriented economy. 16.
(25) 1979. The first TV advertisement was broadcasted by CCTV. 1980. 10th National Broadcasting Working Forum was convened. 1982. The China Advertisement Association was founded. 1989 1992. 1994 2001. Foreign Advertisement companies set up offices in large cities in China The watershed for the Chinese advertising industry z The advertising expenditure in the whole country broke through the 6 billion Yuan market The Advertising Law of the People’s Republic of China The Internet has been the most rapidly adopted medium China joined into WTO officially. China’s television advertising market was around $2 billion dollars Source: edited by this research 2002. 2.5 Overview of Mass Media in China Ideologically, the Communist Party sees mass media as tools in propagating socialist ideals and in executing Party Policies. The modern times media reform was preceded by three reforms in the history of the Chinese Communist Party (Staff Commentator, 1986). The first reform was launched on April 1, 1942, by the Liberation Daily in the Chinese in Communist guerrilla base of Yanan. The second reform was spearheaded in October 1945 by the New Chin Daily in Chonhqing, wartime capital of the Nationalist government. The third reform was led by an editorial in the People’s Daily on July 1, 1956. All three reforms were aimed at better executing the Party’s policies and goals, the policies and goals themselves differed in different reform periods. The first two reforms coined with the Chinese Communist’s united front against the Japanese and the Nationalist government. Thus, the first one called for unswerving loyalty to the Communist Party and the people; the second placed the people over the Party, with a view to rallying greater popular support against the Nationalist government. The third one was coordinated in response to Chairman Mao’s call for more criticism. 17.
(26) In contrast, the present one initially was launched to restore the public’s confidence in the Party and the media after the arrest of the Gang of Four and the conclusion of the Cultural Revolution in the mid-1970s. It was later crystallized to promote the Party’s “reform and open-door” policies. In short, the present reform differs from the previous ones in that it has been engaged in promoting economic reforms and greater openness. 2.5.1 Print Media The growth of print media in China closely follows changes in Chinese politics. The Culture Revolution began in 1965; the media seems to be at a standstill. In 1970, after then president, Liu Shaoqi, and a number of prominent “revisionist” Party leaders were purged, only 21 magazines were published and newspaper titles were reduced to 21(Paul, 1994). In China, publishing is tightly controlled by the Communist Party. Regular news-work meetings are held between newspaper editors and Communist leaders in some cities such as Shanghai and Wenzhou (Du, 1992; Wu, 1992).A great deal and types of print were determined by official rather than consumer needs. Consequently, the print media faced great challenges when China embarked on a market-oriented economy in 1978. According to Editorial Department of PRC Yearbook (2002), the combined circulation of newspapers and magazines reached a peak of 310 million copies but down to 232 millions from 18 to 1991. The drop may be explained by the liberalization or loosening of official control in the print market in recently years. 2.5.2 Radio and Television A number of radio and television receivers have became increasing fast in the 1980s. In 1980, there was less than 1 television receiver per 100 persons. By 1990, the figure had risen to 16.2 per 100 persons. A national survey conducted by China Central Television in 1987 showed that of the 1.07 billion people, 590 million (55%) were able to watch television. Among them, 370 million lived in cities, comprising 93% of the urban population, whereas 220 million lived in villages, accounting for only 33% of the rural population (Chen, 1992).. 18.
(27) Wired broadcasting is a major communication link between the government and the rural populace. The wired broadcasting stations not only relay radio programs of central and provincial stations but also produce their own programs. Wired broadcasting in China is a mass medium with a distinctive local flavor. The decline of wired broadcasting in China was due to the growth of television. Since the middle of 1990s, the media in China has a series of changes. First of all, media tended to be multi-variant. TV stations increased their channels and columns, local cable TV stations were founded, economy channels were opened and programs were transmitted via satellite. All these changes gradually weakened the monopoly post of television media, forming a competition environment. Newspaper is the second largest media body in China. The emergence of newspaper groups changed newspaper agency’s operation organism, enabling multiple newspapers in one agency and multiple periodicals in one agency. Central newspaper agencies were supplemented with local versions. Competition in newspaper market became more intensive.. 19.
(28) 2.6 Advertising in Consumer’s Market in China 2.6.1 Consumer behavior on advertisement in China In China, television is the most exposure medium in China, as Table 4 and Table 5 show. After television, consumers are most exposed by printed advertisements and followed by radio and outdoor advertisement. The strata with least education, the working poor, spend the most time in listening to the radio. The effect of television advertising is further strengthened by the fact that TV advertisements are the one that are the most accurately memorized by the audience. Table 4 Audience exposure to advertising media of Daily Often Rare. Frequency Never exposure TV ad 60.7 % 25.0 % 6.6 % 7.7 % Radio ad 14.0 % 36.0 % 41.4 % 8.5 % Printed ad 17.7 % 50.9 % 15.0 % 16.4 % Outdoor ad 10.5 % 40.0 % 23.6 % 26.0 % Source: O.G.Guo, F. Tong, H.Niu & L.S.C. Yip (1995), “Firms’ media Strategy in the Advertising Industry of China, in eds. K.Basu, A. Joy, & Z. Hansheng, Proceeding of the Fifth International Conference of Marketing and Development, June 22-25, Beijing, p. 405 Table 5 Media use per consumer segment Media time per Consumer segment day Little Yuppies rich Television time 136 min 139 min 143 min 146 min Radio time 57 min 40 min 41 min 42 min Newspaper time 44 min 43 min 52 min 60 min Magazine time 46 min 52 min 67 min 61min Source: Cui G. and Liu Q. (2001), “Emerging Market Segments in a Transitional Economy: A Study of Urban Consumers in China”, Journal of International Marketing, vol. 9, no. 1, pp. 91 Working poor. Salary class. Table 6 shows that consumers remember advertisement from radio better than from printed advertising. Outdoor advertising has a less long-lasting effect on audience. When the actual purchasing decision is made, the effect of TV advertising is still strong, but does indeed vary in different product groups.. 20.
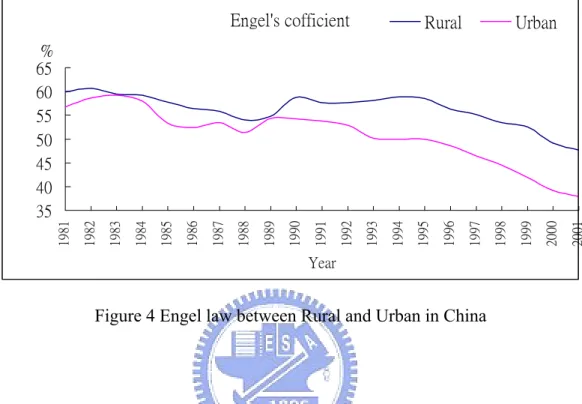
(29) The other mass-media promotion is not as important as information from the network of friends: the effect of friends’ opinions is the next most influential agent after TV advertising for all the product groups (see Table 5). This proves that traditional cultural influences on social relation still persist. In addition, the importance of exhibitions as a motivation for apparel purchase reinforces the principle that Chinese consumers want to investigate consumer durables before they purchase, rather than using the possibility to after-sales service or warranty.. Table 6 Buying motive, promotional media and product types Outdoor Friends TV ad Radio ad Print ad ad. Exhibition. Household 52.4 % 3.7 % 2.8 % 1.2 % 23.0 % 2.7 % electronics Daily 37.7 % 9.5 % 4.1 % 2.1 % 14.8 % 3.0 % necessities Food 37.2 % 6.0 % 3.3 % 2.4 % 13.1 % 3.8 % Apparel 29.2 % 7.2 % 7.9 % 2.1 % 12.6 % 1.3 % Drugs 37.1 % 7.2 % 7.9 % 2.1 % 12.6 % 1.3 % Health 34.2 % 6.1 % 1.4 % 8.5 % 1.9 % care Source: O.G.Guo, F. Tong, H.Niu & L.S.C. Yip (1995), “Firms’ media Strategy in the Advertising Industry of China, in eds. K.Basu, A. Joy, & Z. Hansheng, Proceeding of the Fifth International Conference of Marketing and Development, June 22-25, Beijing, p. 405 2.6.2 The relationship between Engel law and mass media spending The Engel law would suggest that increasing or decreasing changes in income translate into corresponding changes in mass media spending, but it does not imply that the share of income on mass media should be a constant. In hindsight, few economists would hypothesize a constant relationship between income and expenditures on a good over time, whether this good is inferior, a necessity, or a luxury (Landsburg, 1992). Basically, the share of spent on food is fewer, the money spent on improving life is more. The lower Engel’s coefficient reflects the developing of service industry is more prosperous. However, the peasant still have 50% share of income on food expenditure; 21.
(30) That is, they don’t have extra money to spent on entertainment or others. On the other hand, the Engel’s’ coefficient of people living in cities is declining from 50% to 40% in the past 20 years. Engel's cofficient. Rural. Urban. Year. Figure 4 Engel law between Rural and Urban in China. 22. 2001. 2000. 1999. 1998. 1997. 1996. 1995. 1994. 1993. 1992. 1991. 1990. 1989. 1988. 1987. 1986. 1985. 1984. 1983. 1982. 1981. % 65 60 55 50 45 40 35.
(31) 3. MODEL BUILDING AND HYPOTHESES 3.1Original PRC Models Pointing out that multiple interpretation of what economic constancy means are possible, Wood (1986) introduced two regression equations, the time-trend constancy model and income-share constancy model. The time-trend model, a regression version of the conceptualization used by McCombs (1972) and McCombs and Eyal(1980), is Mt=βo+β1Dt+β2Ypt+ut. (1). – Mt : money spending on mass media in year t – β0 : constant term – Dt : time variable equal to year t – Ypt : personal income in year t – ut : an error term When, – β1 = 0, there is no time trend in spending on mass media. – β1 > 0, there is an upward trend in spending on mass media – β1< 0, there is a downward trend in spending on mass media. The principle of relative constancy predicts that is equal to zero. The income-share model describes the relationship between income and consumer spending on mass media directly, where the time-trend model expresses the relationship of consumer spending on mass media to time, controlling for disposable personal income. In detail, the income-share model is: Mt=Ao+A1Ypt+ut. 23. (2).
(32) – Mt : money spending on mass media in year t – A0 : constant term – Ypt : personal income in year t – ut : an error term When, – A0 = 0, income-share is constancy – A0 > 0, income share of media will fall with an increase in income – A0 < 0, income share of media will growth with an increase in income 3.2Hypotheses From the idea of principle or relative constancy, these three hypotheses tested the long-term increasing growth of advertising expenditures (i.e., over 23 years). This study proposes the following hypotheses that one may expect: First of all, it was hypothesized that, inconsistent with the principle of relative constancy and the China advertising environment, advertising expenditure would be increasing fraction of yesteryear GNP over last two decades. The hypotheses for the income-share constancy can be expressed as model 1. The hypothesis 1 assumes that that change in national income —GNP, Rural Income, and Urban DPI—, will remain constancy with changes in the absolute amount of money pent on advertising. Model1-1: Advertising expenditures1981-2003 =β0 +β1GNP + e Model1-2: Advertising expenditures1981-2003 =β0 +β1Rural Income + e Model1-3: Advertising expenditures1981-2003 =β0 +β1Urban DPI + e H0: β0= 0 Then, we add the lagged variable to test the regression in hypothesis 2. Model 2 is a representation of a dynamic regression model. A regression model is said to be dynamic if it contains a lagged dependent variable (i.e., variable at t-1, t-2) or lagged independent variable (Doran, 1989) Dynamic regression analysis was. 24.
(33) performed to assess whether changes in mass media expenditures react immediately to changes in GNP (or in other variables) or whether the effect of GNP (or in other variables) is spread over several time periods. In this study, dynamic regressions include both lagged dependent and independent variables; they are aptly labeled autoregressive distributed-lag models. (Giffiths, Hill, & Judge, 1993) Model2: Advertising expenditures1981-2003 =β0 +β1 ad (t-1) +β2 GNP +β3 GNP (t-1) +. e H0: β0=0. Third, it was expected that total advertising expenditures would not fluctuate significantly on the increase over time, holding national disposable income constant. The hypothesis for the time-trend can be expressed as model 3. This study also will divide to two periods to examine whether the time trend is happened or not in short term. Therefore, hypothesis 3 assumes that changes in proportion of spent on advertising in China will constancy over time. Model3: Advertising expenditures =β0 +β1 time +β2 GNP +e H0:β1=0 According to 1992 was a milestone for China’s advertising industry, this study assumes that it is a path-diverting in 1992. Hypothesis 4 assumes that there is difference advertising expenditure between the year of 1992 before and after. Therefore, we added the slope of trend dummy variable and the regression is model 4. Model4: A advertising expenditures =β0 +β1 Dummy +β2GNP +e H0:β1=0 3.3Data Collection The dependent variable is advertising expenditures, recorded in million of Yuan. The original intention of this article is to employ consumer expenditures as a dependent variable, but systematic data in China are unavailable. However, media products have an unusual characteristic which is their joint product nature. 25.
(34) Lacy & Simon (1993) provide that Media sell information and entertainment to consumers and space and time to advertisers. The products that service two markets with one production process are called joint products. McCombs noted (1972), “When they have more money, consumers and advertisers will spend more on mass media. When they have less, they will spend less on mess media. ” According as the researches as above, therefore, this study uses the money spent in advertising as a dependent variable. This study would use the advertising expenditure included total expenditures and popular mass media in China (TV, radio, newspaper and magazine). The advertising data were prepared by China Advertising Almanac and data on money spent on advertising are available for the entire time series. The yearly data set, which contains data measured at yearly intervals from 1981 to 2003, for a total 23 observation. In China, because the most of household’s income data are divided into two parts, countryside and city, and the imbalanced income between rural household and urban household, we decide to use the Gross National Product (GNP), the first independent variable, as a measure of general economic conditions to test all models. Besides, we also use rural income and urban DPI (disposable personal income) respectively to test the Model 1 in order to deal with especial stations in China. GNP is recorded in actual 100 millions of RMBs; rural income and urban DPI are recorded in actual Yuan. All three national income data were taken from China Statistical Yearbook (China Statistics Press, 2004). 3.4Data Analysis This study used EViews5 fro all time-series regression analyses. Specification-wise, all regression models were first log-transformed1 and then first-differenced. Mode l and model 2 were first run with aggregate advertising expenditures and then with each of the four mass media (TV, radio, newspaper and magazine).. 1. Logarithmic transformation is a standard procedure in economic empirical analysis to alleviate problems of herteroscedasticity. An attractive characteristic of the double-log functional form —that made it widely popular in applied research—is that the slope coefficient b directly measure the elasticity of Y in respect to X (Gujarati 1988) 26.
(35) Because this study involved variables measured over time, it is necessary to test for the presence of auto correlation. If residuals at different time are correlated, successive observations will then be related to each other (Ostrom, 1990).These result the so-called “spurious” regression, which may occur when the R2 is very high, but the Durbin-Watson (DW) value is extremely low. If the Durbin-Watson value was larger then the upper bounds of dU, we assumed the absence of autocorrelation. If the Durbin-Watson value was larger then or equal to dL, but small than or equal to dU, then the test was inconclusive (Neter, Wasserman, and Kutner, 1985). To control for autocorrelation, exact maximum-likelihood regression is employed in the analysis (Kohn and Ansley, 1986), or Granger and Newbold (1974) recommended to first-order difference all variables (i.e., subtracting observations at t-1 from those at t) involved in the equation. Moreover, the classical linear regression model requires that the error term be not serially correlated and variance must be the same. Heteroscedasticity is more likely to occur with cross-sectional data than with time-series data because the latter deal with aggregate longitudinal consumption series and not with individual consumers at a given pointing time. In this study, all regression analyses were diagnosed and no problem of heteroscedasticity was uncovered.. 27.
(36) 4. RESULTS 4.1 H1 & H2: GNP and Absolute Advertising Spending. The data partially support H1, and agree with the income-share hypothesis. Table 7 & 8 are shows that β0 is zero which suggesting constancy. Besides, the results also posited that changes in GNP correlate positively with changes in actual Yuans spent on advertising. Scatterplots (not presented) of the residuals from regression analyses revealed that several regression assumption, including normality, nnonautocorrelation, and constant variance, are violated when using the raw values. In all data sets, log transformation corrected for the problems. Because all variables were log-transformed, we can interpret the value of the regression coefficients as elasticity of the independent variable in respect to the dependent variable (Phlips, 1993). More precisely, logarithmic first-differencing can be interpreted as the percentage change in Y (the dependent variable) from period t-1 to period t for a given change in X (the independent variable; Berndt, 1991). In 1981-2003, the results show that a 1% change in GNP products a 21.752% increase on totally advertising expenditures when controlling for autocorrelation, see table 6. This study also tests the advertising expenditures on four main media in China, and we find that a 1% change in GNP products a 2.004% increase in advertising expenditures of TV, a 1% change in GNP products a 1.263% increase in advertising expenditures of radio, a 1% change in GNP products a 2.025% increase in advertising expenditures of newspaper, a 1% change in GNP products a 0.422% increase in advertising expenditures of magazine. In the yearly data set, lagged values f the dependent variable (t-1) was used in this study because the effect of advertising expenditure is not likely to be instantaneous. The Model 2 examines the influence of lagged variable on changes in mass media expenditures, especially for media durable products. Table 8 shows that total advertising expenditures are affected by yesteryear GNP and total advertising expenditures. Money spent on magazine is also affected by its yesteryear advertising expenditure. Because of the particular income data-collection in China, this study also use the rural income and urban DPI respectively to test the Model 1 to understand that whether changes in citizen income correlate positively with changes in actual Yuan spent on advertising or not. 28.
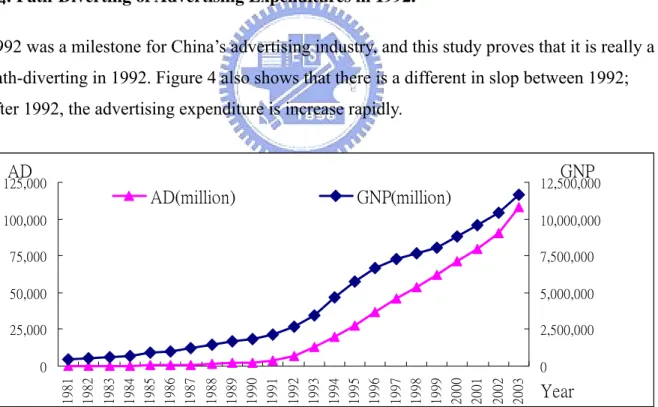
(37) Table 8 shows that 1% changes in rural income products a 0.899 increase on totally advertising expenditures when controlling for autocorrelation; 1% change in urban DPI products a 1.47 increase on totally advertising expenditures when controlling for autocorrelation. Overview the regression which with rural income and urban DPI, we discover that only urban DPI effect significantly the total advertising expenditures; 1% change in urban DPI products a 1.342 increase on totally advertising expenditures when controlling for autocorrelation. H3: Relative Spending Over Time The data support H3, which posited that the proportion of nation income (GNP) spent on advertising would remain relatively constant in China, a finding is accordant to the PRC. Table 9 also shows that the tow short term periods (1981-1992 / 1992 2003) remained relatively constant — the trend line is not statistically significant. H4: Path-Diverting of Advertising Expenditures in 1992. 1992 was a milestone for China’s advertising industry, and this study proves that it is really a path-diverting in 1992. Figure 4 also shows that there is a different in slop between 1992; after 1992, the advertising expenditure is increase rapidly.. AD. GNP. 125,000. AD(million). 12,500,000. GNP(million). 100,000. 10,000,000. 75,000. 7,500,000. 50,000. 5,000,000. 25,000. 2,500,000. 2002 2003. 1997 1998 1999 2000 2001. 1992 1993 1994 1995 1996. 1988 1989 1990 1991. 1983 1984 1985 1986 1987. 0 1981 1982. 0. Figure 5 Path-Diverting of Advertising Expenditures. 29. Year.
(38) Dependent Variable. Table 7 Static Regression Models of Advertising Expenditures (1981-2003) Independent Variable (Coefficient) Intercept. GNP. R2. Ad-R2. F. DurbinWatson d. Total Ad. 0.057 (0.054). 1.752*** (0.339). 0.572. 0.550. 26.697***. 1.263. TV. 0.070 (0.104). 2.004*** (0.821). 0.377. 0.342. 10.873***. 1.003 a. Radio. 0.060 (0.035). 1.263*** (0.294). 0.424. 0.392. 13.269***. 2.392 a. Newspaper. -0.014 (0.054). 2.025*** (0.520). 0.542. 0.517. 21.300***. 2.634 a. Magazine. 0.059 (0.077). 0.422** (0.508). 0.185. 0.140. 4.092*. 3.088 a. Model1: Advertising expenditures1981-2003 = b0 + b1 GNP+ e a Standard errors were adjusted using the Newey-West procedure. *p ≤ .10. **p ≤ 0.05***p ≤ 0.01. 30.
(39) Table 8 Dynamic Regression Models of Advertising Expenditures (1981-2003) Dependent Variable. Independent Variable (Coefficient) Intercept. Ad(-1). GNP. GNP(-1). R2. Ad-R2. F. DurbinWatson d. Total Ad. 0.062 (0.069). 0.480* (0.142). 1.343** (0.871). -0.673** (0.315). 0.637. 0.573. 9.964***. 1.589a. TV. 0.054 (0.084). 0.453** (0.787). 1.674* (0.897). -0.824 (0.682). 0.510. 0.411. 5.194**. 2.063 a. Radio. 0.071* (0.072). -0.296 (0.202). 1.640** (0.705). 0.070 (0.459). 0.472. 0.366. 4.466**. 1.867 a. Newspaper. 0.023 (0.057). -0.155 (0.190). 2.854*** (0.628). -0.775 (0.452). 0.607. 0.528. 7.712***. 2.175 a. Magazine. 0.173 (0.111). -0.519*** (0.215). 1.753* (0.913). -0.085 (1.001). 0.479. 0.374. 4.591***. 1.668. Model2: Advertising expenditures1981-2003 =β0 +β1 ad (t-1) +β2 GNP +β3 GNP (t-1)+ e Note. AD(-1) = advertising expenditure (t-1) of each media; GNP(-1) = Gross National Product (t-1) a Standard errors were adjusted using the Newey-West procedure. *p ≤ .10. **p ≤ 0.05***p ≤ 0.01. 31.
(40) Table 9. Static Regression Models of Advertising Expenditures on citizen income Dependent Variable. (1981-2003). Independent Variable (Coefficient) Intercept. Rural. 2. Urban. R. 0.209** 0.899** -0172 (0.065) (0.393) 1.470*** 0.120 Total Ad 0.347 -(0.476) (0.070) 0.116 0.179 1.342** 0.351 (0.071) (0.597) (0.634) Model1: Advertising expenditures1981-2003 = b0 + b1 Nation Income + b2 CPI + e Note. AD(-1) = advertising expenditure (t-1) of each media a Standard errors were adjusted using the Newey-West procedure. *p ≤ .10. **p ≤ 0.05***p ≤ 0.01. 32. Ad-R. F. DurbinWatson d. 0.131. 4.163*. 0.858a. 0.314. 10.626***. 1.095a. 0.283. 5.142**. 1.107a. 2.
(41) Table 10 Relative Advertising Expenditures Regressed on Time Advertising Expenditure Year 1.1981-2003 2.1981-1991 3.1992-2003. Independent Variable (Coefficient) Intercept 0.181** (0.078) 0.262** (0.097) 0.266 (0.146). Time-Trend -0.007 (0.004) -0.014 (0.008) -0.022 (0.013). GNP 1.530*** (0.331) 1.119* (0.530) 1.032 (0.486)*. R2. Ad-R2. F. Durbin-Watson d. 0.652. 0.615. 17.783***. 1.446. 0.491. 0.346. 3.376*. 1.685. 0.791. 0.738. 15.116***. 1.661. Model3: Advertising expenditures =β0 +β1 time +β2 GNP +e *p ≤ .10. **p ≤ 0.05***p ≤ 0.01 Table 11 The Path-Diverting Effect of Advertising Expenditure in 1992 Dependent Variable Intercept Total ad. 0.112* (0.058). Independent Variable (Coefficient) Dummy (Time 1992) GNP -0.083* (0.044). 1.659*** (0.323). Model4: A advertising expenditures =β0 +β1 Dummy +β2GNP +e Note. Time = before 1992 is 0;after 1992 is 1 *p ≤ .10. **p ≤ 0.05***p ≤ 0.01 33. R. Ad-R. F. DurbinWatson d. 0.642. 0.602. 16.908***. 1.948. 2. 2.
(42) 5. CONCLUSIONS 5.1 Discussion The PRC assumes that income determines changes in mass media spending, because the relationship between the two variables is hypothesized to be proportional. Evidently, this is proven in China. This research also suggests that significant determinants of GNP on advertising expenditures vary according to the type of mass media expenditures. In China, GNP is a good predictor of changes in advertising expenditures. GNP can be proven in all mass media and total advertising expenditures. Clearly it is equally important to run regression analysis with individual categories of mass media expenditures as it is with GNP.This study accords to Dupagne (1997) to test the important of incorporating current as well as lagged regressors beyond PRC’s current income model. The fact that lagged advertising expenditures (Adt-1) was found to be good predictor for some of the regressions such as TV and magazine. Because of special situation on citizen data collection in China, this study also tests respectively rural income and urban DPI changes in advertising expenditures. We found that the urban DPI is a better predictor than rural income. The result is reasonable because advertisement is a symbol of economics growth. Rural citizen don’t have more money to “pay” on advertisement than urban citizen do. In sum, the major conclusion of this study is that one of the basic assumptions underlings the relative constancy hypothesis. Although the media and advertising industry were still controlled by Chinese government, the amount of people spend with mass media is relatively constant or fixed, is also proven in China. Therefore, we infer that the man-made interference is not stronger to affect PRC hypothesis. In the future, there will more and more media develop rapidly in China, the PRC model could examine constantly to help understanding the advertising industry thoroughly. 5.2 Future Research In future research, researcher could focus on the special situation of China and try to find more predictors. This study is examining PRC model with the popular indictor, GNP as a predictor. Notwithstanding GNP is proven in China, the future research could find other variables 34.
(43) to test Chinese data whether are better explanation or not. Second, researchers could also focus the each mass media to find the more suitable predictors and to incorporate citizen income (rural income and urban DPI) with. The third field is to test further such as function e1uivalence—whereas the level of total media expenditures is expected to remain uniform over time. Because the insufficiency of data of internet and cable,. .. 35.
(44) REFERENCE Chen, L. D. " The concept of modernization and mass media in China," Paper Presented to the 34th International Congress of Asian and North African Studies, Hong Kong (1993) China State Statistics Bureau "China Statistics Yearbook 2001," Beijing: China State Statistic Publications (1999) China State Statistics Bureau "China Statistics Yearbook 2001," Beijing: China State Statistic Publications (2002) China State Statistics Bureau "China Statistics Yearbook 2001," Beijing: China State Statistic Publications (2004) Demers. David P. "Relative Constancy Hypothesis, Structural Pluralism, and National Advertising Expenditures," Journal of Media Economics 7(4): 31-48 (1994). Dimmick, John "The Theory of Niche and the Spending on Mass Media: The Case of the 'Video Revolution'," Journal of Media Economics 10(3):33--43 (1997). Dupagne, Michel. "Testing the Relative Constancy of Mass Media Expenditures in the United Kingdom," Journal of Media Economics 7(3):1-14 (1994). Dupagne, Michel. “ A Theoretical and Methodological Critique of the Principle of Relative Constancy.” Paper Presented at the Annual Convention of the Association for Education in Journalism and Mass Communication, Atlanta, Washington, DC. August (1995) Dupagne, Michel. “The Evolution of Consumer Mass Media Expenditures in Belgium, 1953-1991.” Paper Presented at the Annual Convention of the Broadcast Education Association, Las Vegas, NV. April (1996) Dupagne, Michel. "Beyond the Principle of Relative Constancy: Determinants of Consumer Mass Media Expenditures in Belgium," Journal of Media Economics 10(2): 3-19 (1997). Fullerton, Hugh S. “Technology Collides with Relative Constancy: The Pattern of Adoption for a New Medium.” Journal of Media Economics 1:75-84 Fall (1998). 36.
(45) Gang F., Perking D.H. and Sabin L. ”People’s Republic of China: Economic Performance and Prospects.” Asian Development Review, vol. 15, no. 2. pp. 43-85 (1997) Glascock, J. “Effect of Cable Television on Advertiser and Consumer Spending on Mass Media.” Journalism Quarterly 70(3), 509-517 Guo Q. G., Tong F.,Niu H. and Yip L.S.C. ”Firms’ Media Strategy in the Advertising Industry of China.” Proceedings of the Fifth International Conference of Marketing and Development, eds. Basu K., Joy A. and Hansheng Z., June 22-25, 1995, Beijing, People’s Republic of China, pp. 403-405 (1995) Hsu R. C. “Economic Theories in China, 1979-1988.” Cambridge University Press (1991) Lacy, Stephen, and Ghee-Young Noh. "Theory, Economics, Measurement, and the Principle of Relative Constancy," Journal of Media Economics 10(3):3-16 (1997). Luk S.T.K., Li H.Y., Guo Q.G.and Yip L.S.C.,The Strategic Roles of Advertising Agencies in China’s Domestic Market, unpublished Working Paper, Hong Kong Polytechnic University (1995) McCombs, Maxwell, and Chaim Eyal. "Spending on Mass Media," Journal of Communication 30(1):153-158 (1980). McCombs, Maxwell, and Jack Nolan. "The Relative Constancy Approach to Consumer Spending for Media," Journal of Media Economics 5(2):43-52 (1992). Mu Lin ”Changes and Consistency: China’s Media Market After WTO Entry” Journal of Media Economics17(3):177-192 (2004). Pia Polsa, Stella L.M. So and Mark W. Speece. “The People’s Republic of China: Markets within the Market” Picard , R. “Media economics: Concepts and issue.” Newury Park, CA: Sage (1989) Pual Siu-nam Lee “Mass communication and National Development in China: Media Roles Reconsidered” Journal of Communication 44, 3; (1994). Robert, G. Picard “Effect of Recessions on Advertising Expenditure: An Exploratory Study of Economic Downturn in Nice Developed Nations.” Journal of Media Economics14 (1):1-14 (2001). 37.
(46) Son, Jinok and Maxwell McCombs. "A Look at the Constancy Principle Under Changing Market Conditions," Journal of Media Economics 6(2):23-36 (1993). Werner, Anita. “Mass Media Expenditures in Norway: The Principle of Relative Constancy Revisited.” In Margaret McLaughlin, ed. Communication Yearbook 9. Beverly Hills, Calif.: Sage (1986) Wood, William C. “Consumer Spending on the Mass Media: The Principle of Relative Constancy reconsidered.” Journal of Communication 36(2)39-51 (1986). Wood, William C., and Sharon L. O'Hare. “Paying for the Video Revolution: Consumer Spending on the Mass Media.” Journal of Communication 41(1):24-30 (1991).. 38.
(47)
數據
+2
相關文件
6 《中論·觀因緣品》,《佛藏要籍選刊》第 9 冊,上海古籍出版社 1994 年版,第 1
You are given the wavelength and total energy of a light pulse and asked to find the number of photons it
好了既然 Z[x] 中的 ideal 不一定是 principle ideal 那麼我們就不能學 Proposition 7.2.11 的方法得到 Z[x] 中的 irreducible element 就是 prime element 了..
Students are asked to collect information (including materials from books, pamphlet from Environmental Protection Department...etc.) of the possible effects of pollution on our
volume suppressed mass: (TeV) 2 /M P ∼ 10 −4 eV → mm range can be experimentally tested for any number of extra dimensions - Light U(1) gauge bosons: no derivative couplings. =>
For pedagogical purposes, let us start consideration from a simple one-dimensional (1D) system, where electrons are confined to a chain parallel to the x axis. As it is well known
incapable to extract any quantities from QCD, nor to tackle the most interesting physics, namely, the spontaneously chiral symmetry breaking and the color confinement..
• Formation of massive primordial stars as origin of objects in the early universe. • Supernova explosions might be visible to the most
