Evaluation of Source Water Quality Standards for Total
Coliforms, TOC, and COD in Taiwan
E.-E. Chang
1; Pen-Chi Chiang
2; Yi-Li Lin
3; and Hsiang-Ping Tsai
4Abstract: The objective of this research is to review the current status of source water as compared with the Taiwanese source water quality standards promulgated in 1997. The total coliforms, total organic carbon 共TOC兲 and chemical oxygen demand 共COD兲 were selected as the major parameters for review because of their specific characteristics associated with the disinfection efficiency and disinfection by-products formation and in compliance with source water quality in Taiwan. The water treatment plant with unacceptable source water needs to improve its source water quality and establish the implementation plan based on the results of comprehensive performance evaluation. Throughout this investigation, it suggests that revisions to water quality standards be divided into two execution phases, to achieve the long-term goal of improving source water quality.
DOI:10.1061/共ASCE兲1090-025X共2005兲9:3共193兲
CE Database subject headings:Taiwan; Water quality; Water pollution; Organic carbons; Disinfection.
Introduction
The quality of source water in Taiwan is deteriorating rapidly due to discharges of domestic and industrial wastewaters. In addition to wastewater discharges, non-point source pollutants also play an important role to source water pollution. In order to avoid heavier source water pollution, popularize pollution-prevention program and ensure safe drinking water for public health, the Taiwan En-vironmental Protection Administration共Taiwan EPA兲 enacted the
Drinking Water Management Act 共DWMA兲, which was
promul-gated and became effective on November 10, 1972, and then amended on May 21, 1997. The major contents issued in this DWMA are as follows: general provisions, water source manage-ment, facility managemanage-ment, water quality managemanage-ment, penalties, and supplementary provisions.
Concern over defining standards for source water quality around the world is not only recent. In April of 1970, the Water Quality Committee of the Japanese Living Environment Council published water quality standards for water resources area to pro-tect the source water quality as well as public health 共Kiluchi 1975兲. In 1971, the United States Public Water Supplies Panel at the request of the U.S. Environmental Protection Agency pro-posed water quality criteria for source water共Van der Leeden et
al. 1990兲. In June of 1975, the council of European Communities 共EC兲 adopted a Council Directive for the Member States concern-ing the required quality of surface waters intended as sources of drinking water 共EC 1975兲. As for the source water quality stan-dards, criteria or guidelines adopted by countries around the world, either a uniform set of standards for all sources or various levels of standards for different source waters are formulated. For example, the United States and Australia adopted uniform stan-dards for source water quality instead of mandatory stanstan-dards to guide the water supply industry to improve drinking water quality 共NAS 1972; ANZECC 2000兲. However, Japan, Canada, France and the EC adopted various levels of standards 共Kikuchi 1995; MELP 1995; EC 1975兲. In Taiwan, the current regulations clas-sify water bodies into various classifications with corresponding water quality standards.
Since source water contamination is a universal issue, it ap-pears that enforcing mandatory source water quality standards may encounter compliance problems. Besides, seeking new drink-ing water sources is becomdrink-ing more difficult in Taiwan so that it is important to protect the source water as well as upgrade the treatment process in response to the poor source water quality. In order to ensure the safety of treated water to consumers, both the CCP共Composite Correction Program兲 and CPE 共Comprehensive Performance Evaluation兲 techniques suggested by USEPA 共1998兲 can be used herein to provide the technical information to deter-mine if searching for an alternative raw water source or optimiz-ing 共or upgrading兲 the existing water treatment is required. The CPE method is a systematic step-by-step evaluation of a facility’s design capabilities and associated administrative, operational, and maintenance practices to achieve the optimum performance of the facility in an existing plant. Then, a comprehensive assessment of the facility’s operation capability will be made and included in the performance-limiting factors for the selected water treatment plant. The water treatment plants in Taiwan that do not comply with the source water quality standards are requested to conduct the CPE program to evaluate the current capability of the unit treatment process, and have to develop the implementation plan as suggested by the CPE team to achieve the desired water quality.
1
Dept. of Biochemistry, Taipei Medical Univ., 250 Wu-Hsing St. Taipei, Taiwan共corresponding author兲. E-mail: [email protected]
2Graduate Institute of Environmental Engineering, National Taiwan Univ., 71 Chou-Shan Rd., Taipei, Taiwan.
3
Graduate Institute of Environmental Engineering, National Taiwan Univ., 71 Chou-Shan Rd., Taipei, Taiwan.
4Dept. of Biochemistry, Taipei Medical Univ., 250 Wu-Hsing St., Taipei, Taiwan.
Note. Discussion open until December 1, 2005. Separate discussions must be submitted for individual papers. To extend the closing date by one month, a written request must be filed with the ASCE Managing Editor. The manuscript for this paper was submitted for review and pos-sible publication on November 2, 2004; approved on November 23, 2004. This paper is part of the Practice Periodical of Hazardous, Toxic, and Radioactive Waste Management, Vol. 9, No. 3, July 1, 2005. ©ASCE, ISSN 1090-025X/2005/3-193–203/$25.00.
The objective of this research work is intended to review the current status of source water as compared with the source water quality promulgated in 1997. Total coliforms, total organic carbon 共TOC兲 and chemical oxygen demand 共COD兲 were selected as the major parameters because of their specific characteristic associ-ated with the disinfection efficiency and disinfection by-products 共DBPs兲 formation potentials. The average values of total coliforms, TOC, and COD are below 10,000 CFU/ 100 mL, 2 mg/ L, and 15 mg/ L in uncontaminated source water in Taiwan, respectively共Chiang et al. 2001兲. These parameters are routinely measured and cannot comply with the source water quality stan-dards all the time. Besides, these parameters have the character-istics of availability, representative, precision, and accuracy for review to determine if any further revision should be made. The future source water quality standards have been proposed as a result of the present study.
Rationale for Determination of Source Water Quality Standards
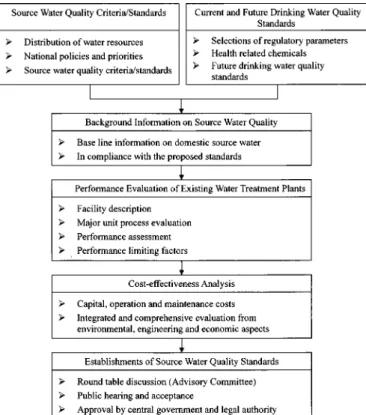
In selecting water quality parameters for source water quality standards, each enforceable parameter should be a representative indicator for water pollution including toxic and hazardous sub-stances. In determining the regulatory limits of each parameter, the following factors should be considered:共1兲 source water qual-ity criteria and standards from nations around the world;共2兲 cur-rent and future drinking water standards;共3兲 background informa-tion on source water quality; 共4兲 performance evaluation of existing water treatment plants; and共5兲 cost-effectiveness analy-sis. Fig. 1 presents the procedures to develop the existing source water quality standards in Taiwan共Chang et al. 1998, 1999兲.
The general principles regarding the above evaluation factors are stated as follows.
1. Source water quality criteria/standards from nations around the world. Since there are differences in the distribution of water
resources, policies, and national priorities, the source water qual-ity standards of various nations were adopted to suit the needs of each country in achieving predetermined goals.
The major sustainable indicators for water quality assessment would depend on the designated use of a water body. The United
States Water Pollution Act 共Public Law 92-500, commonly
known as the Clean Water Act兲 requires each State to conduct water quality surveys to determine the overall health of all water bodies. Under this survey, each State is responsible for designat-ing its rivers and streams for State-specific use. For example, Maryland classified streams within its State boundary into 7 cat-egories in order to comply with the requirements stipulated in the Clean Water Act. The major sustainable indicators for water qual-ity assessment of a stream designated for public water supply purpose in Maryland are fecal coliform, dissolved oxygen共DO兲, temperature, pH, turbidity, and toxic substances共Code of Mary-land Regulation兲. In the meanwhile, California takes BOD, coliform, DO, pH, chlorides, iron and manganese together with fluorides, phenolic compounds, color and turbidity as the source water indicators共Van der Leeden et al. 1990兲.
The Japanese Government classifies rivers and lakes into A, B, C categories according to the level of water quality for water purification treatment methods in waterworks. Indicators of pH, BOD, suspended solids, DO, and coliform groups are chosen to classify the source water quality. Besides these water quality pa-rameters listed in the environmental quality standards, THM for-mation potential, and NH3-N are of special concern regarding
source water protection共Sato 2002兲.
In addition to the above-noted information, the promulgated criteria/standards for different countries were summarized in Table 1 as baseline information for determining standards in Tai-wan.
2. Current and future drinking water quality standards. The
concept of human health risk assessment should be introduced to amend drinking water quality standards in Taiwan, especially for the DBPs and heavy metals. The purpose of regulating source water quality is to produce finished water from traditional coagulation-precipitation water treatment processes to meet exist-ing drinkexist-ing water standards. Future drinkexist-ing water standards must also be considered while setting source water quality stan-dards.
3. Background information on source water quality. Every
country establishes its own water quality standards based on spe-cial domestic needs and characteristics. Recently, the Taiwan EPA has conducted a long-term, integrated and comprehensive project to establish the national drinking water quality standards. A full analysis of relevant background information on water sources and treated water is the key factor leading to a better understanding of how well actual water quality has lived up to the established standards.
It is noted that excessively stringent source water quality stan-dards may not be practical and will certainly increase water treat-ment costs. Thus, less stringent source water quality standards comparable to the existing water quality may be adopted initially and tightened gradually in phases to avoid sudden impacts to the water supply industry as well as consumers. Mechanisms for this should be established, such as specific statutory deadlines, water rate design, and cost allocation to upgrade the performance and capacity for water treatment plant.
Fig. 1.Procedures to develop the source water quality standards in Taiwan
4. Performance evaluation of existing water treatment plants.
Prior to determining source water quality standards, it is neces-sary to evaluate the treatment capacity of existing water plants in treating raw water at predetermined water quality standards and in meeting drinking water quality standards. An unreasonable stan-dard may result in excessive treatment costs for water treatment plants. Most water purification facilities in Taiwan still rely on traditional methods, i.e., coagulation, sedimentation, filtration, and chlorination. The efficiency of these methods for achieving the target water quality parameters should be taken into consider-ation when establishing interim standards.
5. Cost-effectiveness analysis. Chemical and microbial water
quality criteria, supplemented with a limited number of biological
water quality criteria, are the principal indicators of water quality used in the developed nations at this time. However, the imple-mentation of more integrated and comprehensive indicators of environmental health and biological diversity need great efforts to be developed.
Before adopting standards, it is recommended that the cost-effectiveness analysis be conducted to evaluate if the new stan-dards or criteria will cause compliance difficulties. If poor source water quality affects the operating performance of water treatment processes, the water supply company should define performance goals for each water treatment process.
In summary, to protect public health, pathogens and toxic sub-stances including arsenic, lead, chromium, mercury, cadmium, Table 1.Comparison of Source Water Quality Criteria/Standards in Various Nations
Parameter units USEPAa
Alberta Canada
EC
共A1兲 Japan Australia
Germany 共Rhine River兲 Taiwan Current Future I. Microorganisms Total coliforms 共CFU/100 mL兲 20,000 5,000 — 5,000 ⬍10 — 20,000 10,000 Fecal coliforms 共CFU/100 mL兲 2,000 1,000 — — ND — — —
II. Physical parameters
Color共CU兲 — 艋30 20 10 15 0.5 — — pH 5.0–9.0 6.5–8.5 — 6.5–8.5 6.5–8.5 6.5–8.5 — — III. Inorganics As共g/L兲 10 10 50 10 1 5 50 50 Ba共g/L兲 1,000 1,000 50 — 1 700 — — Cr共g/L兲 — 20 50 50 0.01 25 50 50 Cd共g/L兲 — 10 5 10 0.06 3 10 5 Hg共g/L兲 — 0.1 1 0.5 0.06 0.5 2 1 Pb共g/L兲 — 50 50 10 1.0 5 50 50 Se共g/L兲 170 10 10 10 5 5 50 10 Ag共g/L兲 — 50 — — 0.02 — — — Cu共g/L兲 1,300 20 50 1,000 1.0 — — — Fe共g/L兲 300 300 300 300 — — — — Mn共g/L兲 50 50 — 20 1,200 — — — Zn共g/L兲 7,400 50 3,000 1,000 2.4 — — — NH3- N共mg/L兲 — 1共TKN兲 — 0.5 0.32 0.3 1 — Cl−共mg/L兲 — 1.5 — 200 0.0004 100 — — CN−共g/L兲 700 15 50 10 0.004 25 — — NO3−共mg/L兲 10 — 50 9 0.00017 — — — SO42−共mg/L兲 — 0.05共S2−兲 250 — 0.0005 100 — — IV. Organics Surfactants共MBAS兲 共g/L兲 — — — 500 — — — — Phenol共g/L兲 21,000 5 1 5 85 — — — Total pesticides 共g/L兲 — — 0.2 — — 50 — — COD共mg/L兲 — — — 3 共KMnO4兲 — — 25 共K2Cr2O7兲 20 PCBc共g/L兲 0.00064 — — NDb — — — — PAHsd共g/L兲 — — 0.2 — — 0.1 — — TOC共mg/L兲 — — — — — 3共DOC兲 4 2
Note: TOC⫽total organic carbon. a
U.S. Environmental Protection Agency共USEPA兲 national recommended water quality criteria: 2002, for consumption of “water+organism.” bNot detectable.
cPolychlorinated biphenyls. d
and selenium should be regulated. In setting source water quality standards for these toxic substances, it must be noted that conven-tional water treatment plants may not effectively remove these substances. Therefore, the source water quality standards for these substances should be set as equal to the drinking water standards. However, it is recommended that the source water standards be compared with those from other countries to reduce the health risk in existing source water quality in Taiwan before being final-ized. Other regulatory parameters including coliform bacteria, ammonia, COD, and TOC should be based mainly on existing source water quality.
Development of Microbial Indicators in Source Water Quality Standards
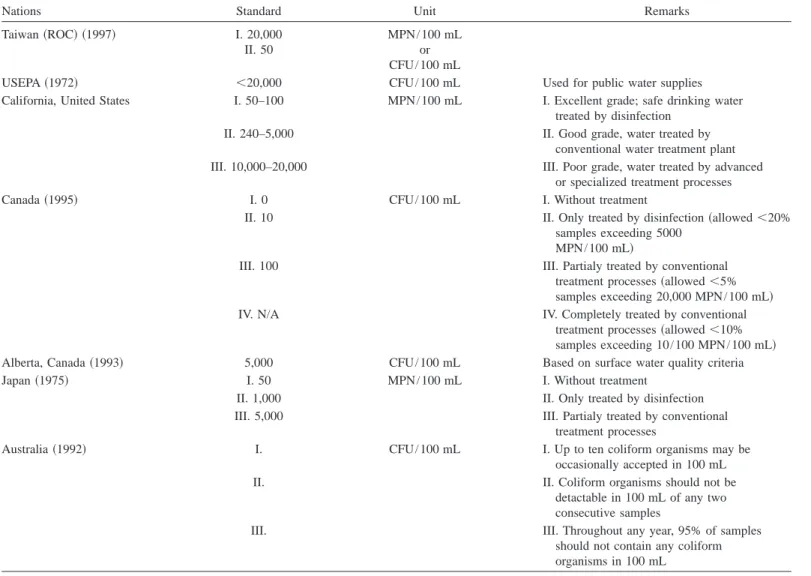
In general, low counts of fecal coliforms and E. Coli are indica-tive of safe waters but not always. Table 2 evaluates the microbial indicators in source water criteria/guidelines for the developed nations from the aspects of regulation, occurrence, and health effect. It is suggested in this paper that total coliforms, despite its low correlation with health effect should be a representative pa-rameter due to its unique characteristics in conjunction with the source water management regulations, and effective assessment in disinfection efficiency.
The Taiwanese source water standards require that total coliforms cannot exceed 20,000 CFU/ 100 mL for plants with tra-ditional facilities and 50 CFU/ 100 mL for plants with only disin-fection treatment. The total coliform standards adopted by Cali-fornia共United States兲, Canada, and Japan are divided into several categories according to the selected treatment processes共Table 3兲. They regulate that high total coliform levels require more
ad-vanced treatment processes to meet the drinking water standards at the point of service.
The concentration profiles of total coliform in source water published by the Taiwan Water Company for the periods of 1995– 1996 and 1997–1998 are shown in Fig. 2. Total coliform concen-trations in source water greater than 20,000 CFU/ 100 mL were 9 and 8% of the total samples in 1995–1996 and 1997–1998, re-spectively. Total coliform concentrations in source water greater than 10,000 CFU/ 100 mL were about 15% of the total samples for both periods. There was a slightly decreasing trend of the average concentration of total coliforms which suggests that there is an improvement in the source water quality.
Acceptable disinfection efficiency was set at 99.99% inactiva-tion of the total coliform count 共the average level of total
coliforms measured in source water is about
30,000 CFU/ 100 mL兲, which would also meet the Taiwan EPA drinking water standard 共6 CFU/100 mL兲. All water treatment plants with total coliform violations in source water standards are equipped with pre-chlorination facilities. Since excessive chlorine residual and disinfection by-products have not been found in the finished water, most of the plants can meet the current drinking water standards. However, the slow improvement in source water protection makes it unlikely that source water standards will be met by some of the water treatment plants in the near future. As a result, it suggests that a source water total coliform standard of 10,000 CFU/ 100 mL be adopted in 2006 and be enforced to 5,000 CFU/ 100 mL in 2007. The following items should also be addressed in the source water quality regulations: the growing concern of the presence of DBPs in the finished water, as well as disinfection efficiency measured by C⫻T 共chlorine dose-contact time兲 values.
It is noted that on the aspect of pathogen, there is a current Table 2.Evaluation of Microbial Indicators in Water Quality Criteria/Guidelines for the Developed Nations
Micro-biological contaminants Drinking water management regulation Source water management regulation Occurrence in source water Health effect Disinfection efficiency Total coliforms United States, Japan, England,
Canada共Alberta兲, Germany
United States, United States 共California兲, Canada 共Alberta兲, Japan, Australia
High Low High
Fecal coliforms Unites States, EC, Australia United States, Canada共Alberta兲, Australia
Medium Medium High
E Coli Unites States, WHO, Germany, EC, Australia,
England, Canada共Alberta兲, New Zealand,Holland
Canada共Alberta兲, France Low High High
Fecal streptococci
Germany, EC France Medium Medium High
Enteroccoci EC, England, Holland Canada共Alberta兲 Low Medium Medium
Pseudomonas aeruginosa
— Canada共Alberta兲 Low Low Low
Cryptosporidium United States, Holland — Low High High
Giardia lambia United States, Holland — Low High High
Cyanobacteria New Zealand — Low High High
Pathogenic bacteria New Zealand — Low High Medium
Protozoa共pathogenic兲 New Zealand — Low High Medium
Helminths共pathogenic兲 New Zealand — Low High Medium
Algae New Zealand — High Medium Low
Virus New Zealand, United States
共enteric virus兲, Holland
— Low High Low
search for a good measure or indicator for Giardia and
Cryptosporidium. There is also a desire to find better indicators of
human wastewater influence, such as caffeine and coprostanol 共Tien 2002兲. There are developing tools in the field of genetics, for instance, DNA tracking is allowing us to identify the actual source of fecal contamination 共e.g., humans, birds, dogs兲
How-ever, these newly developing microbial indicators need more data base to assess its potency for drinking water supplies共Tien 2002兲.
Development of Organic Indicators in Source Water Quality Standards
UV absorption, a useful surrogate measurement of selected or-ganic constituents in fresh water共Wilson 1959; Dobbs et al. 1972; Copper and Young 1984兲, may exhibit strong correlation with organic carbon content, color, and precursors of DBPs共Edzwald et al. 1985兲. The COD is used as a measurement of the oxygen equivalent of the organic matter content in water that is suscep-tible to oxidation by a strong chemical oxidant. TOC is a more convenient and direct expression of total organic content and can be used to evaluate the effects of DBP control strategies. Singer et al.共1995兲 suggested that chlorine consumption was a reasonably good indicator of DBP formation.
In a previous study, Chang et al.共1998兲 found that COD had strong correlation with UV254共or humid substance兲 and chlorine
demand in different source water samples with different charac-teristics. Table 4 evaluates the organic indicators utilized in the source water which suggests that COD and TOC should be re-garded as surrogate parameters for source water quality analyses and precursors of DBP concerns.
Table 3.Source Water Quality Standards for Total Coliforms in Various Nations
Nations Standard Unit Remarks
Taiwan共ROC兲 共1997兲 I. 20,000
II. 50
MPN/ 100 mL or CFU/ 100 mL
USEPA共1972兲 ⬍20,000 CFU/ 100 mL Used for public water supplies
California, United States I. 50–100 MPN/ 100 mL I. Excellent grade; safe drinking water treated by disinfection
II. 240–5,000 II. Good grade, water treated by
conventional water treatment plant III. 10,000–20,000 III. Poor grade, water treated by advanced
or specialized treatment processes
Canada共1995兲 I. 0 CFU/ 100 mL I. Without treatment
II. 10 II. Only treated by disinfection共allowed ⬍20%
samples exceeding 5000 MPN/ 100 mL兲
III. 100 III. Partialy treated by conventional
treatment processes共allowed ⬍5% samples exceeding 20,000 MPN/ 100 mL兲
IV. N/A IV. Completely treated by conventional
treatment processes共allowed ⬍10% samples exceeding 10/ 100 MPN/ 100 mL兲
Alberta, Canada共1993兲 5,000 CFU/ 100 mL Based on surface water quality criteria
Japan共1975兲 I. 50 MPN/ 100 mL I. Without treatment
II. 1,000 II. Only treated by disinfection
III. 5,000 III. Partialy treated by conventional
treatment processes
Australia共1992兲 I. CFU/ 100 mL I. Up to ten coliform organisms may be
occasionally accepted in 100 mL
II. II. Coliform organisms should not be
detactable in 100 mL of any two consecutive samples
III. III. Throughout any year, 95% of samples
should not contain any coliform organisms in 100 mL
Fig. 2.The concentration profiles of total coliforms in source water utilized by the Taiwan Water Company during 1995–1996 and 1997– 1998.
Total Organic Carbon
Around the world, Germany is the only country that regulates dissolved organic carbon共DOC兲 in the source water. Germany set a limit of 3 mg/ L DOC for the Rhine River cleanup project. To protect the public health, the Information Collection Rules共ICR兲 of the USEPA suggests that a public water system serving more than 100,000 persons must monitor DBPs in the finished water and TOC in the source water. The ICR also requires batch tests for DBP precursors as well as pilot plant tests. However, water suppliers can be exempted from this requirement if the quarterly average of THMs is less than 40g/L and HAAs is less than 30g/L or the yearly average of TOC is less than 4 mg/L in the influent. Besides, THM/HAA must be no greater than 40/ 30g/L under Stage 2 of the USEPA D/DBP Rule 共to be enforced after 2004兲.
From 1994–2000, the Taiwan EPA supported a research project which involved evaluation of the source water quality in Taiwanese water treatment plants 共Table 5兲. The results of this investigation indicated that 25% of the samples had a TOC greater than 2 mg/ L 共n=46兲. Also, 13% of the samples had a
TOC greater than 3 mg/ L. Based on the average TOC value of each water plant, there were 6 water plants with an average TOC greater than 2 mg/ L and 3 plants with TOC greater than 3 mg/ L. It is also noted that of the 12 samples with a TOC concentration in source water less than 2 mg/ L, only 1 had a total THM con-centration greater than 40g/L. This implies that if the TOC standard is set at 2 mg/ L, it will significantly decrease the DBP concentrations in the finished water. The water authority is urged to adopt this TOC standard to achieve the goal of minimizing the formation of DBPs in the finished water. This proposal is very consistent with previous research findings 共Chiang et al. 1997兲 presented in Fig. 3, which indicates that the formation of THMs increases with TOC. For instance, at a contact time of 40 min, and TOC= 4 mg/ L, the concentration of THMs is approximately double that formed when TOC= 3 mg/ L at the same contact time. Therefore, the TOC concentration prior to the application of dis-infectant should be kept under 3 mg/ L to meet the more stringent THM standard of 60g/L.
According to the above-mentioned data, TOC in some Taiwan-ese source water is low. A standard of 3 mg/ L TOC should not greatly affect compliance and we therefore recommend that this be enforced in 2005. In 2007, the standard should be reduced to 2 mg/ L. To enforce the source water TOC standard, the regula-Table 4.Evaluation of Organic Indicators in Source Water Quality Analyses
Factors to be considered COD 共mg/L兲 TOC 共mg/L兲 Cl2demand 共mg/L兲 UV254 Humic substances Background information International availability ⫹⫹⫹ ⫹⫹⫹⫹ ⫹ ⫹⫹⫹ ⫹⫹ National availability ⫹⫹⫹ ⫹⫹⫹ ⫹ ⫹⫹ ⫹ Representative ⫹⫹⫹ ⫹⫹⫹ ⫹⫹ ⫹⫹ ⫹⫹⫹⫹
Water treatment technology
Monitoring parameters ⫹ ⫹⫹⫹⫹ ⫹⫹ ⫹⫹ ⫹ Analytical technique Precision/Accuracy ⫹⫹⫹ ⫹⫹⫹ ⫹ ⫹⫹⫹⫹ ⫹⫹ Time consumption ⫹⫹ ⫹⫹⫹ ⫹⫹ ⫹⫹⫹⫹ ⫹ Equipment/Apparatus cost ⫹⫹⫹ ⫹ ⫹⫹⫹⫹ ⫹⫹ ⫹ Ease of operation ⫹⫹ ⫹⫹⫹ ⫹ ⫹⫹⫹⫹ ⫹ Related to DBPs formation ⫹ ⫹⫹⫹ ⫹ ⫹⫹⫹ ⫹⫹⫹⫹
Note: COD⫽chemical oxygen demand; and TOC⫽total organic carbon. The “⫹” symbol denotes the advantages of the parameter with the corresponding event. The potency of the advantage increases as the number of “⫹” increases.
Table 5.Analyses of Total Organic Carbon in Source Water at Various Water Treatment Plants
Water treatment plant code Average 共mg/L兲 Range 共mg/L兲 Sample size A 1.4 0.59–2.73 45 B 0.8 1.47–1.35 25 C 2.6 1.42–7.20 23 D 1.1 0.63–3.16 9 E 0.3 0.24–0.32 4 F 1.0 0.44–1.90 19 G 2.2 0.95–8.03 13 H 1.6 0.81–3.41 10 I 0.6 0.29–1.15 7 J 1.5 0.68–3.40 5 K 2.3 1.16–5.04 6 L 1.8 1.50–2.20 5 M 4.9 3.82–6.57 5 N 10.2 7.03–14.41 5 O 9.9 8.99–11.54 4
Fig. 3. Effects of total organic carbon 兲 concentration on THM formation at applied chlorine dose= 2.0 mg/ L for various levels of contact time
tory agency can follow the requirements stipulated by the USEPA ICR, i.e., THM/HAA must meet 40/ 30g/L when TOC exceeds the standard. Otherwise, a source water improvement plan of quality must be implemented.
Chemical Oxygen Demand
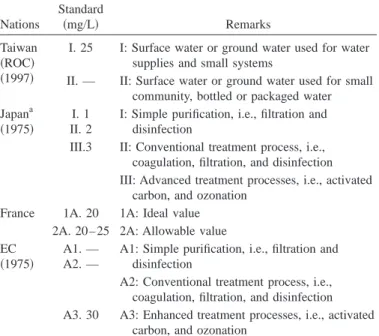
In reviewing the source water COD standard adopted by various countries, it was found that France adopted an ideal standard of 20 mg/ L and allowable value of 20– 25 mg/ L 共Table 6兲. EC as-signed a COD guideline value of 30 mg/ L for enhanced treat-ment process 共EC 1975兲. Japanese COD standards range from 1 to 3 mg/ L, using KMnO4 as an oxidation agent 共Kikuchi
1975兲. In 1998, the Taiwanese Water Company reported that six water treatment plants violated the source water COD standard.
According to the 1997–1998 Background Surface Source Water Quality Report submitted by the Taiwan Water Company for 40 water treatment plants, there was a 5% chance共2 out of 40 plants兲 that the average COD in source water exceeded 15 mg/L 共Fig. 4兲. By reviewing the maximum COD values submitted, there was a 27% chance 共11 out of 40 plants兲 that COD was greater than 15 mg/ L and a 7% chance 共3 out of 40 plants兲 that COD was greater than 20 mg/ L. Compared with the existing COD standard共25 mg/L兲 for source water, the background COD concentration in source water was relatively low. It implies that the existing 共25 mg/L兲 COD standard is too lenient to protect source water quality. After reviewing source water samples 共n=32兲 taken from seven water treatment plants for this investi-gation, it was found that 8 samples had COD between 15 and 25 mg/ L, and 63% of these 8 samples had total THM greater than 40g/L. Among the 19 samples with COD less than 15 mg/L, there is a 32% chance that THM is greater than 40g/L. These statistical data suggest that a source water COD standard of 15 mg/ L would minimize the risk of producing DBPs. The exist-ing source water quality should not have much difficulty in meet-ing the COD standard of 15 mg/ L. Consequently, it is recom-mended that a COD standard of 20 mg/ L be adopted in 2006 共similar to France 1A COD standard兲 and reduced to 15 mg/L in 2007.
On the other hand, several technical advisory meetings were conducted to solicit input from experts regarding source water standards in Taiwan. It also suggests that Taiwan source water quality should be revised in phases according to the proposed total coliforms, TOC, and COD standards because there are tech-nical problems associated with the enforcement of these standards at the present time. That is, a uniform single standard should be adopted in Phase I which can be divided into two stages as shown in Table 7 and additional regulated parameters will be amended in Phase II after objectives of source water protection in Phase I are accomplished.
Implementation Plans
The water treatment plant with unacceptable source water quality needs to improve its source water quality and establish the imple-Table 6.Source Water Quality Standards for Chemical Oxygen Demand
共mg/L兲 in Various Nations Nations Standard 共mg/L兲 Remarks Taiwan 共ROC兲 共1997兲
I. 25 I: Surface water or ground water used for water supplies and small systems
II. — II: Surface water or ground water used for small community, bottled or packaged water Japana
共1975兲
I. 1 II. 2
I: Simple purification, i.e., filtration and disinfection
III.3 II: Conventional treatment process, i.e., coagulation, filtration, and disinfection III: Advanced treatment processes, i.e., activated
carbon, and ozonation France 1A. 20 1A: Ideal value
2A. 20– 25 2A: Allowable value EC
共1975兲
A1. — A2. —
A1: Simple purification, i.e., filtration and disinfection
A2: Conventional treatment process, i.e., coagulation, filtration, and disinfection A3. 30 A3: Enhanced treatment processes, i.e., activated
carbon, and ozonation a
Determined by using KMnO4as an oxidized agent.
Table 7.Revised Source Water Quality Standards for Total Coliforms, total organic carbon共TOC兲, chemical oxygen demand 共COD兲 in Taiwan 共ROC兲
Fig. 4. The concentration profiles of chemical oxygen demand in source water utilized by the Taiwan Water Company during 1995– 1996 and 1997–1998
mentation plan based on the results of CPE. The evaluation ap-proach of CPE uses a rating system to classify each major treat-ment process as Type 1, Type 2, or Type 3. The methodology to determine whether a unit process is classified as which type is based on the results of the measured capability and the instanta-neous operating flow rate for a specific unit process. A unit pro-cess would be rated Type 1 if its operated capability exceeds the peak instantaneous operating flow rate; Type 2 if its measured capability is 80–100% of the peak flow; or Type 3 if its projected capability is less than 80% of the peak flow. The performance problems associated with Type 1 plants are likely related to plant operation, maintenance, and/or administration which can be im-proved by technical assistance. However, the Type 2 plants need to provide the minor corrections for process improvement to meet the performance goal. For Type 3 facilities, major modifications are required to achieve the objectives of performance. After CPE evaluation, comprehensive technical assistance 共CTA兲 is pro-cessed for facilities improvement in water treatment plant. The initial step in assessment of CTA applicability is to determine if improved performance is achievable by evaluating the capability of major unit processes. A CTA is typically recommended if unit processes are deficient in capability共e.g., Type 3兲, acceptable per-formance from each “barrier” may not be achievable; and the focus of follow-up efforts may have to include construction alter-natives. Another important consideration with Type 3 facilities is the immediate need for public health protection regardless of the condition of the plant.
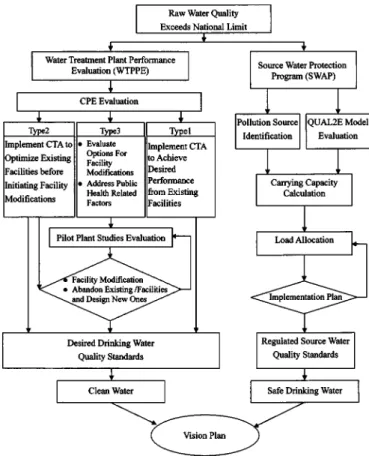
A case study of the Chen-Chin-Lake water treatment plant located in the Kaoping watershed was performed to demonstrate how the CPE technique can successfully establish the appropriate Type 3 implementation plans. The flow chart of standard opera-tional procedures for reviewing a performance of water treatment plant whose source water quality exceeds the national limit is shown in Fig. 5. To enhance drinking water quality in Kaohsiung metro, both the appropriate sound source water protection pro-gram and innovative water purification facilities are to be imple-mented as follows.
1. Source water protection program. Kaopin River, which
sup-plies around 650,000 cubic meters daily for 2,370,000 residents within Kaoshiung metro areas, is polluted by livestock wastewa-ter from hog farms, domestic sewage, industrial wastewawastewa-ter, land-fill leachout, and non-point source共NPS兲 pollutants from agricul-ture areas, accounting for 52.5, 11.2, 28.8, 2.2, and 5.3% with total of 23,187 kg of BOD per day, respectively共Lin et al. 2002兲. The average source water quality data are shown in Table 8. The major water treatment plant in this area is the Chen-Chin-Lake water treatment plant. Although the average NH3-N levels shown
in Table 8 are under 1 mg/ L, several unacceptable observations have been found. Besides, the unpleasant taste and odor of tap water caused by the high organic matter and ammonia nitrogen in source water are the major issues always complained about by the local residents.
Enhanced Stream Water Quality Model共QUAL2E兲 developed by the US EPA was selected as a water quality-planning tool to assess the water quality based on its carrying capacity. It can simulate up to 15 water quality constituents including BOD, nu-trients, DO, temp, algae as chlorophyll A, and total coliforms. QUAL2E can operate as a steady-state model which can be used to estimate the impact of waste loads 共magnitude, quality, and location兲 on stream water quality. The constants used in the QUAL2E model were obtained from our previous study共Chiang et al. 2001兲.
The estimated carrying capacities of BOD, NH3-N, and TP are
27,700, 4,200, and 600 kg per day. Daily total coliforms carrying capacity is found to be 4.8⫻1015CFU. The current BOD, NH
3
-N, TP, and total coliform loadings are about 2.7, 9.4, 8.5, and 7.3 times higher than the calculated carrying capacities, respectively. To protect public health and improve the river water quality, the river pollution control management plans are proposed as fol-lows: 共a兲 hog ban in the whole Kaoping River basin; 共b兲 sewer system construction to achieve 30% of population served area within 10 years; 共c兲 removal of 10 riverbank landfills; and 共d兲
Table 8. Average Water Quality Data of the Chen-Chin-Lake Water Treatment Plant from 2000 to 2003
Water quality parameters Source water Finish water Turbidity共NTU兲 18.1共±13.2兲 0.42共±0.15兲 Bicarbonate共mg/L兲 157共±24兲 140共±27兲 NH3-N共mg/L兲 0.21共±0.18兲 0.06共±0.01兲 TDS共mg/L兲 334共±64兲 334共±64兲 Total hardness共mg/L兲 223共±40兲 222共±42兲 Conductivity共mmho/cm兲 476共±94兲 476共±116兲 Chloride共mg/L兲 9.4共±4.9兲 14.1共±6.9兲 Nitrate共mg/L兲 1.08共±0.35兲 1.01共±0.31兲 Fluoride共mg/L兲 0.15共±0.04兲 0.15共±0.05兲 Sulfate共mg/L兲 81.5共±17.1兲 96.6共±16.5兲 TOC共mg/L兲 9.4共±4兲 — COD共mg/L兲 2.5共±1兲 —
Total coliforms共CFU/100 mL兲 2.7⫻103共±1.0⫻103兲 ⬍1 Total counts共CFU/100 mL兲 2.0⫻104共±4.0⫻104兲 2共±8兲 Note: TOC⫽total organic carbon; and COD⫽chemical oxygen demand. Fig. 5. Standard operational procedures for reviewing and/or approving a water treatment plant whose source water quality exceeds the national limit
Table 9.Simulated Loading after the Implementation of each Proposed Plan
Scenario Measure
Reduced loading Remaining loading
BOD 共kg/day兲 NH3-N 共kg/day兲 TP 共kg/day兲 Total coliforms 共CFU/day兲 BOD 共kg/day兲 NH3-N 共kg/day兲 TP 共kg/day兲 Total coliforms 共CFU/day兲 1 Hog ban in the upper catchment to
reduce 1 / 2 hogs
6,000 1,800 500 1.40E + 15 68,700 37,600 4,600 3.40E + 16 2 Hog ban in the whole basin 37,800 17,300 2,800 1.57E + 16 36,900 22,100 2,300 1.97E + 16 3 Construction of sewer system
共20% of connection in 10 years兲
3,900 50 — 6.70E + 15 70,800 39,350 — 2.87E + 16
4 Sewer system construction 共30% of connection in 10 years兲
5,900 100 — 7.90E + 15 68,800 39,300 — 2.75E + 16
5 Removal of riverbank landfills 2,800 800 80 — 71,900 38,600 5,020 —
6 Reduction of industrial wastewater discharge 1,500 — — — 73,200 — — — 7 Scenarios 2 + 4 + 5 + 6 48,000 18,200 3,600 2.36E + 16 26,700 ⬍27,700 共carrying capacity兲 21,200 ⬎4,200 共carrying capacity兲 1,500 ⬎600 共carrying capacity兲 1.18E + 16 ⬎4.81E+15 共carrying capacity兲
Table 10.Comparisons of Finish Water Quality for Different Processes at the Pilot Plant in the Chen-Chin-Lake Water Treatment Plant
Water quality parameters Source water
Processa共I兲 O→C→S→F→O→G Processa共II兲 O→C→S→F→P→O→G Processa共III兲 O→C→S→F→O→G→N Finish water Turbidity共NTU兲 NAb 0.20 0.07 0.03 NPDOC共mg/L兲 1.10 0.90 0.29 0.17
AOC共g acetate-C eq/L兲 NA 25 13 4
Total Hardness共mg/L兲 238 230 109 18
TTHM共g/L兲 NA 8.4 0.7 0.3
TTHMFP共g/L兲 79.1 31.4 NAb NAb
aC = coagulation basin; S = sedimentation tank; F = rapid filtration basin; G = GAC column; O = ozonation reactor; P = pellet softening bed; N = nanofiltration.
b
Not available.
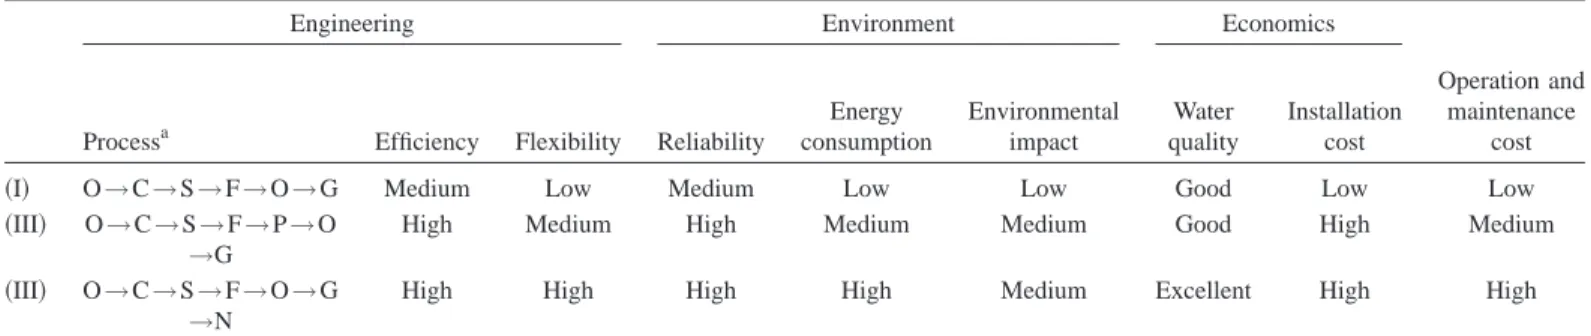
Table 11.Overall Performance Evaluation of the Selected Processes from the Aspect of Engineering, Environment, and Economy
Engineering Environment Economics
Processa Efficiency Flexibility Reliability
Energy consumption Environmental impact Water quality Installation cost Operation and maintenance cost
共I兲 O→C→S→F→O→G Medium Low Medium Low Low Good Low Low
共III兲 O→C→S→F→P→O
→G
High Medium High Medium Medium Good High Medium
共III兲 O→C→S→F→O→G
→N
High High High High Medium Excellent High High
aC = Coagulation basin; S = Sedimentation tank; F = Rapid filtration basin; G = GAC column; O = Ozonation reactor; P = Pellet softening bed; N = Nanofiltration.
reduction of the industrial wastewater discharge. Reduced and/or remaining pollutants loading after the implementation of each proposed plan are shown in Table 9. With these implementation plans, it is expected that approximately 48,000 kg of daily BOD loading can be reduced, and the remaining BOD loading 共26,700 mg/day兲 is lower than the 27,700 mg per day BOD car-rying capacity. However, NH3-N, TP, and total coliforms loads
are still far beyond the calculated carrying capacities.
2. Water treatment plant performance evaluation. Since the
source water quality cannot be upgraded within a limited time, the CPE technique was also performed to evaluate the performance of the existing facilities in the Chen-Chin-Lake water treatment plant. After the on-site visit, it was observed that performances of the flotation and the coagulation-sedimentation tanks are poor and floc-forming condition is not satisfactory. Additionally, high level of NH3-N has led to the overdose of pre-chlorination. In order to
overcome these problems, pilot plant studies on process modifi-cation of the Chen-Chin-Lake water treatment plant were per-formed. Tables 10 and 11 present the overall performance evalu-ation of the selected processes from the aspect of finish water quality, engineering, environment and economy.
Among the three test processes of the pilot plants, process共III兲 exhibits the best performance in terms of high efficiency, flexibil-ity, reliabilflexibil-ity, and excellent water quality. Therefore, the plan to introduce advanced water treatment processes in Chen-Chin-Lake water treatment plant was chosen as process共III兲, i.e., preozona-tion, coagulapreozona-tion, sedimentapreozona-tion, filtrapreozona-tion, postozonapreozona-tion, GAC column, and nanofiltration. With these suggested treatment
pro-cesses, it is expected: 共a兲 to reduce the hardness from
240 to 150 mg/ L; 共b兲 to replace pre-chlorination and post-chlorination with ozonation;共c兲 to remove taste and odor by bio-logical activated carbon filtration process. After completing the upgrading project, the water can meet the drinking water quality standard.
Conclusions and Recommendations
Source water quality criteria and standards from Taiwan and other countries were reviewed in this investigation. Chemical and bac-terial water quality criteria, supplemented with a limited number of biological water quality criteria, are the principal indicators of water quality to be established by the developed nations. But, these comprehensive water quality indicators are not yet used and implemented regularly. This study suggests that Taiwan source water quality standards for total coliforms, TOC, and COD be revised in the future.
To achieve the long-term goal of improving water quality, it is recommended that stricter water quality standards in Taiwan be enforced gradually and divided into two execution phases. A uni-form single standard should be adopted in Phase I, which can also be divided into two stages as shown in Table 7. The regulated parameters should include representative parameters such as toxic substances, chemical and biological water quality indicators. The water treatment plant with an unacceptable source water quality needs to propose a source water protection program and/or seek on alternative source. Meanwhile, the CPE method is also intro-duced to find out the performance limiting factors and make im-provement and modification of the existing facilities in the water treatment plant.
After Phase I objectives of source water protection are accom-plished, various source water quality standards can be established and executed. In Phase II, additional regulated parameters will be
added. Minimum treatment processes required for various source water quality will be defined. Applicable water pollution regula-tions for abating source water contamination will be enforced. All these activities should result in a much improved drinking water quality.
Acknowledgments
This research is supported by grants from the Toxic Material Management Bureau and Water Protection Bureau of Taiwan EPA. Special thanks are extended to experts from the Taiwan water supply industry and professors from various universities for their valuable input.
References
ANZECC. 共2000兲. “Australian and New Zealand Guidelines for Fresh and Marine Waters, National Water Quality 2000.” National Water Quality Management Strategy Paper No. 4, Australian and New Zealand Environment and Conservation Council.
Chang, E. E., Chiang, P. C., Chao, S. H., and Chuang, C. L. 共1999兲. “Development and implementation of source water quality standards in Taiwan, ROC.” Chemosphere, 39共8兲, 1317–1332.
Chang, E. E., Chiang, P. C., and Lin, T. F. 共1998兲. “Development of surrogate organic contaminants parameters source water quality stan-dards in Taiwan, ROC.” Chemosphere, 37, 593–606.
Chiang, P. C., Chang, E. E., Ko, Y. W., and Lou, J. C.共1997兲. “Balancing disinfection efficiency and THM formation during chlorination: The-oretical considerations.” Can. J. Chem. Eng., 75, 892–898. Chiang, P. C., Kao, C. M., Huang, S. S., Lin, T. F., Yan, Y. L., and Chang,
E. E.共2001兲. “Water quality management in the Kaoping river basin, Taiwan.” WEF Conference, JWEF, July 27–28, Tokyo.
Code of Maryland Regulation, Title 26, Dept. of the Environment, Sub-title 08 Water Pollution, Chapter 2—Water Quality.
Copper, A. L., and Young, J. C.共1984兲. Chemical non-specific organic analysis, Vol. 3, Academic, New York.
Dobbs, R. A., Wise, R. H., and Dean, R. B.共1972兲. “The use of ultravio-let absorbance for monitoring the total organic carbon of water and wastewater.” Water Res., 6, 1173–1180.
EC.共1975兲. “Council directives: Concerning the quality required of sur-face water intended for the abstraction of drinking water in the mem-ber states.” 75/440 EEC, Official Journal of the European Communi-ties.
Edzwald, J. K., Becker, W. C., and Wattier, K. L. 共1985兲. “Surrogate parameters for monitoring organic matter and THM precursors.” J. Am. Water Works Assoc., 77, 122–134.
Kikuchi, S.共1975兲. Quality management, Japan’s Water Works Yearbook. Lin, T. H., Liu, H. W., and Yeh, T. Y.共2002兲. “Pollution reduction strat-egies within source water protection zones—Kaopin rover case study.” The 8th Int. Conf. on Drinking Water Quality Management and Treatment Technology, Kaohsiung, Taiwan.
MELP.共1995兲. “Working criteria for water quality—Canada, water qual-ity branch 1995.” Ministry of Environment, Lands and Parks, Envi-ronmental Protection Dept.
NAS. 共1972兲. National Academy of engineering water quality criteria 1972, National Academy of Sciences, Washington, D.C.
Sato, K.共2002兲. “Round table discussion paper.” The 8th Int. Conf. on Drinking Water Quality Management and Treatment Technology, Kaohsiung, Taiwan.
Singer, P. C., Obolensky, A., and Greiner, A.共1995兲. “DBPs in chlori-nated North Carolina drinking waters.” J. Am. Water Works Assoc.,
Tien, C. T.共2002兲. “Round table discussion paper.” The 8th Int. Conf. on Drinking Water Quality Management and Treatment Technology, Kaohsiung, Taiwan.
U.S. Environmental Protection Agency 共USEPA兲. 共1998兲. “Handbook: Optimizing water treatment plant performance using the composite correction program.” 1998 Ed., United States Environmental
Protec-tion Agency, EPA/625/6-91/027, Technical Support Center, Office of Water, Cincinnati.
Van der Leeden, F., Troise, F. L., and Todd, D. K. 共1990兲. The water encyclopedia, 2nd Ed., Lewis, Boca Raton, Fla.
Wilson, A. L.共1959兲. “Determination of fulvic acids in water.” J. Appl. Chem., 9, 501–512.