國
立
交
通
大
學
機械工程學系
博
士
論
文
燃煤發電廠中排煙脫硫之不透光率研究
Study on in-Stack Opacity Following Flue Gas Desulphurization
(FGD) at a Coal-Fired Power Plant
研 究 生:凃文福
指導教授:林振德 教授
燃煤發電廠中排煙脫硫之不透光率研究
Study on in-Stack Opacity Following Flue Gas Desulphurization (FGD)
at a Coal-Fired Power Plant
研究生:凃文福 Student:Wen-Fu Tu 指導教授:林振德 Advisor:Dr. Jenn-Der Lin
國 立 交 通 大 學 機 械 工 程 學 系
博 士 論 文
A Thesis
Submitted to Department of Mechanical Engineering College of Engineering
National Chiao Tung University in partial Fulfillment of the Requirements
for the Degree of Doctor of Philosophy
in
Mechanical Engineering January 2012
Hsinchu, Taiwan, Republic of China
燃煤發電廠中排煙脫硫之不透光率研究
學生:
凃文福 指導教授: 林振德 博士
國立交通大學機械工程學系博士班(熱流組)
中文摘要
燃煤發電廠之排放煙囪內不透光率通常是用來檢測微粒濃度排
放量的方法,它是利用光穿透儀,作為一個連續排放監測系統的一部
分。然而,安裝排煙脫硫裝置,採用濕式洗滌方法後,濕氣會影響不
透光率的測量,水氣產生干擾甚至可能在極低微粒濃度下,不透光率
仍超過
20%法定上限。本文研究以燃煤電廠(發電量 14.3 MW,煙囪
直徑為
2.4 M,高度為 70 M)之排煙溼式脫硫洗滌器對不透光率影響
進行實驗與分析。透過實驗調整鍋爐負荷、靜電集塵器和排煙溼式脫
硫,以確定在不同狀況下不透光率影響因素的變化量之多寡。研究結
果顯示,影響不透光率的兩個重要參數為微粒和水氣消光因子。本文
研究不透光率影響因子乃先定義其獨立的質量消光係數
k
p(微粒)與
k
w(水氣),而利用比爾定律且以非線性迴歸方法計算 k
p和
k
w值的變
化。結果顯示,
kp
從
0.199 到 0.316 m
2/g 和 k
w從
0.000345 到 0.000426
m
2/g,其整體平均估計值 k
p為
0.229 m
2/g、k
w為
0.000397 m
2/g。雖然
k
w小於
k
p3 個數量級,但實驗結果顯示,水氣的消光效應可與微粒的
消光效應相比擬,此乃受溼式脫硫洗滌器大量的水氣所影響。理論消
光係數也使用米氏理論加以計算(光學折射率為 1.5-ni),米氏理論所
求出的消光係數範圍從
0.282 到 0.286 m
2/g,稍大於平均值 0.229 m
2/g
的實驗消光係數值,其差異原因為粉煤飛灰可能已經形成了以球連著
小顆粒或是中空的圓體球形,而非米氏理論的球狀假設。而過去的文
獻研究在測定
k
p值則不考慮水氣的影響以致於高於本文的研究,此乃
排煙濕式脫硫之水氣反射所致。除此之外,本文研究結果顯示微粒吸
收水氣的影響可以忽略不計。
本研究亦使用敏感度分析不透光率經驗式中各項參數改變時最
適切的解及預測某數值有變動時,研究該數值如何變動,以確定不透
光率與獨立變量的定量影響。敏感度分析結果表示,不論是微粒質量
消光係數或是水氣質量消光係數,若質量消光係數值較大,則對不透
明度的影響將隨之變大。最後,根據環保署的微粒物排放限值,我們
建立微粒排放濃度與不透光率相關係式,在考慮水氣與二氧化氮的影
響下,可得到不透光率為
33.8%時仍能符合微粒排放濃度的限制。本
研究中更進一步將水氣、二氧化氮物及氧氣的影響加以校正,在
95
%信賴度區間求得不透光度和微粒濃度的經驗關係式,從而提供不透
光率監測與實際微粒排放濃度的相互關係。
關鍵詞: 排煙脫硫、不透光率、消光係數、米氏理論、敏感度分析.
Study on in-Stack Opacity Following Flue Gas Desulphurization (FGD)
at a Coal-Fired Power Plant
Student: Wen-Fu Tu
Advisor: Dr. Jenn-Der
LinDepartment of Mechanical Engineering
National Chiao Tung University
ABSTRACT
In-stack opacity, which is used as a surrogate for particle concentrations, can typically be measured using in-situ light transmission meters as part of a continuous emission monitoring system (CEMS) for coal-fired power plants. However after installing flue gas desulfurization (FGD) which utilizes a wet scrubbing method, water moisture can affect the measured opacity which may exceed the limitation of 20% even with lower particulate emissions. In this study, numerous experiments are investigated on factors influencing opacity at a 14.3-MW coal-fired power plant with FGD wet scrubbers. The inside diameter of the stack is 2.4 m and the height is 70 m. The factors of in-stack opacity are set with adjusting the boiler load, Electrostatic Precipitator (ESP) and FGD. Experiments are performed to determine variations in opacity for different values of the variables. The results show that two important factors that affect in-stack opacity—light extinction by emitted particles and that by water moisture after a FGD unit—are investigated. The mass light extinction coefficients for particles and water moisture, kp and kw, respectively, were determined
using the Lambert-Beer law of opacity with a nonlinear least-squares regression method. The estimated kp and kw values vary from 0.199 to 0.316 m2/g and 0.000345
to 0.000426 m2/g, respectively, and the overall mean estimated values are 0.229 and 0.000397 m2/g, respectively. Although kw is 3 orders of magnitude smaller than kp,
experimental results show that the effect on light extinction by water moisture was comparable to that by particles because of the existence of a considerable mass of water moisture after a FGD unit. The mass light extinction coefficient was also estimated using Mie theory with measured particle size distributions and a complex refractive index of 1.5-ni for fly ash particles. The kp obtained using Mie theory
ranges from 0.282 to 0.286 m2/g and is slightly greater than the averaged estimated kp
of 0.229 m2/g from measured opacity. The discrepancy may be partly due to a difference in the microstructure of the fly ash from the assumption of solid spheres because the fly ash may have been formed as spheres attached with smaller particles or as hollow spheres that contained solid spheres. Previously reported values of measured kp obtained without considering the effects of water moisture are greater
than that obtained in this study, which is reasonable because it reflects the effect of extinction by water moisture in the flue gas. Additionally, the moisture absorbed by particulate matter, corresponding to the effect of water moisture on the particulates, was clarified and found to be negligible.
Sensitivity analyses using a correlation equation are also conducted to determine the quantitative effect of the independent variables on plume opacity. Results on sensitivity analyses illustrate that at larger value of the mass light extinction coefficients of either particles or water moisture, the influence of the exhaust emission on the opacity becomes larger. Finally, we also discuss the opacity according to the particulate emission limit of Environmental Protection Agency (EPA) in Taiwan. Results indicate that the in-stack opacity could increase to 33.8% but still meet the requirement of EPA limit when water moisture is taken into consideration. Further, in
consideration of water moisture, NOx and oxygen calibration, an empirical correlation between opacity and particulate concentration is given with 95% confidence intervals. The results provide useful information concerning the influence of various factors on in-stack opacity and may be utilized for possible modifications in measurements for monitoring particulate emissions by opacity.
Keywords: flue gas desulfurization、opacity、extinction coefficient、Mie theory、 sensitivity analyses.
誌 謝
自從進入交大機械系博士班就讀後,指導老師林振德教授在這段
博士班期間即給予適切的引導,幫助我不論是在論文研究或工作上都
有清晰的思路。由於老師的教導能讓我以較為嚴謹的邏輯來處理相關
的環節,這樣的思考模式相信對於將來在面對問題與解決問題時會有
很大的幫助。因此,在此特別感謝論文指導老師,雖然老師您榮任虎
尾科技大學校長與交大機械系論文指導老師,相當辛苦與繁忙,但
是,在此段博士班求學期間都給予相當充裕的指導與諄諄教誨,終使
博士論文得以順利完成任務。
同時感謝論文口試召集人傅武雄副教務長以及口試委員蔡春進
教授、林成原教授、吳志陽教授與許隆結副教授對於論文上的指正及
建議。也感謝成大環工所吳義林教授與助教邱慧真對於論文的幫忙與
協助,使得此論文的研究架構能更加的扎實及明瞭。
我非常珍惜在交大機械系博士班期間的日子,謝謝學長陳志堅、
許隆結及學弟賴志銘對於我相關論文的協助與幫忙。特別感謝許隆結
學長花費很多時間幫忙提供論文架構思索與校稿,以及學弟賴志銘提
供相關論文相關資料的參考與應用,使得博士論文能順利完成。也感
謝我目前服務於台灣國際造船公司的上級長官及船裝工場鄭主任與
工程師、領班、班長及現場師傅們給予我在博士班求學時的幫忙,使
我不僅能達成公司給予我單船工程師的職責與任務,也能順利完成博
士學業,在此真的感謝船裝工場的弟兄,謝謝您們。最後,感謝家人
與親戚及拜把兄弟霍萬興的支持與鼓勵,讓我最終能取得交大機械工
程學系的博士學位!
Table of contents
中文摘要
...i
Abstract...iii
誌謝
...vi
Table of contents...viii
List of tables...x
List of figures...xi
Nomenclatures...xiii
Chapter 1 Introduction...1
1.1 Background...1 1.2 Literature survey...11.3 Motivation and objectives...4
1.4 Research Methodology...5
Chapter 2 Optical Properties…...7
2.1 Extinction...7
2.2 Mie scattering theory...8
2.3 Rayleigh scattering theory...10
2.4 Opacity...11
Chapter 3 Experiments...15
3.1 Basic information of the power plant in-stack instruments...15
3.2 Opacity measurement instrument...15
3.3 Main factors influencing opacity…...….15
3.4 Experimental method and procedure…...17
3.5 Flue gas sampling methods and analyses…...19
Chapter 4 Methodology for Estimating Parameters…...……….…26
4.1 Nonlinear least-square method...26
4.2 Sensitivity analysis of parameters...27
4.3 Theoretical calculation of the particle parameter Kp....28
Chapter 5 Results and Discussion……..……....……...30
5.1 Summary of flue gas and characteristics of particles...30
5.2 Experimental data obtained under various operation conditions...31
5.3 Influence of particle and water moisture emission on opacity...31
5.4 Results of sensitivity analysis...36
5.5 Influence of sulfuric acid gas emission on opacity...38
Chapter 6 Opacity Correlation Study………...………...………59
6.1 Correcting oxygen calibration with particle mass emission...59
6.2 Correlation of opacity empirical equation...60
6.3 An empirical opacity correlation ...61
Chapter 7 Conclusions and future work ………....…...65
7.1 Conclusions…...65
7.2 Future work...66
References...68
List of tables
Table 3.1 Basic information on the power plant...21
Table 3.2 Summary of the influencing in-stack opacity...22
Table 3.3 Schematic the CEMS instruments...23
Table 5.1 Summary of flue gas and particle characteristics…...41
Table 5.2 Data obtained by regulating ESP currents for various particle concentrations...42
Table 5.3 Data obtained by adjusting FGD unit's pre-cooling and circulating water rate...43
Table 5.4 Data obtained by varying the operation condition of the boiler load…...…44
Table 5.5 Results of Kp, Kw, kp and kw, estimated from measurements………...….…45
Table 5.6 Calculated values of the theoretical particle parameter Kp for the measured particle size distribution at various absorption indices…...46
Table 5.7 Comparison of measured Kp values with previously reported values from experiments on coal-fired boilers………..………..………...47
Table 5.8 Results of Kp, Kw, KSOx, kp, kw and kSOx, estimated from measurements…...48
List of figures
Figure 2.1 The principle of in-opacity measurement...14 Figure 3.1 Schematic diagram of the coal-fired power plant used in experiments..…24 Figure 3.2 Schematic diagram of the optical block diagram...25 Figure 5.1 Mass and cumulative distributions of emitted particles at various boiler
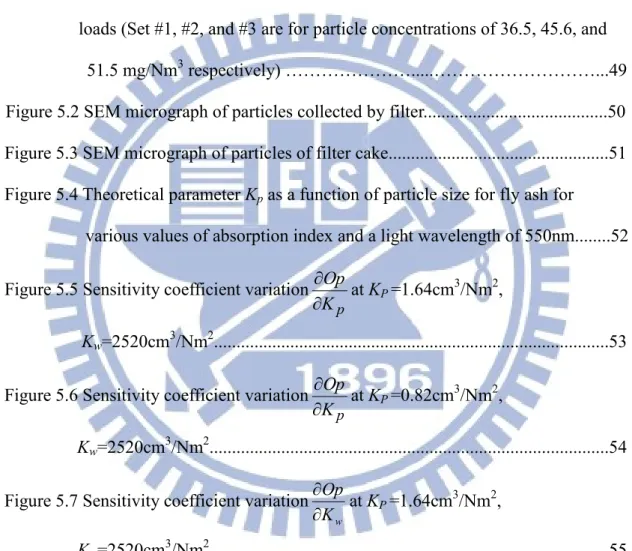
loads (Set #1, #2, and #3 are for particle concentrations of 36.5, 45.6, and 51.5 mg/Nm3 respectively) ………...………...49 Figure 5.2 SEM micrograph of particles collected by filter...50 Figure 5.3 SEM micrograph of particles of filter cake...51 Figure 5.4 Theoretical parameter Kp as a function of particle size for fly ash for
various values of absorption index and a light wavelength of 550nm...52 Figure 5.5 Sensitivity coefficient variation
p K Op at KP =1.64cm3/Nm2, Kw=2520cm3/Nm2...53
Figure 5.6 Sensitivity coefficient variation
p K Op at KP =0.82cm3/Nm2, Kw=2520cm3/Nm2...54
Figure 5.7 Sensitivity coefficient variation
w K Op at KP =1.64cm3/Nm2, Kw=2520cm3/Nm2...55
Figure 5.8 Sensitivity coefficient variation
w K Op at KP =1.64cm3/Nm2, Kw=1260cm3/Nm2...56
Figure 5.9 Sensitivity coefficient variation
p W Op at KP =1.64cm3/Nm2, Kw=2520cm3/Nm2...57
Figure 5.10 Sensitivity coefficient variation w W Op at KP =1.64cm3/Nm2, Kw=2520cm3/Nm2...58
Nomenclatures
Ap : Particle area, [μ m2]
Conc. i(Std. O2) : Pollutant concentration at the O2 level specified in the standard, [%]
Conc. i(Measured O2) : Pollutant concentration measured in the exhaust stack, [%]
Cext : Scattering cross-section, [1/m2]
Cabs: Absorption cross-section, [1/m2]
Csca : Scattering cross-section, [1/m2]
d: particles of diameter, [μ m]
I sca: Intensity of the wave scattered by the angle, [°]
k : mass extinction coefficient, [1/m]
K : Ratio of specific particulate volume to mass extinction coefficient, [cm3/m2] L : Optical path length, [m]
N : Number of moisture droplets per unit volume, [n/m3] Opi,e : Measured opacity, [%]
Opi,c : Estimated opacity, [%]
r : Particle radius, [μ m]
Std. O2% : O2 concentration specified in the standard, [%]
W : Mass concentration, [g/Nm3]
'
p
W : Particle mass concentration at 6% O2, [%]
Xw : Mole fraction of water moisture, [%]
Xwt : Theoretical mole fraction of water vapor with the saturated flue gas, [%]
x : Ratio of the meridional circumference of the sphere to the wavelength of light in the medium, [%]
Y(i ) : Matrix of measured opacity, [%]
: Density of the substance, [g/cm3] λ : Wavelength, [μ m]
Ω : Solid angle, [°] )
(
: Scattering phase function, [ sr-1] : Wave scattering angle, [rad]
Nondimension
a : Experimental samples an : Mie scattering coefficient
b : Initial guess
bn : Mie scattering coefficient
E : Square error
f(r) : Normalized particle number density I : Transmitted intensity
I0 : Incident intensity
Iin: Incident unpolarized beam
i: nondimensional polarized intensities m: Index of refraction
n : Image part of refractive index Q : Efficiency factor
Qe: Extinction efficiency factor
Qs : Scattering efficiency factor
Qa : Absorption efficiency factor
Sy : Standard error
) (
S : Amplitude functions. t : Appropriate student-t distribution X : Sensitivity coefficients
πn :direction-dependent function 1.
τn : direction-dependent function 2.
ψn : Riccati-Bessel function 1.
ξn : Riccati-Bessel function 2.
σ ext: Extinction coefficient
η (β ) : Matrix of estimated opacity
~
: Corresponding set of solutions δ kp: Uncertainty of Kp
δ kw: Uncertainty of Kw
: Imaginary part of complex number
Subscripts i : Contribution of species p: Particles w: Water moisture NO2: NO2 emission SOx: SOx emission 1,2: in medium, or at location, ―1‖ or ―2‖
Chapter 1 Introduction
1.1 Background
The air quality and visibility in an environment are strongly related to the pollutant emissions from industrials in that area. Among industrials, coal-fired furnaces and power plants are major sources of the pollutants. In a coal-fired power plant, in-stack opacity can be typically be measured using in situ light transmission meters as part of a continuous emission monitoring system (CEMS) of the pollutants. Opacity is defined as the percentage of transmitted light that is obscured as it passes through a medium. The obscuration is caused by extinction, which consists of absorption and scattering by constituents in the medium.1, 2 It is a function of particulate concentrations and many other independent optical and physical variables, such as particle size distribution, particle density, refractive index of particles, and nitrogen dioxide and sulfuric acid concentration in the exhaust gas, as examined in previous studies. The extinction of a constituent is usually expressed in terms of mass extinction coefficient (k), 3, 4 the extinction coefficient (k multiplied by concentration), or the ratio of specific particulate volume to mass extinction coefficient (K). 5–9 In a coal-fired power plant, flue gas desulphurization (FGD) unit is often used to reduce sulfuric acid gas emission. However, after setting the FGD unit, water moisture may affect the opacity measurement. The in-stack opacity is significantly affected by the water moisture after FGD with the wet scrubbing method.
1.2 Literature survey
For experiments on a Kraft mill recovery furnace, Bosch5 and Larssen et al.6 utilized a bolometer and a smoke meter, respectively, to compare the theoretical and
measured opacities due to particles. The calculated K values for 18 tests were in the range of 0.80 –1.20 cm3/m2; the variation was due to variations in the size distribution parameters. Thielke and Pilat7 conducted simultaneous measurements of the in-stack opacity, particle mass concentration, and particle size distribution of a hogged-fuel boiler, a Kraft recovery furnace, and a pulverized coal-fired boiler to assess the validity of the particle mass concentration-opacity relationship. The results of their study indicate the importance of using the actual particle size distribution (particle diameter range of 0.2–10μ m) for predicting the relationship between transmittance and mass concentration. Ensor and Pilat8 studied the effects of particle size on opacity using the Lambert-Beer law to determine the parameter K at a coal-fired power plant. Their results showed that K is primarily a function of particle size for particles with radii greater than approximately 0.5μ m and is primarily a function of the refractive index for smaller particles. They also studied the effect of particle size distribution on light transmittance measurements.9 The ratio of the expected extinction coefficient to the theoretical extinction coefficient was reported to be a function of the log-normal size distribution parameters (geometric mass mean radius and geometric standard deviation) for various detector acceptance angles. Cowen et al.10 measured the fly ash light absorption for coal-fired boilers with the integrating plate method. They analyzed the absorption of fly ash samples from four types of coal-fired power plants with various unit ratings and studied the theoretical modeling of smoke plume opacity. By the integrating plate method, which is defined as comparing the light absorption through a clean blank filter to one with a single layer of aerosol, only absorption is measured and the scattering effect is diminished. Steig and Pilat11 performed simultaneous measurements of in-stack light transmittance, particle mass concentration, and particle size distribution at a pulverized coal-fired boiler. The
measured values of K, which ranged from 0.68 to 0.90 cm3/m2, were consistently lower than the theoretically calculated values because of an assumed particle density of 1 g/cm3. Conner and Knapp12 evaluated the particle concentration and light attenuation for coal-fired power plants with electrostatic precipitators (ESPs); the value of K varied from 0.11 to 7.50 cm3/m2. Pilat and Ensor13 measured and calculated the light extinction versus aerosol mass concentration relationship for atmospheric and source emission aerosols. The measured values of K ranged from 0.26 to 0.49 m3/m2 and from 0.06 to 0.78 cm3/m2 for atmospheric aerosol and individual source emission, respectively.
In addition to the effects due to particles, the emissions of sulfur trioxide (SO3)
were a key component of opacity and acid deposition and need to be low enough to not cause opacity violations and acid deposition.14 The emission of SO3 depended on
the sulfur content in coal, combustion conditions, flue gas characteristics, and air pollution devices. Pilat and Wilder15 calculated the effect of the initial water and sulfuric acid (H2SO4) concentrations and final gas temperature on the opacity after
cooling from an original stack gas temperature at 300°C and found significant effects for initial H2SO4 concentrations greater than 5 parts per million (ppm). They further
evaluated the effects of particle size and found that H2SO4 condensation should have
minimal effects on particles greater than 1μ m.16 Lou et al.17 established an empirical equation similar to Beer’s law that was used to predict the plume opacity in terms of the stack diameter and concentrations of particles and total water-soluble sulfates. Meng et al.18 presented a computer simulation model that calculates the opacity due to primary particles emitted from the stack and secondary particles that form (such as SO3 hydrolyzes to H2SO4, hydrochloric acid [HCl], and ammonia [NH3]) in the
the effect of nitrogen dioxide (NO2) on the flue gas opacity and demonstrated that for
a coal-fired boiler with a NO2 concentration of approximately 10–50 ppm, the effect is
approximately 2–10%. Wieprecht et al.19 concluded that the water droplets within the flue gas after a flue gas desulfurization (FGD) unit were mainly formed via condensation onto fly ash particles. Although mist eliminators for coarse and fine droplets are highly efficient in FGD, some water moisture still remains.
It was found that fly ash consists of a mixture of particles with different chemical compositions and thus different optical properties.20 Most fly ash particles are spherical and glassy because of the rapid cooling of the molten droplets formed during combustion. And most particles are observed to be highly transparent at visible wavelength, whereas a small fraction (generally unburned carbon or iron oxides) are observed to be entirely opaque. Boothroyd et al.21 measured the light scattering phase functions and asymmetry factors for a sample of fly ash and compared them with Mie theory predictions. The results imply that fly ash could be treated as spherical particles under furnace conditions at which they were well dispersed. The complex refractive index (or optical constants) may be used together with Lorenz-Mie theory to predict the absorption, extinction, and scattering properties of particles under assumption of an equivalent sphere model and vice versa.
1.3 Motivation and objectives
The above literature illustrates that in-stack opacity is strongly correlated with various factors such as particle mass concentration, particle size distribution, particle density as well as the H2SO4 and NO2 concentrations, light scattering and refractive
index. The concentration of water moisture increases after a FGD unit with wet scrubbing is installed, but the effect of water moisture on opacity has not been fully
evaluated. Besides, the effect of SOx emission on in-stack opacity was not touched in the literatures. To the author’s knowledge, the extinction coefficient of SOx has not been determined. The objective of this study aims to investigate the effect of particle concentration, particle size distribution, particle density, water moisture NO2 and SOx
emissions on opacity so as to provide an empirical correlation between opacity and particulate concentration.
1.4 Research Methodology
In the study presented here, experiments were conducted at a full-scale coal-fired power plant to analyze the effects of particles and water moisture on opacity. The parameters Kp, Kw and KSOx (subscripts p and w denote particles and water moisture,
respectively) and the mass extinction coefficients kp, kw and kSOx for emitted particles,
water moisture and sulfur oxides, respectively, in the flue gas that leaves a FGD unit were determined. The parameters of Kp, Kw and KSOx were determined using nonlinear
least-squares regression and Newton’s method with the Lambert-Beer equation. To clarify the effect of water on the characteristics of particulates, which subsequently affect the extinction coefficient of particles, particle hygroscopicity was also examined. In addition to the empirical results, this study also estimated the parameters Kp and kp on the basis of the Mie theory using the computational BHMIE program22, 23
and existing data of complex refractive index for fly ashes under a spherical particle approximation. The estimations were compared with the experimental results of the study presented here. Finally, a correlation between concentration of particulate matter and opacity for coal-fired power plant is provided using regression estimates in consideration of water moisture, SOx and NOx emissions.
chapter 2, we give a brief review of light scattering theory and opacity. In Chapter 3, experimental equipment, design and procedures are discussed in detailed. In Chapter 4, we describe the inverse methodology for parameter estimation and sensitivity coefficient for various parameters. Results and discussion are given in Chapter 5. A correlation of opacity empirical model is given in Chapter 6. Finally, some conclusions and future works are drawn in Chapter 7.
Chapter 2 Optical Properties
This study investigates the in-stack opacity formation after flue gas desulfurization at a coal-fired power plant. Opacity is an index of obscuration of transmitted light as it passes through a medium. The obscuration is caused by extinction, which consists of absorption and scattering by constituents in the medium. The light extinction is the sum of the light scattering and light absorption coefficients; therefore, the light extinction is needed for evaluation of its effect on opacity. In this chapter, a brief review of light scattering theory and opacity is introduced.
2.1 Extinction
The light extinction is the sum of scattering and absorption by a particle. The total light extinction is expressed in terms of the extinction cross-section as
sca abs
ext =C +C
C (2.1)
where Cext is expressed the scattering cross-section, Cabs is expressed the absorption
cross-section, Csca is expressed the scattering cross-section.
The efficiency factors Q is used instead of cross-sections, being nondimensionalized with the projected surface of the sphere, and the extinction efficiency Qe of a particle is the sum of its scattering efficiency Qs and its absorption
efficiency Qa, sca abs
ext =Q +Q
Q (2.2)
Consider a monodispersed aerosol of N particles per unit volume with an extinction coefficienttp: 4 2 ext ext p p t Q Nd Q NA . (2.3)
where N is the numerical concentration of particles of diameter d, and Ap is the
particle area.
Light scattering theory may be categorized in terms of two theoretical frameworks, the Rayleigh and Mie scattering theories. In general, the scattering light intensity is dependent on the shape and size of particles. The Rayleigh theory is applicable to small spherical particles. There is no particle size limitation in Mie scattering theory. Therefore, Mie theory may be used for describing most spherical particle scattering systems, including Rayleigh scattering. However, due to the complexity of the Mie scattering formulation, Rayleigh scattering theory is generally preferred if applicable.
2.2 Mie scattering theory
A size parameter (x) which is the ratio of the meridional circumference of the sphere (2πr, where radius = r) to the wavelength (λ) of light in the medium, i.e. x = 2πr/λ. The Mie scattering theory is used for calculating light scattering for spherical particles with size parameter x <30.
The ratio of the intensity between wave scattered through an angle Θ by spherical particle, Isca, and the incident light, Iin, is given24,25,26,27 by
2 2 1 2 1 ) ( x i i I I in sca ; (2.4)
where i1 and i2 are the non-dimensional polarized intensities, and they are calculated
from 2 1 1(x,m, ) S i , (2.5) and 2 2 2(x,m, ) S i . (2.6)
where S1 and S2 are amplitude functions. The total amount of energy scattered by one
sphere into all directions is
i i d x d I I a a a C Q in sca sca sca ( )sin 1 2 0 1 2 4 2 2 2 (2.7)For the general case of arbitrary values for the complex index of refraction m and the size parameter x, the full Mie equations as expressed by van de Hulst must be employed,
1 ( 1) 1 2 1( ) [ (cos ) (cos )] n n n n n n n n a b S , (2.8)
1 ) 1 ( 1 2 2( ) [ (cos ) (cos )] n n n n n n n n b a S , (2.9)where and n are related to Legendre polynomials Pn n by
, cos ) (cos ) (cos d dPn n (2.10) , cos ) (cos sin ) (cos cos ) (cos 2 d d n n n (2.11)
The Mie a and b coefficients are at the heart of the calculation, and that for a sphere of radius r these were given as
) ( ) ( ) ( ) ( ) ( ) ( ) ( ) ( ' ' ' ' x y m x y x y m x y a n n n n n n n n n , (2.12) and ) ( ) ( ) ( ) ( ) ( ) ( ) ( ) ( ' ' ' ' x y x y m x y x y m b n n n n n n n n n . (2.13)
where n≧1, x = 2πr/λ, y = ma for a complex refractive index m. The functions ψand ξ are the Riccati-Bessel functions, and that related to the Bessel and Hankel functions28,
29, the ξ similar to the Hankel functions in that ξ =ψ-ix. We shall follow Refs.
) ( ) 2 ( ) (z z 1/2 Jn 1/2 z n , (2.14) and ) ( ) 2 ( ) (z z 1/2 Hn 1/2 z n (2.15)
Provided the wavelength of incident light, particle size distribution, and the refractive index of material, substitution of Eq. (2.8) and Eq. (2.9) into Eq. (2.7) gives the Qext for spherical particles as
) )( 1 2 ( 2 ) , ( Q 2 1 2 2 sca m x x
n n an bn (2.16)Finally, total extinction by a single particle (absorption with the particle, plus scattering into all direction) is related to the real part of the amplitude functions and can be expressed as }. { ) 1 2 ( 2 ) , ( Qext 2 n 1 n an bn x x m
(2.17)2.3 Rayleigh scattering theory
Rayleigh scattering24 is applicable when the radius (r) of the scattering sphere is much smaller than the wavelength (λ) of the incident light. Using Rayleigh scattering when r < 0.01 µm are essentially identical to the rigorous results obtained using Mie theory. In order for Rayleigh scattering to be valid, the size of the particle must be much smaller than the wavelength of the incident radiation, both inside and outside of the particle. If the scattering particles are extremely small, then the size parameter x= 2πr/λ becomes very small.
In the limit of r→0, only the a1 in Eq. (2.12) and Eq. (2.13) is nonzero, or
cos 2 1 cos ) ( ) ( 3 2 2 1 2 x m m i S S (2.18)
where m is index of refraction.
The amplitude functions (S1,S2)for one polarization is independent of scattering angle . then gives the efficiency factors as
4 2 2 2 2 1 3 8 x m m Qsca (2.19) x m m Qabs 2 1 4 22 . (2.20) The extinction efficiency Qe is the sum of its scattering efficiency Qs and its
absorption efficiency Qa. Substitution into Eq. (2.7), then give the extinction
efficiency factors as x m m x m m Qext 2 1 4 2 1 3 8 2 2 4 2 2 2 (2.21) 2.4 Opacity
A general relationship can be developed between the light transmittance (T) as it passes a medium of thickness L, the relationship between the transmitted intensity (I) and the incident intensity (I0). The transmission of light through a volume containing
an aerosol is described by the Lambert-Beer law13. The law states that considering could be expressed by L K W I I T ln( ) 0 (2.22) where T is transmission, W is the mass concentration, K is the ratio of the volume of a specific particulate to the mass extinction coefficient (cm3/m2), ρ is the density of the substance. K is dependent on the composition, size distribution, relative refractive index, and the beam wavelength.
section, the following equation can be derived. L L K W ext e e I I 0 (2.23) where σ ext is extinction coefficient.
Eq. (2.23) is the remarkable Lambert-Beer law, which illustrates the light intensity decreasing exponentially with travelled distance. Accordingly, the opacity could be expressed as L L K W ext e e I I Opacity 1 1 1 0 (2.24) Opacity is the amount of light obscured by particulate matters. The light reflected by objects behind the volume will be attenuated as it travels through the medium due to absorption. The amount of light received is therefore necessarily lower that the amount of light emitted. In-stack opacity can be used as an indicator of changes in performance of particulate control systems. The in-stack opacity can be explained in Fig. 2.1. The transmittance can be related to the opacity by
Opacity (%) = 100-transmission of light (%) (2.25)
Two types of opacity can be considered as in-stack opacity and out-of-stack opacity. In-stack opacity, which is due to emitted dust, gases (e.g. SO3、NO2) and
aerosols. Out-of-stack, which is the plume opacity formed after flue gas leaving the stack. For in-stack opacity, the major constituents usually consist of particulate, water moisture, sulfuric acid steam, and NO2. In the present study, the SOx concentration is
controlled by using liquid MgO in the FGD unit. Because the variation in opacity with a considerable change in SOx concentration was less than 0.6% and all experiments in
this study were performed at a SOx concentration controlled to within approximately
opacity is thus neglected.
An empirical correlation equation similar to that of the Lambert-Beer equation is then written as L K W K W K W L k W k W k W NO NO NO w w w p p p NO NO w w p p e e Opacity ( ...) ( 2 2 ...) 2 2 2 1 1 (2.26)
whereW ,p Ww, and WNO2denote the mass concentrations of particles, water moisture,
and NO2, respectively, andp, , andw NO2are the densities of particles, water, and
NO2, respectively. The parameters K (cm3/m2) and k (m2/g) are defined as described
above for species of particulates, water moisture, and NO2, respectively.
Nitrogen dioxide has absorption bands in the visible light region and thus affects opacity3. Eq. (2.26) thus includes the contributions of light extinction by particulates, water moisture, and nitrogen dioxide in the flue gas. Eq. (2.26) reduces to the classical equation for cases of light extinction by particulates only when NO2 and water
moisture are not included. The parameters of W ,p Ww,WNO2,p, andw NO2in Eq.
(2.26) can be readily obtained from experimental measurements, whereas values of Kp
and Kw (or kp and kw) need to be determined. According to Lindau3, 1/( 2 NO K × 2 NO ) is the mass extinction coefficient k of NO2 which was measured to be 3.3 × 10⁻⁴ ppm-1
m-1. The Eq. (2.26) became as
L W K W K W NO w w w p p p e Opacity 1 ( 0.0003* 2...) (2.27)
In-stack opacity
80% transmission 100% light
Opacity = 100% – 80% = 20%
Chapter 3 Experiments
3.1 Basic information of the power plant in-stack instruments
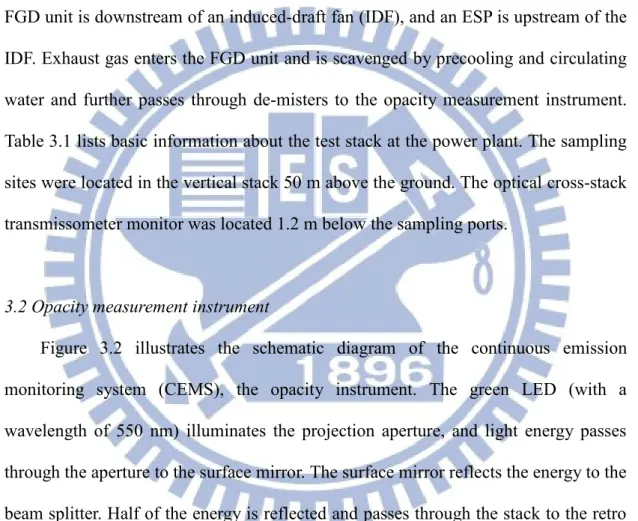
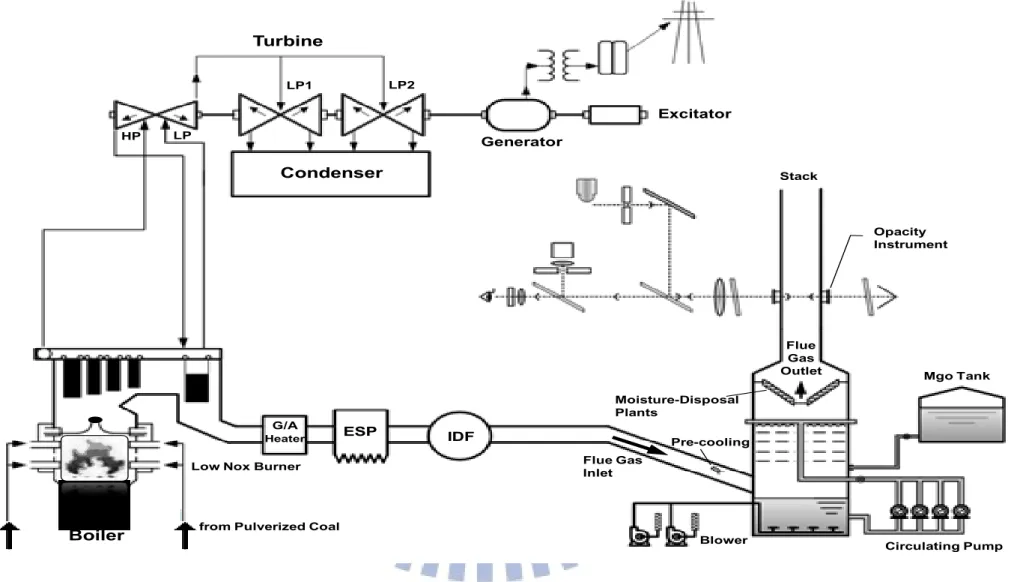
In the study presented here, experiments were conducted in a commercialized coal-fired power plant with a FGD unit with a wet scrubber, as shown in Figure 3.1. The plant comprises a coal-fired boiler, steam turbines, and a 14.3-MW generator. The FGD unit is downstream of an induced-draft fan (IDF), and an ESP is upstream of the IDF. Exhaust gas enters the FGD unit and is scavenged by precooling and circulating water and further passes through de-misters to the opacity measurement instrument. Table 3.1 lists basic information about the test stack at the power plant. The sampling sites were located in the vertical stack 50 m above the ground. The optical cross-stack transmissometer monitor was located 1.2 m below the sampling ports.
3.2 Opacity measurement instrument
Figure 3.2 illustrates the schematic diagram of the continuous emission monitoring system (CEMS), the opacity instrument. The green LED (with a wavelength of 550 nm) illuminates the projection aperture, and light energy passes through the aperture to the surface mirror. The surface mirror reflects the energy to the beam splitter. Half of the energy is reflected and passes through the stack to the retro reflector for measurements of in-stack flue gas opacity. The energy reflected by the retro reflector passes along the same path through the stack, and further through the beam splitter and field lens aperture to the signal detector which measures the plume opacity.
The variables affecting the in-stack opacity also divided into the following two groups30: the controllable and uncontrollable variables. Controllable variables are those related to equipment operation and design. Uncontrollable variables are the characteristics of combustion, equipment operation, and allowable instrument measurements error. Table 3.2 shows both types of variables.
As far as the controllable variables are concerned, the following statements can be made31:
NO2 emission: Nitrogen dioxide (NO2) has absorption bands in the visible
light range, and, it would affect the opacity. The effect of NO2 could be
controlled with low NOx burners (LNB).
Mass emission of particulate matter: the higher the mass concentration of
particulate emissions, the higher the opacity. For small particles (0.5μ m) opacity decreases as the deviation from the mean particle size is increased while for large particles (above 2 μ m) the converse is true.
SOx emission: The pollutant SOx from coal-fired boiler can affect opacity
measurements. Most of sulfuric acid gas emissions are SO2, which can be
converted to SO3 with oxygen. SO3 can be subsequently reacted with water
moisture in the flue gas and at temperatures below the acid dew point condensed into sulfuric acid mist droplets, which will increase the opacity.
Water moisture content: The amount of moisture in a plume influences
opacity measurement. Temperature and humidity conditions can result in the condensation of some of the water vapor in the flue gas, which will increase the opacity.
Excess air: The excess air with a forced draft fan and induced draft fan will
opacity.
Stack gas temperature: The gas temperature influences the relationship
between standard and actual volume. The lower the exhaust gas temperature, the higher the particle concentration and hence the higher opacity.
Light path: The CEMS described in the previous section includes an
adjustable light path and further influences the opacity.
As far as the uncontrollable variables are concerned, the following statements can be made:
Particle density: the lower the density of the particles emitted at a given
boiler loading, the larger the number of particles and hence the higher opacity.
Refraction index of particle: Typical power plant fly ash particles have an
index of refraction of about 1.5. However, considering the different combustion characteristics and ash compositions, a range of 1.4 to 1.6 might be expected.
Color of the plume: The color of the plume is related to the type of fuel
burned and the resulting constituents of the particulate matter and flue gas in the plume.
3.4 Experimental method and procedure
To evaluate the effects of various constituents on in-stack opacity, particle mass concentration, water moisture concentration, gaseous oxides of sulfur (SOx), nitrogen
(NOx), and oxygen (O2) concentrations, flow rate, flue gas temperature, the circulating
water pH of FGD, H2SO4, and opacity were measured simultaneously for each run. In
variables by adjusting the ESP currents, the FGD unit operating conditions, and boiler loads (BO), respectively. The parenthesis behind each controllable variable in Table 3.2 includes the adjustments that will influence this controllable variable. Two of the controllable variables, the light path and excess air, are kept constant in present study. The ESP currents were regulated to produce various particle concentrations, the precooling and circulating water in the FGD unit were adjusted to produce various mass concentrations of water moisture in the flue gas, and the boiler loads were adjusted by changing the input rate of the coal feeder. When the effect of a load was to be analyzed, the other two loads were set to a relatively steady state to systematically and quantitatively examine its effect on opacity. Note that the operation conditions were limited to those that could not exceed the Republic of China Environment Protection Administration (ROC EPA) emission standards. The in-stack opacity, water moisture, and particle mass concentration were measured simultaneously under various conditions of the boiler load, FGD, and ESP to evaluate their effects on Kp and
Kw. The in-stack instruments include an opacity meter, a CEMS, a thermometer, a
flow rate meter, and a pH meter. Opacity was measured by an optical transmissometer using a green light-emitting diode with a wavelength of 550 nm. The readings of opacity were recorded every 6 sec. The value of opacity presented in the following is the average of readings at three 6-min intervals. The CEMS is a lineup of analyzers for the measurement of NOx, SOx, and O2 stack gases emitted from the boilers of a
thermoelectric coal-fired power plant. The units are capable of the simultaneous and continuous measurement of various components. The temperature of the flue gas was monitored every minute by a resistance thermometer (RTD, type Pt 100). The flow rate of the flue gas was monitored every minute by a supersonic flow rate meter. Table 3.3 showed the accurate analysis of CEMS instruments lists.
3.5 Flue gas sampling methods and analyses
The flue gas was sampled to obtain the mass concentration of particles Wp
(mg/Nm3), the mass concentration of water moisture Ww (g/Nm3), and the particle size
distribution. In addition to the above factors, particle density, particle chemical compositions, and particle shape were also measured. The isokinetic sampling of the ROC EPA Method 1, a modified method of the U.S. Environmental Protection Agency Method 5 with fiberglass thimbles replacing the fiberglass filter, was used to measure the particle mass concentration. The mass concentration of particles was determined by gravimetric analysis of the samples. The water moisture in the stack flue gas was absorbed by calcium chloride (CaCl2) pellets, and the water mass
concentration was determined by gravimetric analysis. Sampling of the particles by filter method continued for 30 min, and the total sampled flue-gas volume exceeded 500 L. Sampling of the water content took 10 min, and the total sampled flue-gas flow exceeded 10 L for each sample. The particle size distribution was determined using a cascade impactor with nine impactor stages with cut sizes from 0.1 to 10 μ m, associated with the gravimetric analysis of the samples. To measure the concentration of H2SO4, a sample was obtained from the stack gas through a heated quartz-lined
probe. The concentration of H2SO4 was determined using a method similar to that
utilized in Ref. 17, and analysis was conducted on an ion chromatograph. The particle density was analyzed using an ultrapycnometer and by applying Archimedes’ principle of fluid displacement and Boyle’s law. Particle chemical compositions were analyzed using inductively coupled plasma with atomic emission spectroscopy and by performing standard industrial analyses. The particle shapes were determined using a scanning electron microscope (SEM) from the filter tube. All indicated data are
averages of at least three repeated runs and include the standard deviation. The SOx concentration of the flue gas was controlled using an aqueous magnesium oxide (MgO) solution. The flue gas had passed through the de-mister with an outlet temperature of nearly 50°C. In the FGD unit, the efficiency of SOx removal test data
was up to approximately 99%. The experimental measurements show that when the SOx concentration increased from 21 to 143 ppm, the concentration of H2SO4
increased from 3.1 to 7.7 mg/Nm3 and the in-stack opacity increased from 24.6 to 25.2%. Because the variation in opacity with a considerable change in SOx
concentration was less than 0.6% and all experiments in this study were performed at a SOx concentration controlled to within approximately 20–36 ppm, the effects of SOx
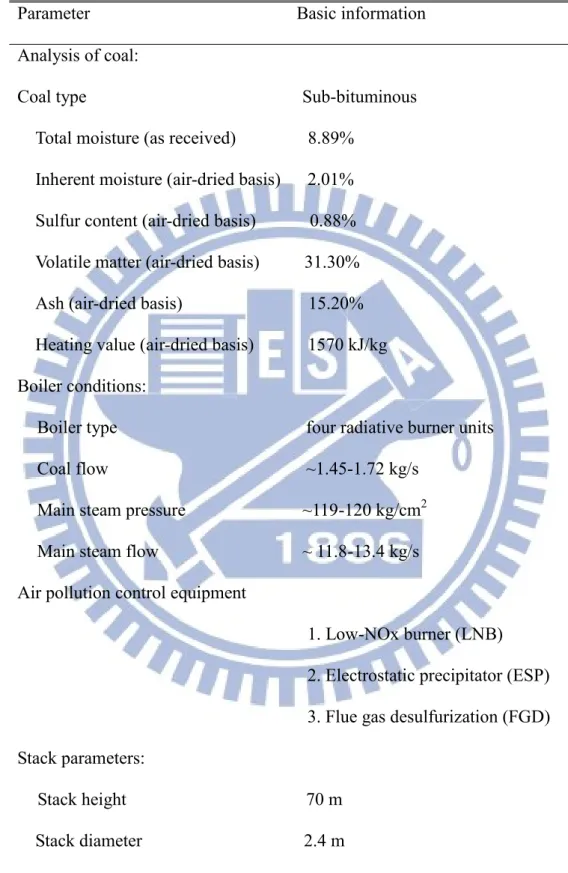
Table 3.1 Basic information on the power plant
Parameter Basic information Analysis of coal:
Coal type Sub-bituminous Total moisture (as received) 8.89%
Inherent moisture (air-dried basis) 2.01% Sulfur content (air-dried basis) 0.88% Volatile matter (air-dried basis) 31.30% Ash (air-dried basis) 15.20% Heating value (air-dried basis) 1570 kJ/kg Boiler conditions:
Boiler type four radiative burner units Coal flow ~1.45-1.72 kg/s
Main steam pressure ~119-120 kg/cm2 Main steam flow ~ 11.8-13.4 kg/s Air pollution control equipment
1. Low-NOx burner (LNB)
2. Electrostatic precipitator (ESP) 3. Flue gas desulfurization (FGD) Stack parameters:
Stack height 70 m Stack diameter 2.4 m
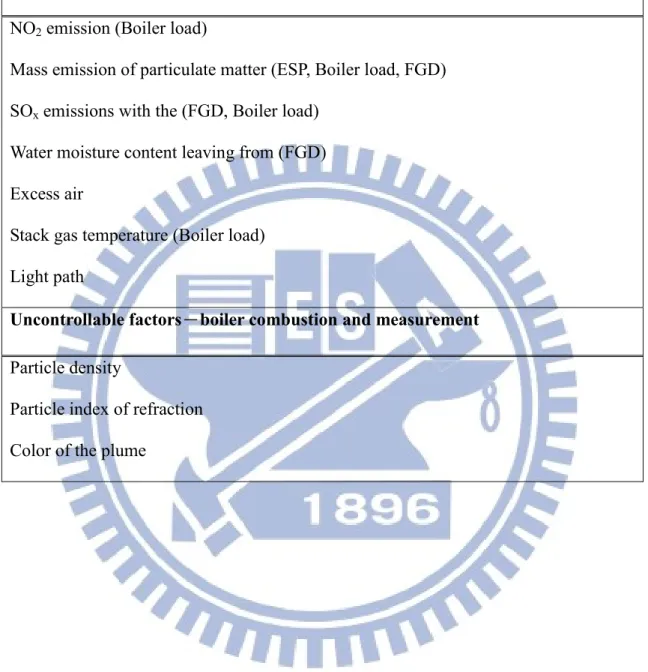
Table 3.2 Summary of the influencing in-stack opacity
Controllable factors-boiler combustion、equipments and design variables:
NO2 emission (Boiler load)
Mass emission of particulate matter (ESP, Boiler load, FGD) SOx emissions with the (FGD, Boiler load)
Water moisture content leaving from (FGD) Excess air
Stack gas temperature (Boiler load) Light path
Uncontrollable factors-boiler combustion and measurement
Particle density
Particle index of refraction Color of the plume
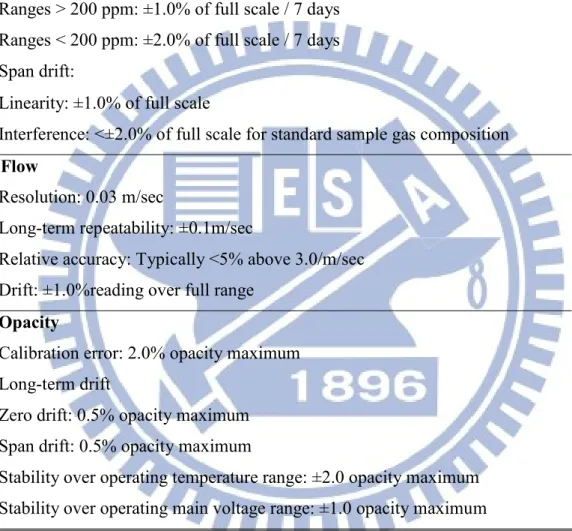
Table 3.3 Schematic the CEMS instruments
Exhaust gas analyzer (measured components: NOx, SO2, CO, CO2 and O2)
Repeatability:
Ranges≧200 ppm: ± 0.5% of full scale Ranges≦200 ppm: ± 1.0% of full scale Zero drift:
Ranges > 200 ppm: ±1.0% of full scale / 7 days Ranges < 200 ppm: ±2.0% of full scale / 7 days Span drift:
Linearity: ±1.0% of full scale
Interference: <±2.0% of full scale for standard sample gas composition
Flow
Resolution: 0.03 m/sec
Long-term repeatability: ±0.1m/sec
Relative accuracy: Typically <5% above 3.0/m/sec Drift: ±1.0%reading over full range
Opacity
Calibration error: 2.0% opacity maximum Long-term drift
Zero drift: 0.5% opacity maximum Span drift: 0.5% opacity maximum
Stability over operating temperature range: ±2.0 opacity maximum Stability over operating main voltage range: ±1.0 opacity maximum
Stack Opacity Instrument Flue Gas Outlet Flue Gas Inlet Mgo Tank Moisture-Disposal Plants Pre-cooling ESP G/A Heater IDF Boiler Condenser Generator Excitator Turbine HP LP LP1 LP2
Low Nox Burner
from Pulverized Coal
Blower Circulating Pump
GREEN LED FIRST SURFACE MIRROR PROJECTION APERTURE SIGNAL DETECTOR STACK WINDOW WINDOW WINDOW FIELD LENS APERTURE EYEPIECE WITH RETICLE RETRO REFLECTOR PROJECTION LENS 50/50 BEAM SPLITTER 80/20 BEAM SPLITTER
Chapter 4 Methodology for Estimating Parameters
4.1 Nonlinear least squared method
The parameters Wp, Ww, WNO2, ρp , ρw , and ρNO2 in Eq. (2.25) are readily obtained
from experimental measurements, while the values of Kp and Kw (or kp and kw)
remained to be determined. According to Lindau (1991), 1/(
2 NO K × 2 NO ) is the mass extinction coefficient k of NO2 and is measured to be NO2 concentration (ppm)
×3.3×10⁻⁴ (ppm-1m-1). In the present study, the least squares method is used to simultaneously determine the parameters of Kp and Kw measured at various
operational conditions. In the present study, the least-square method is used to simultaneously determine the parameters Kp and Kw with measured opacities under
various operation conditions.
In the inversion procedure, the squared error, E, is defined as:
)] ( [ )] ( [ )] , ( ) , ( [ 1 2 , ,
Y Y K K Op K K Op E T n i w p e i w p c i (4.1)where Opi,e and Opi,c denote the measured and estimated opacities, respectively.
e Op i Y() 1, , (4.2) And βKp, Kw. The values of Kp and Kw are determined by minimizing E. The
partial derivation of E with respect to β is expressed as: )] ( [ )] ( [ 2 E T Y (4.3) Let X() [ ()]T (4.4) where X is the sensitivity matrix, and the elements of this matrix are called the ―sensitivity coefficients‖.32 When E = 0, the minimum value of E exists, and the
corresponding set of solutions, , is given by ^ 0 ] ) ( [ ) (^ Y ^ XT (4.5)
The Taylor series expansion of (^)at b is ) )( ( ) ( ) (^ b b ^b (4.6) Substituting Eq. (4.6) into Eq. (4.5) yields:
0 )] )( ( ) ( )[ (b Y b X b ^b XT (4.7)
Eq. (4.7) is applied for the numerical computation of the inverse estimation of parameters. Newton’s iteration method is used with initial guesses of b. After iterating k times, the (k+1)th iteration is started with new parameters:
)] ( [ ( ) ( ) ) ( ) ( ) 1 (k bk P k XT k Y k b (4.8) and ) ( ) ( 1 ) ( ] [ k T k k X X P (4.9) The computation continues until the values of Kp and Kw at 2 consecutive
calculations differ by a specified limit.
4.2 Sensitivity analysis of parameters
Sensitivity coefficients are very important because they indicate the magnitude of change of the response due to perturbations in the values of the parameters. They appear in relations to many facets of parameter estimation. It is urged to pay particular attention to them and even to plot them versus their independent variables if their shapes are not obvious33. In this study, sensitivity coefficient is defined as the derivative of opacity with respect to the parameter, Kp,Kw,Wp and Ww. It describes the
parameters of Wp, Ww, Kp, and Kw with opacity used data of typical variations in Wp
and Ww to give the levels of variation of Kp and Kw. For expression of opacity in Eq.
(2.31), the following equations strictly describe the effects of the parameter sensitivity analysis: L W K W K W p p p p NO w w w p p p e K L W K Op ( 0.0003 ) 2 2 (4.10) L W K W K W w w w w NO w w w p p p e K L W K Op ( 0.0003 ) 2 2 (4.11) L W K W K W p p p NO w w w p p p e K L W Op ( 0.0003 2) (4.12) L W K W K W w w NO w w w p p p e K L W Op ( 0.0003 2) (4.13)
4.3 Theoretical calculation of the particle parameter Kp
Given the wavelength of incident light, particle size distribution, and the complex refractive index of particles, Mie theory can be applied to estimate the particle light extinction efficiency factor, Qext, which is defined as the ratio of the
extinction coefficient to the cross-sectional area for spherical particles. Light extinction by non-spherical particles in random motion was also reported by Hodkinson34 to be nearly the same as that for spherical particles much larger and much smaller than the wavelength of incident light. In the present study, Qext is
determined using the BHMIE program under equivalent spheres model.
2 1 2 1 ) ( ) ( 3 4 2 3 r r ext r r p dr r f r Q dr r f r K (4.14)where f(r) is the normalized particle number density, r is the radius of particles, and Qext is the particle light extinction efficiency factor.
4.4 Estimation of moisture droplet mean diameter
Moisture molecules may concentrate at flow gas temperature drops, they combine to form water droplets. For a monodispersion of spherical moisture droplets, the relationship between the mass extinction coefficient and extinction efficiency factor can be deduced from Eq.(2.3) and is expressed as:
kw Ww= NQwext r
2 (4.15)
where Qwext is the extinction efficiency factor of a moisture droplet determined by Mie
theory, and r is the radius of the moisture droplet. N is the number of moisture droplets per unit volume, and is given from mass concentration of water moisture as
w
W /(4r3 /3). The amount of water moisture present in gas can also be described by w
the expression of relative humidity.
For water moisture, it scatters and does not absorb the beam at the investigated wavelength. And the index of refraction is about 1.33. In the Rayleigh scattering regime, the extinction efficiency factor can be further expressed35 as:
4 2 2 2 ) 2 ( 2 1 3 8 r m m Qwext (4.16) From Eqs. (2.3), the effective mean diameter (2r) of water moisture droplets can be estimated after the mass extinction coefficient kw is readily determined.
Chapter 5 Results and Discussion
5.1 Summary of flue gas and characteristics of particles
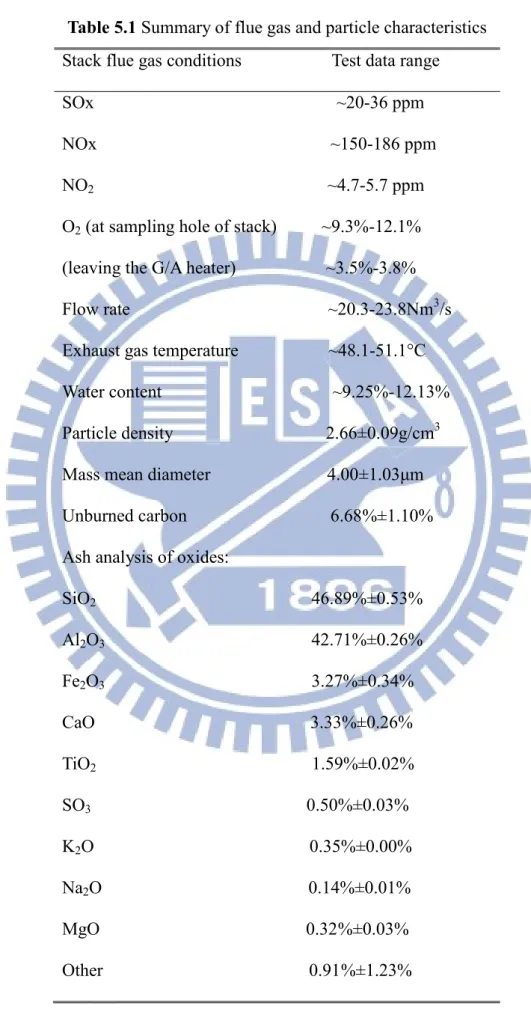
When pulverized coal is burned in a boiler, most of the ash leaves the furnace (as fly ash) with the flue gas. Table 5.1 shows the composition of flue gas and the constituents of ash under various operation conditions of the boiler load. In this investigation, major compositions of the fly ash particles were SiO2 (46.9%±0.5%)
and Al2O3 (42.7%±0.3%); the particles contained 5.8% ~ 7.8% unburned carbon by
weight. The particle density is 2.66 ± 0.09 g/cm3; this density is assumed to be constant over the range of particle sizes measured and is close to the typical soil density. Fig. 5.1 shows the particle size distributions for particle concentrations at various boiler loads. Set #1, #2, and #3 are for particle concentrations of 36.5, 45.6, and 51.5 mg/Nm3 respectively. Typical mass and cumulative distributions of emitted particles on weight basis are shown in lognormal coordinates, and all of three samples have been equipped with the ESPs. Most of the particles had diameters greater than 0.5 μm, the particle sizes larger than 11μm were 10.5%, and the mass mean diameter was 4.00±1.03 μm. Furthermore, the size particles remained steady with different boiler loads, because the samplings of flue gas were made downstream of the ESPs. The SEM micrographs of particles were presented in Fig. 5.2 and Fig. 5.3. The results from SEM showed that most of particles less than 5 μm were nearly spherical. Cho et al.36 concluded that fine fly ash particles (< 200 mesh) were spherical, while the coarse particles (> 200 mesh) were mostly irregular and porous, which is consistent with the conclusions of Refs. 17 and 18 mentioned earlier.
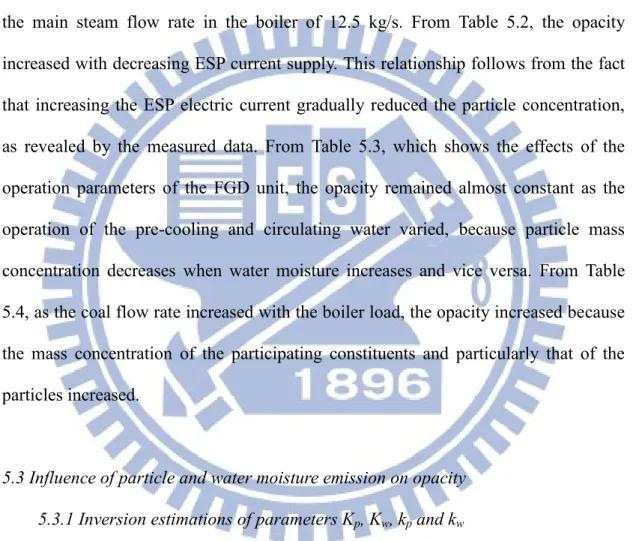
Table 5.2, Table 5.3 and Table 5.4 presents detailed experimental results for variations of ESPs, FGD, and boiler load, respectively, where the various operation conditions were set by regulating ESP currents, adjusting the pre-cooling and circulating water in the FGD unit, and adjusting the main steam flow rate by changing the feeding rate of coal into the boiler. The baseline condition was set as an ESP current of 200mA, the FGD unit pre-cooling and circulating water at 0.36 m3/s, and the main steam flow rate in the boiler of 12.5 kg/s. From Table 5.2, the opacity increased with decreasing ESP current supply. This relationship follows from the fact that increasing the ESP electric current gradually reduced the particle concentration, as revealed by the measured data. From Table 5.3, which shows the effects of the operation parameters of the FGD unit, the opacity remained almost constant as the operation of the pre-cooling and circulating water varied, because particle mass concentration decreases when water moisture increases and vice versa. From Table 5.4, as the coal flow rate increased with the boiler load, the opacity increased because the mass concentration of the participating constituents and particularly that of the particles increased.
5.3 Influence of particle and water moisture emission on opacity 5.3.1 Inversion estimations of parameters Kp, Kw, kp and kw
The values of parameters Kp and Kw were determined from the experimental data
in Table 5.2, Table 5.3 and Table 5.4, using the inversion methodology described above. The results show that the values of Kp and Kw were 1.642 cm3/m2 and 2520
cm3/m2, respectively, corresponding to kp and kw values of 0.229 m2/g and 0.000397
m2/g, respectively. Although Kp and Kw differ by three orders of magnitude, the effect
to the existence of a considerable mass of water moisture after the FGD unit. As illustrated in Table 5.2, Table 5.3 and Table 5.4, which shows that the NO2
concentration under typical conditions of a coal-fired boiler was in the 4.7-5.7 ppm range with a stack diameter of 2.4 m, NO2 was responsible for less than 0.90% of
opacity. Table 5.5 presents the estimates of parameters Kp and Kw at various loads. For
the inversion estimates, the data at various ESP loads produced Kp = 1.522 cm3/m2
and Kw = 2596 cm3/m2, the data at various FGD loads produced Kp = 1.890 cm3/m2
and Kw = 2347 cm3/m2, and the data at various boiler loads produced Kp = 1.191
cm3/m2 and Kw = 2896 cm3/m2. As the mean inversion estimations of a Kw of 1.642
cm3/m2 and a Kp of 2520 cm3/m2, obtained using all measurements at various loads,
are applied to predict the opacity, the numerical results reveal that the measured opacity data are linearly correlated with the values predicted by Lambert-Beer’s law, and the regression is 92.94% of confidence.
The experimental uncertainty analysis of parameter Kp and Kw are based on the
uncertainties in the experimentally measured quantities that are used in form of mathematical relationship to calculate that derived quantity. The model used to convert the measurements into the derived quantity is usually based on fundamental principles of a science or engineering discipline. Table 5.5 also shows that the mean uncertainty of parameter δ kp andδ kw were 0.00619 cm3/m2 and 1.172 cm3/m2,
respectively.
5.3.2 Theoretical values of particle parameter Kp
The theoretical particle parameter Kp, computed using Eq. (4.14), is determined
from the particle number density and the complex refractive index at a given wavelength. The complex refractive index of particles could not be measured directly,