Title: Effects of Multidisciplinary Care on Utilization of Emergency Care for Lung Cancer Patients
Abstract
Objectives: To improve the quality of care, multidisciplinary team (MDT) care was implemented in Taiwan. This study examined the effect of MDT care on reducing emergency department visits for lung cancer patients.
Study Design: A retrospective cohort study with MDT care participants and a matched control group of MDT care non-participants was followed.
Methods: In this study, 22,817 patients with newly diagnosed lung cancer were recruited from 2005 to 2007 in Taiwan. Matching based on the propensity of
receiving MDT care was used. A total of 8,172 patients were observed in this study. A chi-square, ANOVA, logistic regression, and Poisson regression were used to
elucidate the effects of MDT care.
Results: The lung cancer patients participating in MDT had lower risk to visit emergency department (OR=0.89; 95% CI = 0.80~0.98), and the incidence rate ratio decreased by 11% (95% CI = -0.15 ~ -0.07). Gender, premium-based monthly salary, urbanization of the residence area, comorbid conditions, catastrophic illness/injury, treatment method, number of outpatient visits, length of stay, hospital ownership, level of hospital and physicians’ age and gender were all significantly related to the frequency of emergency department visits (P < 0.05).
Conclusion: The frequency of emergency department visits of patients with MDT care was lower than that of those without it. The patients with MDT received enhanced
care.
Key words:
Multidisciplinary care; utilization; emergency department; lung
cancer
Introduction
Worldwide, lung cancer is the most common cancer for both incidence and mortality. In 2008, there were 1.61 million new cases and 1.38 million deaths caused by lung cancer. 1 Since 1998, lung cancer has been the leading cause of cancer death
in Taiwan and worldwide. 2 Although progress has been made in the diagnosis and
treatment of lung cancer, the incidence and mortality rate of lung cancer has increased in recent years. Formal multidisciplinary team (MDT) care has been widely promoted to improve coordination, communication, and decision making in cancer
management. 3, 4
The Taiwan Bureau of National Health Insurance has implemented
“multidisciplinary team care for cancer patients” since April 2003 to enhance the quality of cancer diagnosis and treatment. The Bureau emphasizes an MDT approach that provides a complete cancer treatment scheme for patients. MDT care goes beyond conventional treatments for lung cancer, such as surgical excision, radiation therapy, and chemotherapy. The MDT members consisted of related clinical
physicians, nursing staff, psychological consultant, social worker, and case manager to discuss a dedicated treatment plan and to integrate all treatments and care.
Therefore, the patient with MDT care should possess of stable and continuous care such as regular outpatient visits and inpatient treatment through case manager’s
arrangement and coordination. The Bureau of NHI paid additional fee as the financial incentive for the MDT care. The MDT approach has been used for years in numerous countries. Studies from the United States, Germany, United Kingdom, and Australia have demonstrated that an MDT that integrates surgeons, tumor physicians, radiology physicians, psychologists, physiatrists, and dietitians can improve the quality of life for cancer patients, 5 lower the cost of health care, 6 and increase the satisfaction of
patients,6 cure efficiency, 4, 5, 7, 8 and survival rate. 9, 10 In Taiwan, Wang et al. found the
relative risk of death was lower for oral cavity cancer in MDT care participants. 4
Chen et al. found CKD patients had a better survival rate and were more likely to initiate renal replacement therapy instead of mortality after MDT intervention.11
Hospital emergency departments (ED) are typically designed to manage emergent or unexpected situations and are generally crowded and busy. 12 In North
Carolina (United States), 0.9% of ED visits were cancer-related, and 7.7% of cancer survivors visited the ED and each ED visitor received 1.4 ED services per year on average. 13 In Taiwan, 1.9% of ED visits were cancer-related. 14 The reasons for
cancer patients to obtain ED services include pain, dyspnea, nausea and vomiting, and so on.13, 15 Among cancer patients, the highest proportion that seeks ED services is
lung cancer patients.13The main reasons that prompted the lung cancer patient to
digestive complaints.16 The high percentage of ED visits for cancer patients has been
recognized as an indicator of poor-quality end-of-life cancer care. A better care could avoid cancer patients to incur unexpected urgent medical problem.
Most studies on lung cancer in MDT care have been limited because of small sample size or have focused on survival, and few studies examined the changes in the utilization of ED services after MDT care involved. Therefore, this study investigates the influence of the participation and non-participation of patients in MDT care on the utilization of ED visits.
Materials and methods 1. Data Source
This retrospective and longitudinal cohort study analyzed the Cancer Dataset in the National Health Insurance Research Database (from 1997 to 2008) published by the Taiwan National Health Research Institutes and provided by the Bureau of National Health Insurance of Taiwan. The database included the medical records of all individuals insured by National Health Insurance in Taiwan. At the end of 2009, a total of 23,026,000 people were insured, constituting 99.59% of Taiwan’s population. Therefore, the data could represent the utilization of the lung cancer patients in Taiwan. The Bureau of National Health Insurance implemented MDT care in April
treatments (the major ICD 9 code 140-293) and all medical records and disposition of archives.
2. Participants
A total of 8,172 lung cancer patients between 2005 and 2007 were newly
diagnosed in the Cancer Dataset from the Taiwan National Health Insurance Research Database. New captivity defines a first time lung cancer diagnoses based on the ICD 9 code 162, and diagnosis following a year of chemotherapy, radiation treatment, surgery, or other cancer treatment. We evaluated each patient within one year after lung cancer diagnosed. We excluded the patients without any treatment within one year after cancer diagnosed, and also excluded the patients who died within one month after cancer diagnosed (N=2050 patients). Since the physicians could decide whether the patients participated in the MDT care or not, the MDT participants might exist bias selection. Therefore, in order to reduce the bias selection, from this
population-based data, this study selected a total of 8,172 lung cancer patients who joined a MDT care of 2,736 for lung cancer patients and additional lung cancer patients (20,081) who matched the research objective, using propensity score matching (PSM) to evaluate the likelihood of participating in MDT care for each patient and to select double patients as the control group.
The independent variables included patients’ sex, age, premium-based monthly salary, urbanization of their residence area, Charlson comorbidity index, catastrophic illness/injury, number of cancer outpatient visits, number of hospitalizations, hospital and physicians’ characteristics, and participation status in MDT care. The dependent variables included whether the patients used the ED service or not and the frequency of the ED use within one year after lung care diagnosed, excluding the utilization of the ED due to trauma.
The study participants were categorized by sex (male, female), age (divided into 7 groups from less than 24 to 75 and older), premium-based monthly salary (divided into 8 groups), urbanization of residence area (divided into seven scales, 17 1 denoted
the highest degree of urbanization and 7 denoted the lowest degree of urbanization), Charlson Comorbidity Index (CCI, the extent of comorbidity was adapted by Deyo),
18 catastrophic illness/injury (yes or no), number of cancer outpatient visits (divided
into 7 groups, from 0 to 26 and above), length of stay (LOS) (divided into 5 groups), hospital ownership (public or non-public), hospital level (medical, regional hospital, district hospital, and clinics), and physicians’ characteristics (sex and age).
4. Analytical Methods
The statistical package for the social sciences (SAS/Pct, version 9.2) was used for data entry and analysis. The study used descriptive statistics, chi-square test, t test,
and ANOVA to analyze the characteristics of demography, health status, disease treatment method, utilization of healthcare within one year, hospital and physicians’ characteristics, and the differences in ED visits between those who did and did not participate in MDT care. Logistic regression and Poisson regression were used to analyze the inference factors of probability and frequency of ED visits between the patients who did and did not participate in MDT care.
Results
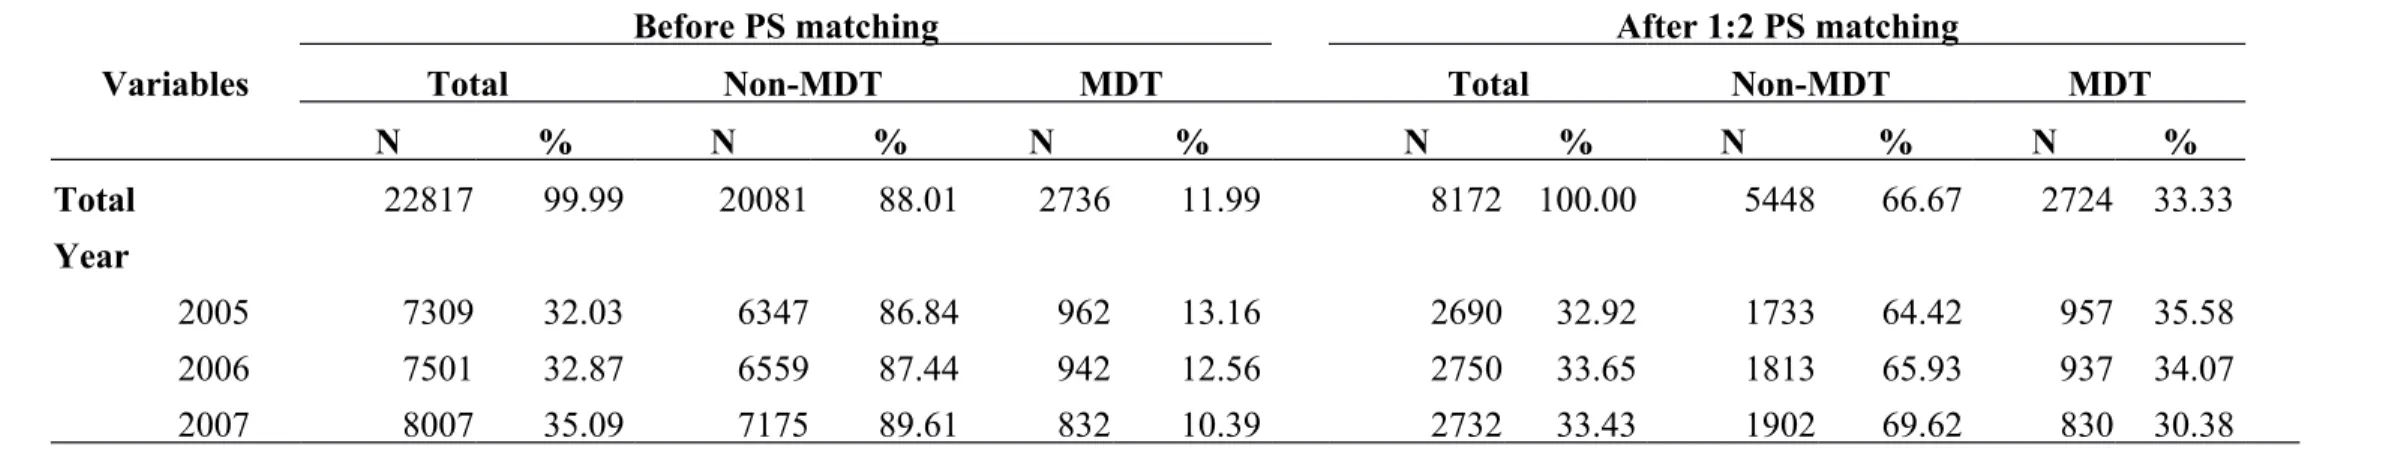
Tables 1 and 2 show the characteristic distribution before and following the sample PSM. Following PSM, 8,172 samples were selected for this study. The characteristics included the gender, age, premium-based monthly salary, urbanization of residence area, CCI, catastrophic illness/injury, and treatment methods of MDT participants and non-MDT participants. The differences between the two groups in these variables were not statistically significant (P > 0.05).
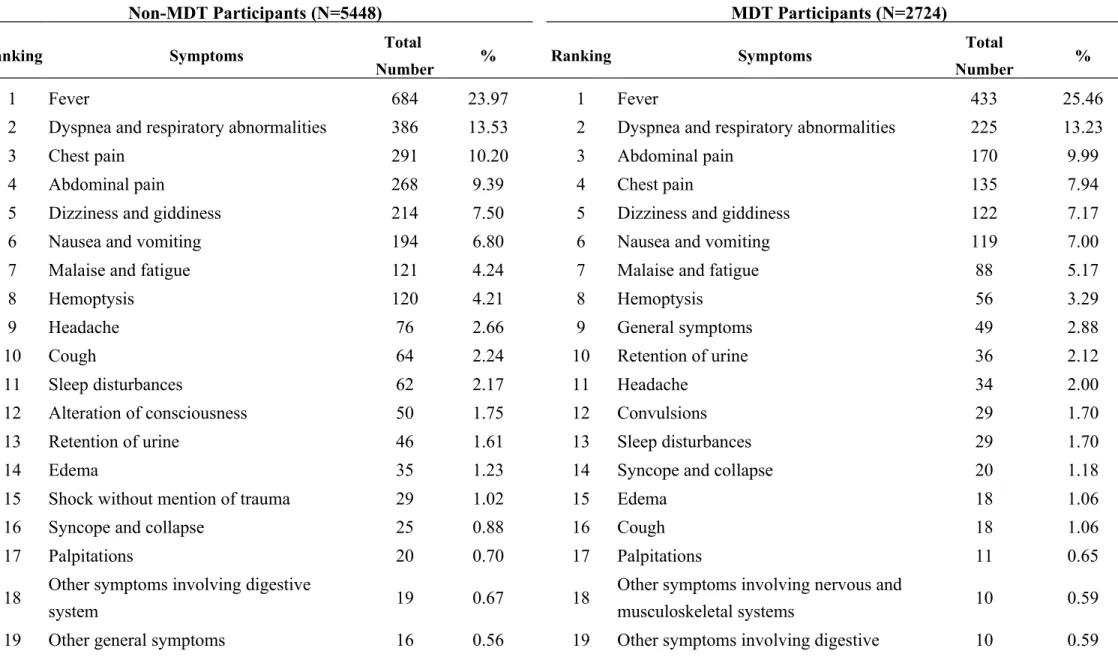
Table 3 shows the top 20 causes of lung cancer patients’ ED visits. The primary cause was fever for both the MDT participants (25.46%) and non-MDT participants (23.97%), followed by dyspnea and respiratory abnormalities, chest pain, abdominal pain, and dizziness and giddiness. These top five causes account for 64% of the overall causes of lung cancer patients’ ED care visits. The respective percentages that both groups showed on the items did not differ significantly. Fewer MDT participants
(7.94%) visited EDs because of lung cancer-related chest pains compared with the non-MDT participants (10.2%). Furthermore, fewer MDT participants (1.06%) visited EDs because of coughing compared with non-MDT participants (2.24%). Among the top 20 causes for the MDT participants’ ED care visits, general symptoms accounted for 2.88%, convulsions accounted for 1.7%, and other symptoms involving nervous and musculoskeletal systems accounted for 0.59% ), whereas 1.75% of the causes for non-MDT participants’ ED care visits were alteration of consciousness, 1.02% were shock without mention of trauma, and 0.56% were other general symptoms.
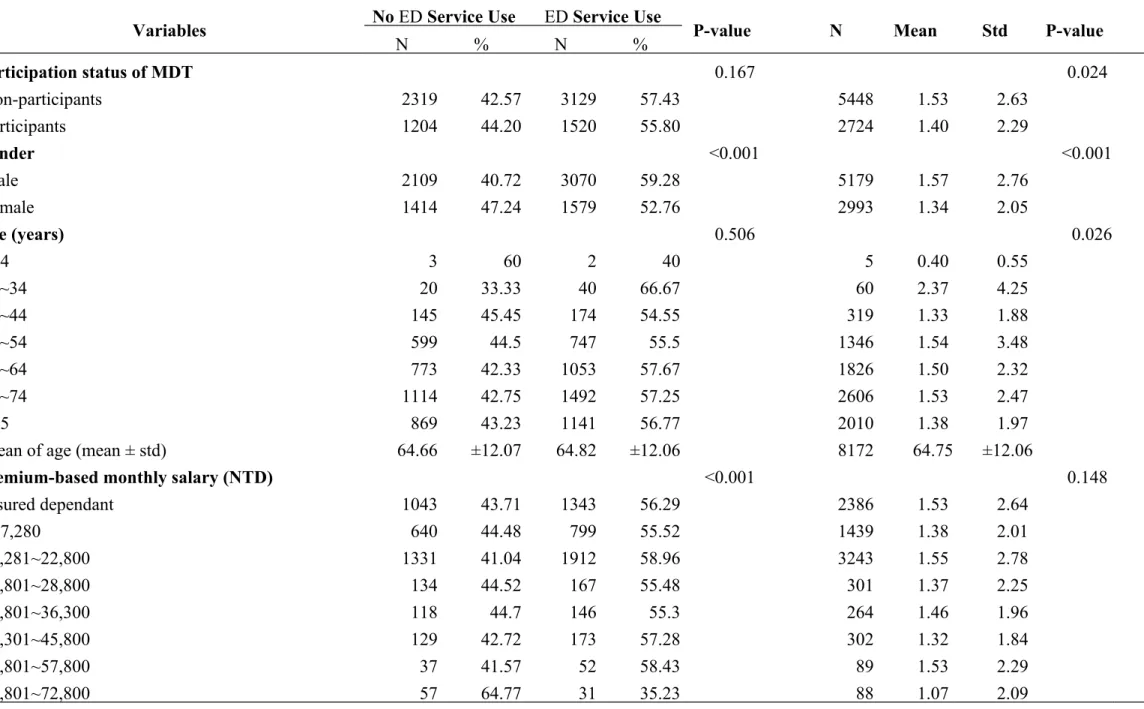
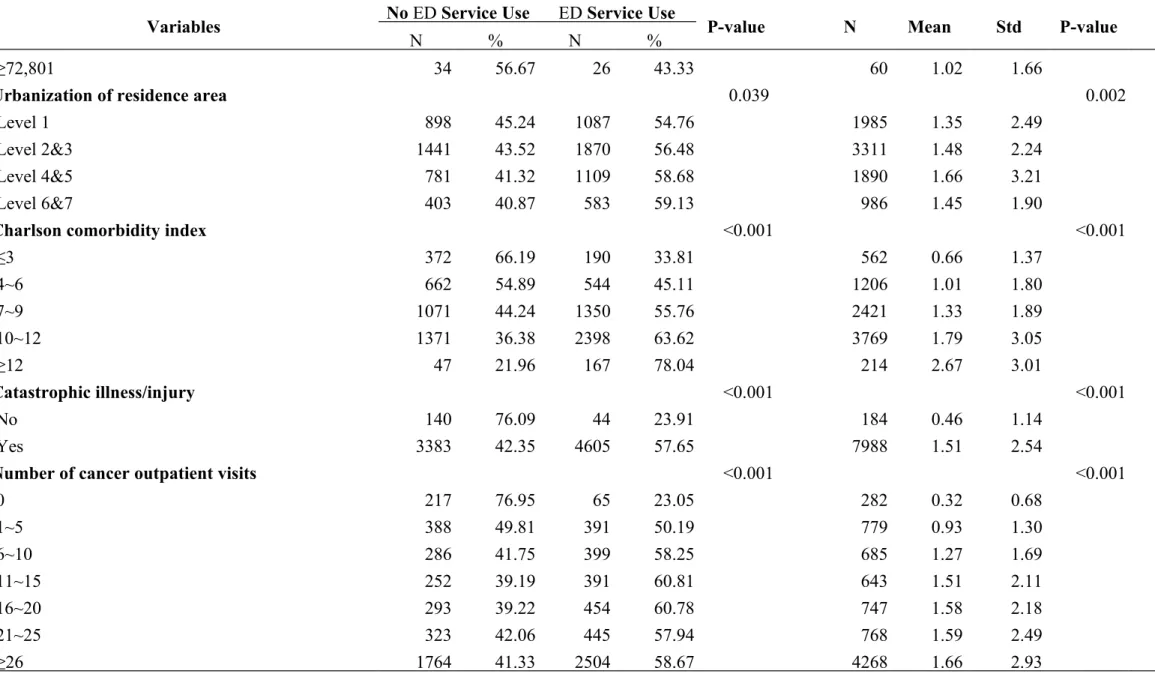
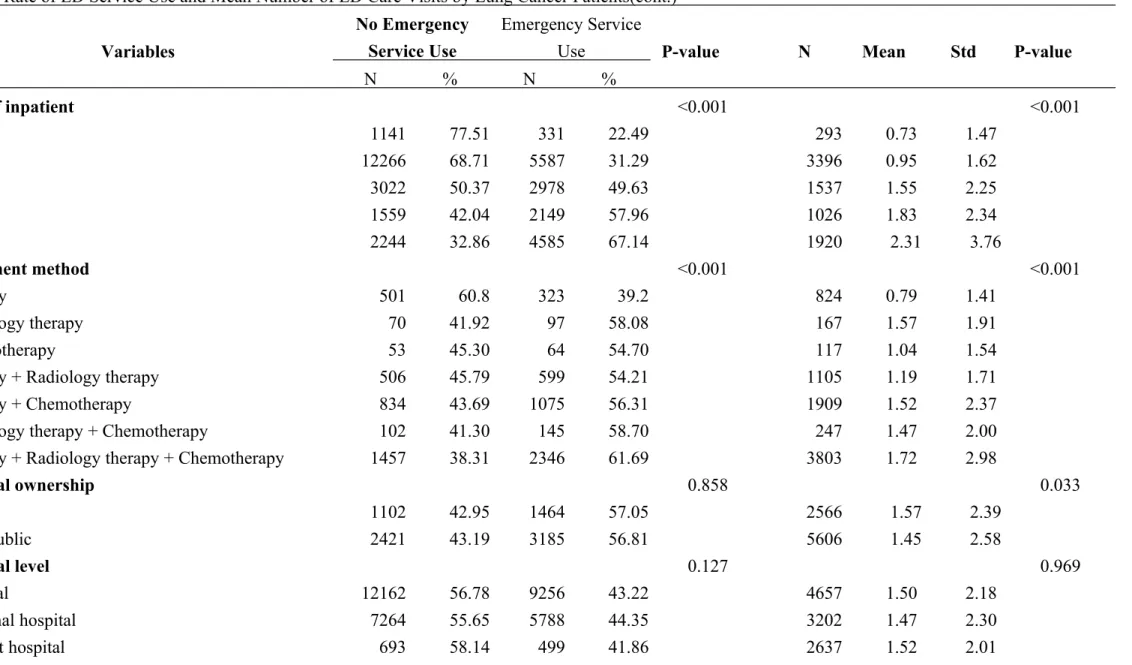
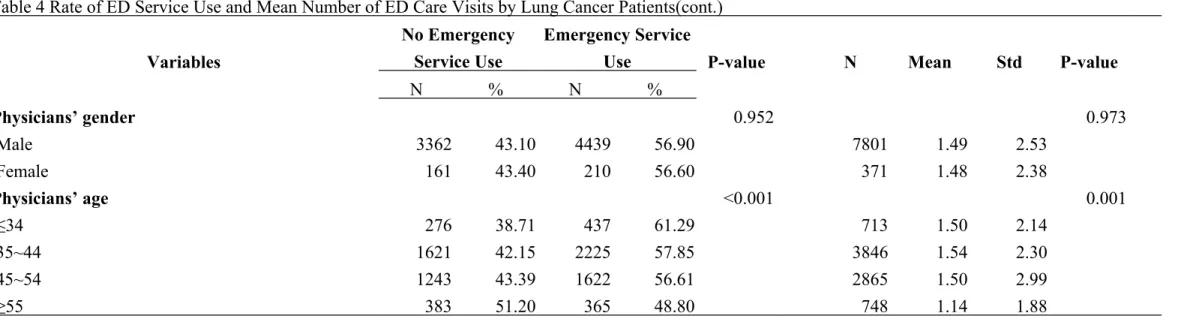
Table 4 shows comparisons of the ED care uses of MDT participants and non-MDT participants who had different demographic variables and treatment
characteristics. The results of the chi-square test showed that participants of different ages and MDT participation statuses did not have significant differences (P > 0.05) in ED service use. Patients who had higher percentages of ED service uses were male, with premium-based monthly salaries lower than NT$57,800, lower levels of urbanization of residence area, CCI greater than 7, catastrophic illnesses/injuries, greater number of cancer outpatient visits, longer LOS, and receiving the treatments of radiology therapy, radiology therapy + chemotherapy, and surgery + radiology therapy + chemotherapy. In addition, patients who are treated by physicians under 44 years of age have significantly higher percentages of ED service uses (P < 0.05).
Patients who have the following characteristics having greater mean numbers of ED service uses include non-MDT participants (mean = 1.53 ± 2.63), those between 25 and 34 years of age (mean = 2.37 ± 4.25), those at levels 4 and 5 in urbanization of residence area (mean = 1.66 ± 3.21), CCI greater than or equal to 12 (mean = 2.67 ± 3.01), those with catastrophic illnesses/injuries (mean = 1.51 ± 2.54), greater number of cancer outpatient visits (mean = 1.66 ± 2.93), longer LOS, and receiving surgery + radiology therapy + chemotherapy (mean = 1.72 ± 2.98). Patients who are treated at public hospitals have greater mean numbers of ED service uses (mean = 1.57 ± 2.39), and patients who are treated by physicians above 55 years of age have the smallest mean number of ED service uses (mean = 1.14 ± 1.88), which is significantly different compared with patients treated by other physicians (P < 0.05).
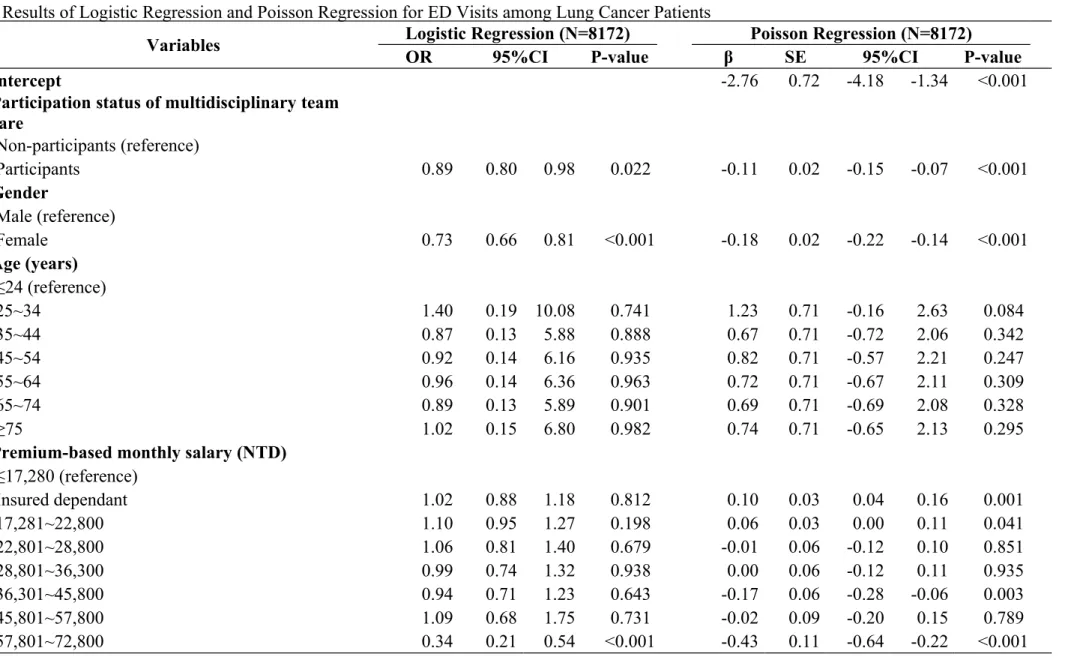
Table 5 shows the results of the logistic regression and Poisson regression that were performed on the variables. The results of the logistic regression show that MDT participants have a lower likelihood of seeking ED services (OR = 0.89; 95% CI: 0.80~0.98), which differs significantly compared with non-MDT participants (P = 0.022). Female patients are less likely to visit EDs compared with male patients (OR = 0.73; 95% CI: 0.66~0.81); patients with premium-based monthly salaries between NT$57,801 and NT$72,800, and higher than or equal to NT$72,800 are less likely to visit EDs compared with patients with premium-based monthly salaries lower than or
equal to NT$17,280 (OR = 0.34; 95% CI: 0.21~0.54; OR = 0.52; 95% CI: 0.30~0.91); patients with CCI between 4 and 6, between 7 and 9, between 10 and 12, and greater than or equal to 12 are more likely to visit EDs compared with patients with CCI smaller than or equal to 3 (OR = 1.60; 95% CI: 1.28~2.00; OR=2.62; 95% CI: 2.13~3.22; OR=3.70; 95% CI: 3.02~4.52; OR=7.82; 95% CI: 5.31~11.54); and patients with catastrophic illnesses/injuries are more likely to visit EDs compared with patients without catastrophic illnesses/injuries (OR = 2.94; 95% CI: 2.01~4.31). Patients receiving surgery + radiology therapy, surgery + chemotherapy, radiology therapy + chemotherapy, and surgery + radiology therapy + chemotherapy are more likely to visit EDs compared with patients receiving only surgeries (OR = 1.89; 95% CI: 1.54~2.32; OR=1.90; 95% CI: 1.57~2.30、OR=1.61; 95% CI:
1.17~2.22、OR=2.71; 95% CI: 2.25~3.28). Patients with more than one visit of outpatient and treated in district hospital, compared with medical center, are more likely to visit ED. Patients with longer LOS and treated by physicians over 35 years of age are less likely to visit ED. These differences are all statistically significant (P < 0.05).
The results of the Poisson regression showed that after controlling for the other variables, the MDT participants visited EDs fewer times compared with non-MDT participants (β = -0.09; 95% CI: -0.13~-0.05). Female patients visited EDs fewer
times compared with male patients (β = -0.18; 95% CI: -0.22~-0.14); patients who were insured dependents or with premium-based monthly salaries between
NT$17,281 and NT$22,800 visited EDs more times compared with patients with premium-based monthly salaries under or equal to NT$17,280 (β = 0.10; 95% CI: 0.04~0.16; and β = 0.06; 95% CI: 0.00~0.11), whereas patients with premium-based monthly salaries between NT$36,301 and NT$45,800, between NT$57,801 and NT$72,800, and higher than or equal to NT$72,801 visited EDs fewer times
compared with patients having premium-based monthly salaries lower than or equal to NT$17,280 (β = -0.17; 95% CI: -0.28~-0.06;β = -0.43; 95% CI: -0.64~-0.22;β = -0.42; 95% CI: -0.68~-0.17). Patients at levels 2&3 and 4&5 of urbanization of residence area visited EDs more times compared with patients at level 1 (the top level) of urbanization of residence area (β= 0.06; 95% CI: 0.01~0.11 and β= 0.16; 95% CI: 0.13~0.22). Patients with CCI between 4 and 6, between 7 and 9, between 10 and 12, and 12 or more visited EDs more times compared with patients with CCI smaller than or equal to 3 (β= 0.39; 95% CI: 0.27~0.50; β=0.65; 95% CI: 0.54~0.76; β=0.95; 95% CI: 0.85~1.06 ; and β=1.32; 95% CI: 1.19~1.45). Patients with
catastrophic illnesses/injuries visited EDs more times compared with patients without them (β= 0.63; 95% CI: 0.41~0.85). Patients receiving radiology therapy, surgery + radiology therapy, surgery + chemotherapy, radiology therapy + chemotherapy, and
surgery + radiology therapy + chemotherapy visited EDs more times compared with patients receiving only surgeries (β= 0.32; 95% CI: 0.18~0.47; β=0.34; 95% CI: 0.24~0.43;β= 0.52; 95% CI: 0.43~0.61; β= 0.26; 95% CI: 0.13~0.40; β= 0.66; 95% CI: 0.57~0.74). Patients receiving treatment at private hospitals visited EDs fewer times compared with patients receiving treatments at public hospitals (β= -0.11; 95% CI: -0.15~-0.06). Patients with more than one visit of outpatient and treated in
regional hospital and district hospital, compared with medical center, visited ED more times. Patients with longer LOS and treated by physicians above 45 years of age visited ED fewer times. These differences were all statistically significant (P < 0.05). Discussion
Regarding the effects of MDT participation on ED service uses, the results showed that MDT participants visited EDs fewer times compared with non-MDT participants. Although EDs can provide immediate care to relieve acute symptoms, cancer patients cannot receive proper and holistic care because ED rooms, which are frequently crowded and busy, are not satisfactory environments for providing cancer patient care.13 In conclusion, this study found that MDT participants use ED care less
frequently, indicating that MDT care reduces lung cancer patients’ needs to use ED services and implying that the MDT care improves the quality of cancer patient care.
25%), which differs from the most common cause (i.e., pain) identified in previous studies.13, 15, 19 This is possibly because various countries adopt different standards in
the timing and methods of prescribing anti-infectives and antipyretic and analgesic medication. Further analysis must be conducted to examine cancer patients’
medication dosage and uses. In Mayer et al.13 study in 2008, approximately 7.7% of
all kinds of cancer patients sought ED care, whereas 57% of the lung cancer patients in this study sought ED care. This is possibly because (a) this study examined the selected cancer patients’ ED service uses for the first year after they were diagnosed by physicians, whereas Mayer et al. investigated all cancer patients’ ED service uses during that year, which resulted in the substantial difference; or (b) the charge of ED service in Taiwan was inexpensive ($5 - 15 US dollars) compared to that in the United States.
Male patients use ED services more frequently compared with female patients, which is consistent with the results of previous studies.13, 20 Cancer patients with
catastrophic illnesses/injuries use ED services more frequently, which is consistent with the findings in the study conducted by Liu et al.16 in 2006. Patients with higher
CCI have more severe comorbidities and thus use medical services more frequently. Patients with more severe comorbidities are more likely to use ED services and use these services more frequently, which is a reasonable phenomenon. Patients with
higher salaries are less likely to use ED services and use their services less frequently compared with patients with lower salaries. This is possibly because patients with higher incomes are more capable of maintaining and enhancing the quality of the daily care they receive and are, therefore, less likely to require ED care. Patients residing in areas of low urbanization levels are more likely to use ED services and use these services more frequently compared with patients residing in areas of high urbanization levels. This indicates that patients’ access to medical services vary depending on the level of urbanization of the residence area. For treatment methods, patients receiving only surgeries use ED services less frequently compared with patients receiving other treatments, indicating that patients receiving only surgical treatments had relatively simple procedures or might have early diagnosis and were less likely to use ED. In addition, lung cancer patients receiving only chemotherapy use ED services less frequently, although the difference is not statistically significant. Patients receiving treatments at private hospitals and public hospitals do not
significantly differ regarding whether they seek ED care. However, patients receiving treatments at private hospitals visited EDs fewer times compared with patients
receiving treatments at public hospitals, indicating that patients receiving treatments at private hospitals have a lower demand for ED services. For physicians’
who are treated by senior physicians are less likely to use ED services and use these services less frequently. This indicates that physicians with more medical experience can reduce their patients’ urgent and unpredictable needs regarding receiving medical services.
Conclusion
This study found that lung cancer patients who participate in MDT care use ED services less frequently. EDs cannot provide cancer patients with holistic care.
Therefore, cancer patients should be provided with an MDT care to reduce their needs for ED services. In addition, patients participating in MDT are less likely to have urgent and unpredictable needs for medical care, indicating that MDT enhances the management quality of lung cancer patient care.
PSM is employed to reduce the selection bias resulted from varied patients’ characteristics in MDT participation. The matching is based on the variables including gender, age, premium-based monthly salary, urbanization of residence area, CCI, catastrophic illness/injury, treatment methods, hospital ownership, and physicians’ characteristics. However, we did not include certain factors that may have affected patients’ ED service uses, such as smoking and drinking habits, cancer staging, and type of lung cancer. These data types are difficult to obtain and constitute a limitation of this study. The results only showed the strong potential causation but not the direct
evidence.
This study found that the primary cause of lung cancer patients’ ED visits is fever, which differs from the findings of studies conducted in other countries. Future studies can be conducted to analyze the dosages of anti-infection and antipyretic and analgesic medication that physicians prescribe to lung cancer patients to elucidate the causes of the high frequency of fever in Taiwanese lung cancer patients.
Reference
1. Organization WH. CAUSES OF DEATH 2008 SUMMARY TABLES World Health Organization. Accessed Apr.5, 2012.
2. Department of Health EY. The Couse of Death Statistics in 2011 May 25, 2012 ed. ROC (Taiwan); 2011.
3. Price A, Kerr G, Gregor A. The impact of multidisciplinary teams and site specialisation on the use of radiotherapy in elderly people with non-small cell lung cancer (NSCLC) [abstract]. Radiother Oncol. 2002;64(suppl 1):S80.
4. Wang YH, Kung PT, Tsai WC, Tai CJ, Liu SA, Tsai MH. Effects of multidisciplinary care on the survival of patients with oral cavity cancer in Taiwan. Oral Oncol. Sep 2012;48(9):803-810.
5. Boxer MM, Vinod SK, Shafiq J, Duggan KJ. Do multidisciplinary team meetings make a difference in the management of lung cancer? Cancer. Nov 15
2011;117(22):5112-5120.
6. Gabel M, Hilton NE, Nathanson SD. Multidisciplinary breast cancer clinics. Do they work? Cancer. Jun 15 1997;79(12):2380-2384.
7. Coory M, Gkolia P, Yang IA, Bowman RV, Fong KM. Systematic review of multidisciplinary teams in the management of lung cancer. Lung Cancer. Apr 2008;60(1):14-21.
8. Forrest LM, McMillan DC, McArdle CS, Dunlop DJ. An evaluation of the impact of a multidisciplinary team, in a single centre, on treatment and survival in patients with inoperable non-small-cell lung cancer. Br J Cancer. Oct 31 2005;93(9):977-978.
9. Westin T, Stalfors J. Tumour boards/multidisciplinary head and neck cancer meetings: are they of value to patients, treating staff or a political additional drain on healthcare resources? Curr Opin Otolaryngol Head Neck Surg. Apr 2008;16(2):103-107.
10. Birchall M, Bailey D, King P. South West Cancer Intelligence Service Head and Neck Tumour Panel. Effect of process standards on survival of patients with head and neck cancer in the south and west of England. Br J Cancer.
2004;91:1477-1481.
11. Chen YR, Yang Y, Wang SC, et al. Effectiveness of multidisciplinary care for chronic kidney disease in Taiwan: a 3-year prospective cohort study. Nephrol Dial Transplant. Mar 2013;28(3):671-682.
12. Barbera L, Paszat L, Chartier C. Indicators of poor quality end-of-life cancer care in Ontario. Journal of Palliative Care. Spring 2006;22(1):12-17.
Carolina. J Clin Oncol. Jul 1 2011;29(19):2683-2688.
14. Ministry of Health and Welfare EY. The Medical Statictical Annual Report in 2012. Jan 28, 2014 ed. ROC (Taiwan); 2014.
15. Barbera L, Taylor C, Dudgeon D. Why do patients with cancer visit the emergency department near the end of life? CMAJ. Apr 6 2010;182(6):563-568.
16. Gorham J, Ameye L, Berghmans T, Sculier JP, Meert AP. The lung cancer patient at the emergency department: a three-year retrospective study. Lung Cancer. May 2013;80(2):203-208.
17. Liu CY, Hung,Y.T., Chuang, Y.L.,Chen, Y.J., Weng, W.S., Liu, J.S., Liang, K.Y. Incorporating Development Stratification of Taiwan Townships into Sampling Design of Large Scale Health Interview Survey. Journal of Health
Management. 2006;4(1):1-22.
18. Deyo R CD, Ciol M. Adapting a clinical Comorbidity index for use with ICD-9-CM administrative database. J Clin Epidemiol. 1992;45:613–619.
19. Tsai SC, Liu, L.N., Tang, S. T., Chen, J. C. &Chen, M.L. Cancer pain as the presenting problem in emergency departments: incidence and related factors. Support Care Cancer. 2010;18:57-65.
20. Yucel N, Sukru Erkal H, Sinem Akgun F, Serin M. Characteristics of the admissions of cancer patients to emergency department. J BUON. Jan-Mar 2012;17(1):174-179.
Table 1 The numbers of Lung cancer patients in different year before and after PS matching
Variables
Before PS matching After 1:2 PS matching
Total Non-MDT MDT Total Non-MDT MDT
N % N % N % N % N % N % Total 22817 99.99 20081 88.01 2736 11.99 8172 100.00 5448 66.67 2724 33.33 Year 2005 7309 32.03 6347 86.84 962 13.16 2690 32.92 1733 64.42 957 35.58 2006 7501 32.87 6559 87.44 942 12.56 2750 33.65 1813 65.93 937 34.07 2007 8007 35.09 7175 89.61 832 10.39 2732 33.43 1902 69.62 830 30.38
Table2 Demographic and Relative Variables Before and After Propensity Score Matching for Lung Cancer Patients (2005-2007) Variables
Before PS matching (N=22817) After 1:2 PS matching (N=8172) Non-participants Participants
P-value Non-participants Participants P-value
N % N % N % N % Gender 0.017 0.412 Male 13044 88.4 1713 11.6 3470 67.0 1709 33.0 Female 7036 87.3 1023 12.7 1978 66.1 1015 33.9 Missing 1 - - - -Age (years) <0.001 0.728 ≤24 89 89.0 11 11.0 3 60.0 2 40.0 24~34 130 86.1 21 13.9 39 65.0 21 35.0 34~44 719 85.7 120 14.3 199 62.4 120 37.6 44~54 2313 84.0 442 16.0 904 67.2 442 32.8 54~64 3559 85.3 615 14.7 1211 66.3 615 33.7 64~74 5650 86.9 854 13.1 1755 67.3 851 33.7 >74 7621 91.9 673 8.1 1337 66.5 673 33.5
Mean of age (mean ± std) 68.02 ±12.75 64.56 ±12.11 64.85 ±12.04 64.56 ±12.11
Premium-based monthly salary(in NT$) <0.001 0.977
Insured dependant 6196 88.5 802 11.5 1593 66.8 793 33.2 ≤17280 5008 91.3 480 8.8 959 66.6 480 33.4 17281~22800 6547 86.0 1069 14.0 2177 67.1 1066 32.9 22801~28800 627 85.3 108 14.7 193 64.1 108 35.9 28801~36300 496 84.2 93 15.8 171 64.8 93 35.2 36301~45800 614 85.8 102 14.3 200 66.2 102 33.8 45801~57800 195 87.1 29 13.0 60 64.7 29 32.6 57801~72800 216 87.1 32 12.9 56 63.6 32 36.4 ≥72,801 182 89.7 21 10.3 39 65.0 21 35.0
Table2 Demographic and Relative Variables Before and After Propensity Score Matching for Lung Cancer Patients (2005-2007) (cont.) Variables
Before PS matching (N=22817) After 1:2 PS matching (N=8172) Non-participants Participants
P-value Non-participants Participants P-value
N % N % N % N %
Urbanization of residence area <0.001 0.519
Level 1 5323 88.6 686 11.4 1299 65.4 686 34.6
Level 2&3 8788 89.0 1089 11.0 2222 67.1 1089 32.9
Level 4&5 3911 86.1 632 13.9 1258 66.6 632 33.4
Level 6&7 1992 86.2 320 13.8 669 67.6 317 32.2
Missing 67 - 9 - - - -
-Charlson comorbidity index 0.003 0.485
≤3 15016 88.1 2023 11.9 4112 67.1 2014 32.9 4~6 327 86.5 51 13.5 88 63.3 51 36.7 7~9 2665 88.8 336 11.2 641 65.7 335 34.3 10~12 87 95.6 4 4.4 4 50.0 4 50.0 ≥13 1986 86.1 322 14.0 603 65.3 320 34.7 Catastrophic illness/injury 0.006 0.317 Without 16371 87.7 2290 12.3 4610 66.9 2281 33.1 With 3710 89.3 446 10.7 838 65.4 443 34.6 Treatment methods <0.001 0.682 Surgery 7605 96.5 275 3.5 550 66.6 274 33.3 Radiology therapy 388 86.4 61 13.6 107 64.1 60 35.9 Chemotherapy 440 91.1 43 8.9 75 64.1 42 35.9
Surgery + Radiology therapy 2398 86.5 374 13.5 731 66.2 374 33.9
Surgery + Chemotherapy 4578 88.0 625 12.0 1284 67.3 625 32.7
Surgery + Radiology therapy + Chemotherapy 4410 77.8 1261 22.2 2548 67.0 1255 33.0
Other 1 100.0 0 0.0 0 0.0 0 0.0
Table 3 The Top 20 Leading Causes of ED Care Visits among Lung Cancer Patients by MDT Participation Status
Non-MDT Participants (N=5448) MDT Participants (N=2724)
Ranking Symptoms Total
Number % Ranking Symptoms
Total
Number %
1 Fever 684 23.97 1 Fever 433 25.46
2 Dyspnea and respiratory abnormalities 386 13.53 2 Dyspnea and respiratory abnormalities 225 13.23
3 Chest pain 291 10.20 3 Abdominal pain 170 9.99
4 Abdominal pain 268 9.39 4 Chest pain 135 7.94
5 Dizziness and giddiness 214 7.50 5 Dizziness and giddiness 122 7.17
6 Nausea and vomiting 194 6.80 6 Nausea and vomiting 119 7.00
7 Malaise and fatigue 121 4.24 7 Malaise and fatigue 88 5.17
8 Hemoptysis 120 4.21 8 Hemoptysis 56 3.29
9 Headache 76 2.66 9 General symptoms 49 2.88
10 Cough 64 2.24 10 Retention of urine 36 2.12
11 Sleep disturbances 62 2.17 11 Headache 34 2.00
12 Alteration of consciousness 50 1.75 12 Convulsions 29 1.70
13 Retention of urine 46 1.61 13 Sleep disturbances 29 1.70
14 Edema 35 1.23 14 Syncope and collapse 20 1.18
15 Shock without mention of trauma 29 1.02 15 Edema 18 1.06
16 Syncope and collapse 25 0.88 16 Cough 18 1.06
17 Palpitations 20 0.70 17 Palpitations 11 0.65
18 Other symptoms involving digestive
system 19 0.67 18
Other symptoms involving nervous and
musculoskeletal systems 10 0.59
system
Table 4 Rate of ED Service Use and Mean Number of ED Care Visits by Lung Cancer Patients
Variables No ED Service Use ED Service Use P-value N Mean Std P-value
N % N % Participation status of MDT 0.167 0.024 Non-participants 2319 42.57 3129 57.43 5448 1.53 2.63 Participants 1204 44.20 1520 55.80 2724 1.40 2.29 Gender <0.001 <0.001 Male 2109 40.72 3070 59.28 5179 1.57 2.76 Female 1414 47.24 1579 52.76 2993 1.34 2.05 Age (years) 0.506 0.026 ≤24 3 60 2 40 5 0.40 0.55 25~34 20 33.33 40 66.67 60 2.37 4.25 35~44 145 45.45 174 54.55 319 1.33 1.88 45~54 599 44.5 747 55.5 1346 1.54 3.48 55~64 773 42.33 1053 57.67 1826 1.50 2.32 65~74 1114 42.75 1492 57.25 2606 1.53 2.47 ≥75 869 43.23 1141 56.77 2010 1.38 1.97
Mean of age (mean ± std) 64.66 ±12.07 64.82 ±12.06 8172 64.75 ±12.06
Premium-based monthly salary (NTD) <0.001 0.148
Insured dependant 1043 43.71 1343 56.29 2386 1.53 2.64 ≤17,280 640 44.48 799 55.52 1439 1.38 2.01 17,281~22,800 1331 41.04 1912 58.96 3243 1.55 2.78 22,801~28,800 134 44.52 167 55.48 301 1.37 2.25 28,801~36,300 118 44.7 146 55.3 264 1.46 1.96 36,301~45,800 129 42.72 173 57.28 302 1.32 1.84 45,801~57,800 37 41.57 52 58.43 89 1.53 2.29 57,801~72,800 57 64.77 31 35.23 88 1.07 2.09
Table 4 Rate of ED Service Use and Mean Number of ED Care Visits by Lung Cancer Patients(cont.)
Variables No ED Service Use ED Service Use P-value N Mean Std P-value
N % N %
≥72,801 34 56.67 26 43.33 60 1.02 1.66
Urbanization of residence area 0.039 0.002
Level 1 898 45.24 1087 54.76 1985 1.35 2.49
Level 2&3 1441 43.52 1870 56.48 3311 1.48 2.24
Level 4&5 781 41.32 1109 58.68 1890 1.66 3.21
Level 6&7 403 40.87 583 59.13 986 1.45 1.90
Charlson comorbidity index <0.001 <0.001
≤3 372 66.19 190 33.81 562 0.66 1.37 4~6 662 54.89 544 45.11 1206 1.01 1.80 7~9 1071 44.24 1350 55.76 2421 1.33 1.89 10~12 1371 36.38 2398 63.62 3769 1.79 3.05 ≥12 47 21.96 167 78.04 214 2.67 3.01 Catastrophic illness/injury <0.001 <0.001 No 140 76.09 44 23.91 184 0.46 1.14 Yes 3383 42.35 4605 57.65 7988 1.51 2.54
Number of cancer outpatient visits <0.001 <0.001
0 217 76.95 65 23.05 282 0.32 0.68 1~5 388 49.81 391 50.19 779 0.93 1.30 6~10 286 41.75 399 58.25 685 1.27 1.69 11~15 252 39.19 391 60.81 643 1.51 2.11 16~20 293 39.22 454 60.78 747 1.58 2.18 21~25 323 42.06 445 57.94 768 1.59 2.49 ≥26 1764 41.33 2504 58.67 4268 1.66 2.93
Table 4 Rate of ED Service Use and Mean Number of ED Care Visits by Lung Cancer Patients(cont.) Variables
No Emergency Service Use
Emergency Service
Use P-value N Mean Std P-value
N % N % LOS of inpatient <0.001 <0.001 0~15 1141 77.51 331 22.49 293 0.73 1.47 15~30 12266 68.71 5587 31.29 3396 0.95 1.62 31~45 3022 50.37 2978 49.63 1537 1.55 2.25 46~60 1559 42.04 2149 57.96 1026 1.83 2.34 ≥61 2244 32.86 4585 67.14 1920 2.31 3.76 Treatment method <0.001 <0.001 Surgery 501 60.8 323 39.2 824 0.79 1.41 Radiology therapy 70 41.92 97 58.08 167 1.57 1.91 Chemotherapy 53 45.30 64 54.70 117 1.04 1.54
Surgery + Radiology therapy 506 45.79 599 54.21 1105 1.19 1.71
Surgery + Chemotherapy 834 43.69 1075 56.31 1909 1.52 2.37
Radiology therapy + Chemotherapy 102 41.30 145 58.70 247 1.47 2.00
Surgery + Radiology therapy + Chemotherapy 1457 38.31 2346 61.69 3803 1.72 2.98
Hospital ownership 0.858 0.033 Public 1102 42.95 1464 57.05 2566 1.57 2.39 Non-public 2421 43.19 3185 56.81 5606 1.45 2.58 Hospital level 0.127 0.969 Medical 12162 56.78 9256 43.22 4657 1.50 2.18 Regional hospital 7264 55.65 5788 44.35 3202 1.47 2.30 District hospital 693 58.14 499 41.86 2637 1.52 2.01
Clinics 113 56.50 87 43.50 50 1.46 1.93
Table 4 Rate of ED Service Use and Mean Number of ED Care Visits by Lung Cancer Patients(cont.) Variables
No Emergency Service Use
Emergency Service
Use P-value N Mean Std P-value
N % N % Physicians’ gender 0.952 0.973 Male 3362 43.10 4439 56.90 7801 1.49 2.53 Female 161 43.40 210 56.60 371 1.48 2.38 Physicians’ age <0.001 0.001 ≤34 276 38.71 437 61.29 713 1.50 2.14 35~44 1621 42.15 2225 57.85 3846 1.54 2.30 45~54 1243 43.39 1622 56.61 2865 1.50 2.99 ≥55 383 51.20 365 48.80 748 1.14 1.88
Table 5 Results of Logistic Regression and Poisson Regression for ED Visits among Lung Cancer Patients
Table 5 Results of Logistic Regression and Poisson Regression for ED Visits among Lung Cancer Patients(cont.)
Variables Logistic Regression (N=8172) Poisson Regression (N=8172)
OR 95%CI P-value β SE 95%CI P-value
Intercept -2.76 0.72 -4.18 -1.34 <0.001
Participation status of multidisciplinary team care Non-participants (reference) Participants 0.89 0.80 0.98 0.022 -0.11 0.02 -0.15 -0.07 <0.001 Gender Male (reference) Female 0.73 0.66 0.81 <0.001 -0.18 0.02 -0.22 -0.14 <0.001 Age (years) ≤24 (reference) 25~34 1.40 0.19 10.08 0.741 1.23 0.71 -0.16 2.63 0.084 35~44 0.87 0.13 5.88 0.888 0.67 0.71 -0.72 2.06 0.342 45~54 0.92 0.14 6.16 0.935 0.82 0.71 -0.57 2.21 0.247 55~64 0.96 0.14 6.36 0.963 0.72 0.71 -0.67 2.11 0.309 65~74 0.89 0.13 5.89 0.901 0.69 0.71 -0.69 2.08 0.328 ≥75 1.02 0.15 6.80 0.982 0.74 0.71 -0.65 2.13 0.295
Premium-based monthly salary (NTD) ≤17,280 (reference) Insured dependant 1.02 0.88 1.18 0.812 0.10 0.03 0.04 0.16 0.001 17,281~22,800 1.10 0.95 1.27 0.198 0.06 0.03 0.00 0.11 0.041 22,801~28,800 1.06 0.81 1.40 0.679 -0.01 0.06 -0.12 0.10 0.851 28,801~36,300 0.99 0.74 1.32 0.938 0.00 0.06 -0.12 0.11 0.935 36,301~45,800 0.94 0.71 1.23 0.643 -0.17 0.06 -0.28 -0.06 0.003 45,801~57,800 1.09 0.68 1.75 0.731 -0.02 0.09 -0.20 0.15 0.789 57,801~72,800 0.34 0.21 0.54 <0.001 -0.43 0.11 -0.64 -0.22 <0.001
Variables Logistic Regression (N=8172) Poisson Regression (N=8172)
OR 95%CI P-value β SE 95%CI P-value
≥72,801 0.52 0.30 0.91 0.022 -0.42 0.13 -0.68 -0.17 0.001
Urbanization of residence area Level 1 (reference)
Level 2&3 1.00 0.88 1.13 0.988 0.06 0.02 0.01 0.11 0.016
Level 4&5 1.06 0.91 1.24 0.430 0.16 0.03 0.10 0.22 <0.001
Level 6&7 1.07 0.89 1.29 0.479 0.03 0.04 -0.04 0.10 0.361
Charlson comorbidity index ≤3 (reference) 4~6 1.60 1.28 2.00 <0.001 0.39 0.06 0.27 0.50 <0.001 7~9 2.62 2.13 3.22 <0.001 0.65 0.06 0.54 0.76 <0.001 10~12 3.70 3.02 4.52 <0.001 0.95 0.05 0.85 1.06 <0.001 ≥12 7.82 5.31 11.54 <0.001 1.32 0.07 1.19 1.45 <0.001 Catastrophic illness/injury No (reference) Yes 2.94 2.01 4.31 <0.001 0.63 0.11 0.41 0.85 <0.001 Treatment method Surgery (reference) Radiology therapy 1.42 0.99 2.04 0.058 0.32 0.07 0.18 0.47 <0.001 Chemotherapy 1.29 0.85 1.95 0.237 -0.09 0.10 -0.28 0.11 0.382
Surgery + radiology therapy 1.89 1.54 2.32 <0.001 0.34 0.05 0.24 0.43 <0.001
Surgery + chemotherapy 1.90 1.57 2.30 <0.001 0.52 0.05 0.43 0.61 <0.001
Radiology therapy + chemotherapy 1.61 1.17 2.22 0.003 0.26 0.07 0.13 0.40 <0.001 Surgery + radiology therapy + chemotherapy 2.71 2.25 3.28 <0.001 0.66 0.04 0.57 0.74 <0.001
Table 5 Results of Logistic Regression and Poisson Regression for ED Visits among Lung Cancer Patients(cont.)
Variables Logistic Regression (N=8172) Poisson Regression (N=8172)
OR 95%CI P-value β SE 95%CI P-value
Number of cancer outpatient visits 0 (reference) 1~5 2.55 1.83 3.54 <0.001 0.73 0.11 0.51 0.95 <0.001 6~10 3.01 2.15 4.23 <0.001 0.90 0.11 0.68 1.12 <0.001 11~15 3.16 2.24 4.45 <0.001 1.03 0.11 0.81 1.25 <0.001 16~20 3.16 2.25 4.42 <0.001 1.07 0.11 0.85 1.29 <0.001 21~25 2.53 1.80 3.54 <0.001 1.02 0.11 0.80 1.24 <0.001 ≥26 2.24 1.64 3.06 <0.001 0.99 0.11 0.77 1.20 <0.001 LOS of inpatient 0~15 (reference) 15~30 0.51 0.45 0.57 <0.001 -0.46 0.02 -0.50 -0.42 <0.001 31~45 0.38 0.33 0.44 <0.001 -0.66 0.03 -0.72 -0.60 <0.001 46~60 0.27 0.22 0.33 <0.001 -1.01 0.05 -1.11 -0.92 <0.001 ≥61 0.18 0.15 0.22 <0.001 -1.24 0.05 -1.33 -1.15 <0.001 Hospital ownership Public (reference) Non-public 1.00 0.90 1.12 0.953 -0.11 0.02 -0.15 -0.06 <0.001 Hospital level
Medical center (reference)
Regional hospital 0.94 0.84 1.05 0.250 0.07 0.02 0.03 0.11 0.001
District hospital 1.41 1.06 1.88 0.018 0.27 0.05 0.17 0.37 <0.001
Clinics 0.96 0.52 1.78 0.908 0.08 0.12 -0.15 0.31 0.497
Physicians’ gender Male (reference)
Female 1.04 0.83 1.31 0.716 0.10 0.04 0.01 0.19 0.024 Table 5 Results of Logistic Regression and Poisson Regression for ED Visits among Lung Cancer Patients(cont.)
Variables Logistic Regression (N=8172) Poisson Regression (N=8172)
OR 95%CI P-value β SE 95%CI P-value
Physicians’ age ≤34 (reference)
35~44 0.76 0.64 0.91 0.003 -0.04 0.03 -0.10 0.03 0.287
45~54 0.70 0.59 0.85 <0.001 -0.07 0.04 -0.14 0.00 0.045
≥55 0.59 0.47 0.74 <0.001 -0.21 0.05 -0.30 -0.12 <0.001