Diagnosis of Severe Obstructive Sleep Apnea with Model
Designed Using Genetic Algorithm and Ensemble Support
Vector Machine
Liang-Wen Hang
1,ǂ, Hsuan-Hung Lin
2,ǂ, John Y. Chiang
3, Hsiang-Ling Wang
4and
Yung-Fu Chen
5,6,7,*1Sleep Medicine Center, Department of Internal Medicine, China Medical University Hospital, 40402 Taichung, Taiwan 2Dept. of Management Info. Systems, Central Taiwan University of Science and Technology, 40601 Taichung, Taiwan 3Dept. of Computer Science and Engineering, National Sun Yat-sen University, 80424 Kaohsiung,
Taiwan
4Dept. of Beauty Science, National Taichung University of Science and Technology, 40343 Taichung, Taiwan 5Dept. of Healthcare Administrations and 6Institute of Biomedical Engineering and Material Science, Central Taiwan
University of Science and Technology, 40601 Taichung, Taiwan
7Dept. of Health Services Administrations, China Medical University, 40402 Taichung, Taiwan
*Corresponding author: Email: [email protected]. ǂAuthors contributed equally to this work.
Received Nov. 25, 2011; Revised Jan. 8, 2012; Accepted Jan. 31, 2012 Published online: 2012
Abstract: Obstructive sleep apnea (OSA) is a general sleep disorder and is a significant cause of
motor vehicle crashes and chronic diseases. The severity of the respiratory events is measured by the frequency and duration of apneas and hypopneas per hour of sleep, namely apnea-hypopnea index (AHI), using polysomnography (PSG). Suspected patients can be classified as normal (AHI<5), mild (5AHI<15), moderate (15AHI<30), and severe (AHI30). Although PSG is treated as the gold standard for the diagnosis of OSA, its shortcoming includes technical expertise is required and timely access is restricted. Thus, home pulse oximetry has been proposed as a valuable and effective tool for screening patients with OSA. Support vector machine (SVM) is believed to be more efficient than neural network and traditional statistical-based classifiers. Nonetheless, it is critical to determine suitable parameters to increase classification performance. Furthermore, an ensemble of SVM classifiers use multiple models to obtain better predictive accuracy and are more stable than models consist of a single model. Genetic algorithm (GA), on the other hand, is able to find optimal solution within an acceptable time, and is faster than dynamic programming with exhaustive searching strategy. By taking the advantage of GA in quickly selecting the salient features and adjusting SVM parameters, it was combined with ensemble SVM to design a clinical decision support system (CDSS) for the diagnosis of patients with severe OSA, and then followed by PSG to further discriminate normal, mild and moderate patients. The results show that ensemble SVM classifiers demonstrate better diagnosing performance than models consisting of a single SVM model and logistic regression analysis. Additionally, the oximetry/PSG diagnostic scheme was shown to have higher cost-effectiveness in the diagnosis of OSA patients with an average cost ratio of 0.66 and an average waiting time ratio of 0.40 compared to the traditional scheme with PSG examination only.
Keywords: Obstructive Sleep Apnea, Polysomnography, Oximetry, Ensemble Classifier, Cost-Effectiveness Analysis
1 Introduction
Obstructive sleep apnea (OSA) is a general sleep disorder and is commonly seen in 24% of men and 9% of women [1]. Among them, up to 93% of women and 82% of men have not been diagnosed
[2]. It is a significant cause of motor vehicle crashes resulting in an increased risk of 2-7 folds [3] and causes of several chronic diseases, such as metabolic syndrome [4], chronic hyperventilation © 2012 NSP
@ 2102
PSN
roC gnihsilbuP secneicS larutaN.
syndrome and upper chest breathing pattern disorders [5], bronchial inflammation [6], personality change and intellectual impairment [7], and erectile dysfunction [8]. OSA was also reported to be related to cognitive deficits, vigilance alteration, and attentional decline [9], as well as obstructive pulmonary disease, neuromuscular disease, poliomyelitis, obesity, cardiovascular disease, and cranio-facial anomalies [5,10].
The severity of the respiratory events is measured by the frequency and duration of apneas and hypopneas per hour of sleep, namely apnea-hypopnea index (AHI), using polysomnography (PSG). Suspected patients with AHI smaller than 5 are considered as normal, while those with AHI>5 can be further classified into mild (AHI15), moderate (15<AHI30), and severe (AHI>30). The patients with AHI between 15 and 30 and greater than 30 are diagnosed as moderate and severe, respectively. PSG is treated as the gold standard for the diagnosis of OSA; however, it has several limitations, such as technical expertise is required and timely access is restricted [11]. Thus, home pulse oximetry has been proposed as a valuable and effective tool for screening patients with OSA; nonetheless, it’s efficacy in OSA diagnosis has been debated for several years [12]. Recently, a comprehensive evaluation of representative oxyhemoglobin indices for predicting severity of OSA was reported [13]. It showed that ODI had a better diagnostic performance than the time domain and frequency domain indices in diagnosing severity of OSA with sensitivity/specificity achieving 84.0%/84.3% in AHI>15/h and 87.8%/96.6% in AHI>30/h, respectively [13].
In this study, not only the ODI, parameters obtained from questionnaire and anthropometric were also adopted for designing a clinical decision support system with genetic algorithm (GA) and ensemble support vector machine (SVM) used to predictive and diagnose severity of OSA patients.
Clinical decision support system (CDSS) provides domain knowledge and relevant supportive information to enhance diagnostic performance and to improve healthcare quality in clinical setting. Three key points were identified and proposed to achieve the goal of enhancing healthcare quality: best knowledge available when needed, high adoption and effective use, and continuous improvement of knowledge and CDS methods [14].
Several CDSSs have been developed for clinical applications in the past two decades. Garg et al., [15] reported that 64% of the 97 proposed CDSS
applications, including 10 diagnostic systems, 21 reminder systems, 37 disease management systems, and 29 drug-dosing or prescribing systems, demonstrated improved outcomes in medical practitioner performance. Recently, it was shown that CDSSs have been effectively applied in the diagnoses of lower back pain [16], otological disease [17], cardiovascular disease [18], and cancer using endoscopic images [19]; managements and cares of chronic heart failure [20] and chronic kidney failure [21]; management of operational risk in hemodialysis [22]; and care of patients who received mechanical ventilation [23, 24], prediction of successful ventilation weaning [25], and outcome prediction of diabetic control of ICU patents [26]. An appropriate CDSS can highly increase patient safety, improve healthcare quality, and reduce cost.
In this study, a CDSS integrating genetic algorithm and ensemble support vector machine was designed to select salient features and to construct the model for the diagnosis of patients with severe OSA. With its great sensitivity, most of the severe OSA patients can be diagnosed with the CDSS. More expensive PSG examinations were then used to diagnose the undetermined non-severe patients into normal, mild, and moderate. The strategy of applying oximetry test followed by PSG examination (oximetry/PSG scheme) demonstrates to have better cost-effectiveness than the traditional PSG scheme.
2
Ensemble ClassifiersThe
support vector machine (SVM) is a supervised learning method widely used for classification. It is a powerful methodology for solving problems in nonlinear classification, function estimation, and density estimation, leading to many applications including image interpretation, data mining, biometric authentication, biotechnological investigation, and clinical diagnosis. [27-30].In general, SVM has better performance when competed with other existing methods, such as neural networks and decision trees [31-33]. The goal of SVM is to separate multiple clusters with a set of unique hyperplanes having greatest margins to the boundary, consisted of support vectors, of each cluster. In contrast, each hyperplane which separates two clusters is not unique for other linear classifiers. Given a two-class linearly separable problem, the hyperplane separating two classes
leaving the maximum margin from both classes is represented as [34]: 0 ) ( w0 g x wTx (1) in which w indicates the weights of the input vector x and w0 is a bias term of the hyperplane. The training data of two classes can be represented as (xi, yi) with xiRn and yi{+1,-1} for i=1,2,…N, in
which sample xi is an N-dimensional input vector
and yi is its corresponding label indicating the class
of xi. By scaling the orthogonal vector w and bias
w0 in Eq. (1) to make the values of g(x) at the nearest points in class 1 and class 2 equal to 1 and -1, respectively, the problem of obtaining the optimal hyperplane becomes a nonlinear quadratic optimization problem, as expressed in the following equation: N i w y i T i w 2 , Subject to ( ) 1, 1,2,..., Min 0 2 , 0 x w w w (2)
The problem can be solved by considering Lagrangian duality and stated equivalently by its Wolfe dual representation form with the constraints satisfying the Karush-Kuhn-Tucker (KKT) conditions, i.e. L(w w, 0,λ)/w0, 0 / ) , , ( 0 0 L w w λ w , 0 ] 1 ) ( [y T i w0 i i w x , and N i i 0for 1,... , as indicated in the following equation.
N i i T i i y w w L 1 0 2 0 [ ( )-1] 2 ) , , ( Max w λ w w x (3a)N
i
λ
y
y
N i i i i N i i i i,...,
1
for
0
and
,
0
,
Subject to
1 1
x
w
(3b)where L(w,w0,λ) is a Lagrangian function and
λ=[λ1,λ2,…λN] is the vector of Lagrangian multipliers corresponding to the constraint in Eq. (2). In contrast to Eq. (2), the first two constraints in Eq. (3b) become equality constraints and make the problem easier to handle. By substituting the first two constraints in (3b) into (3a), the problem is formulated as: N i y y y N i i i i N j i j T i j i j i N i i ,... 1 , 0 with 0 Subject to ), 2 1 ( Max 1 1 , 1
x x λ (4)As soon as the Lagrangian multipliers have been obtained by maximizing the above equation, the optimal hyperplane can be obtained from
iN1 iyixi
w
shown in Eq. (3b). And then, classification of a sample is performed based on the sign of the following equation:) sgn( ) sgn( ) ( w0 1 y w0 f iNs i T i i i T w x
x x x
(5)where Ns is the number of support vectors.
For a nonlinear classification problem, the optimization problem shown in Eq. (2) is changed to Eq. (6) with a penalty term being added:
N i w y C i i i T i N i i w ,..., 2 , 1 0, and , -1 ) ) ( ( Subject to , ) 2 ( Min 0 1 2 , 0
x w w w (6)where C is a positive penalty parameter, variables ξi
are used to weight the cost of misclassified samples, and (xi) is a function applied to map the training
sample xi to a higher dimensional space. For a vector xRn in the original feature space, it is
assumed that there exists a function for mapping
xRn to (x)Rk with k > n. Then, the class of a
sample can be determined from the following equation: ] ) ( ) ( sgn[ ] ) ( sgn[ ) ( w0 1 y w0 f iNs T i i i T w x
x x x
(7) in which (x)T(xi) is the inner product needed for
calculation, which is performed by a kernel function
K(x,z)= (x)T(z) which is a symmetric function
satisfying the following condition:
K(x,z)g(z)dxdz 0, and g(x)2dx(8)
Finally, the optimization problem in Eq. (4) is reformulated as:
N i i i i N j i j T i j i j i N i i C λ y K y y 1 1 , 1 0 with 0 Subject to ), ) ( 2 1 ( Max x x λ (9)Various kernels including polynomial, radial basis function, and hyperbolic tangent can be used for mapping the original sample space into a new Euclidian space with Mercer’s conditions are satisfied for designing a nonlinear classifier. The linear classifier can then be designed for classification. Among them, radial basis function, as shown in the following equation, is the most widely used function and will be applied in this study for feature mapping. ) exp( ) , (x z xz 2 K (10)
Ensemble Classifiers In machine learning,
ensemble methods use multiple models to obtain better predictive accuracy and are more stable than models consist of a single model [35-37]. Dietterich [38] showed that the outcome of the ensemble classifier generally outperform the single model when multiple weak models were combined. The reasons causing such an improved performance might be: (1) if there are several different optimal hypotheses exist and the ensemble methods can reduce the risk of choosing a wrong hypothesis; (2) a single machine learning algorithm may end up in local optima, by contrast, the ensemble may obtain a better performance; and (3) the desired function cannot be represented or achieved by a single model.
Brown et al. [39] gave a general survey of ensemble learning and a theoretical description of why ensemble learning may outperform the single model. They divided the methods into three categories for achieving diversity: (1) starting point in hypothesis space: vary the starting points within the hypothesis space by creating different initial settings; (2) set of accessible hypotheses: vary the training sets that are accessible by the ensemble method employed (e.g., bagging [40], boosting [41] random subspace [42]); and (3) hypothesis space traversal.
Feature Selection Feature selection takes the
advantages of reducing the number of features and the size of storage requirements, decreasing training and computational time, facilitating data visualization and understanding, and improving
predictive performance [43,44]. The algorithms of feature selection can often be classified into 3 approaches, i.e. filter, wrapper, and embedded methods [43]. The filter method is a preprocessing procedure which selects a subset of features based on statistic measures independent of the designed classifiers. In contrast, the wrapper method assesses individual subsets of features in a recursive way by considering their predictive efficiency to a given classifier. It is more computational intensive than the filter method, but is believed to able to provide more efficient outcome. The subset with a smallest number of features achieving the highest predictive accuracy is used for classifier construction. An alternative wrapper method which combined genetic algorithm with a classifier was also proposed for feature selection [45,46]. This strategy can also be used for adjusting cost value and kernel parameter of an SVM model, together with feature selection when designing the classifier [47]. On the other hand, embedded method selects features during the process of model construction by considering the cost function of a model [48], for example the function shown in Eq. (6) for SVM model. In this study, a wrapper method combining genetic algorithm and an ensemble of SVM classifiers was adopted to construct the CDSS for diagnosing severe OSA patients.
Generally, the wrapper method assesses individual subsets of features in a recursive way by considering their predictive efficiency to a given classifier. For a vector space with n features, recursive feature elimination (RFE) algorithm removes unimportant features based on backward sequential selection by iteratively deleting one feature at a time, resulting in a sub-optimal combination of r (r<n) features with best predictive performance [43]. For SVM-RFE, it starts with all features by deleting a feature repeatedly until r features are left, which leads to a largest margin separating two classes. Weight magnitude which is inverse proportional to the margin is generally used as the ranking criterion in determining importance of individual features. The eliminated feature p is the one which minimizes the variation of weight:
N j i j T i j i j i p , 0 y y K 2 ) (x x w (11)In addition to weight or margin, other measures such as generalization error [48], gradient of weight [49], and Fischer’s ratio [50] were also proposed for feature ranking. In this study, classification
accuracy was used as fitness function for determining the optimal solution in each iteration.
3
Data RecordingRetrospective data of 699 suspected OSA patients tested using PSG equipment for overnight attending recording at the Sleep Center of a University Hospital from Jan. 2005 to Dec. 2006 were collected. Data of 48 subjects with ages less than 20 or more than 85 years old, as well as the data acquired from 85 subjects with sleeping time less than 4 hours were excluded [4]. Hence only data of 566 patients were used for investigation. Alice 4 PSG recorder was used to monitor and record PSG during sleep. The recorded physiologic variables include: (1) EEG for detecting brain electrical activity and sleep stages, (2) EOG and submental EMG for detecting eye and jaw muscle movement, (3) tibia EMG for monitoring leg muscle movement, (4) airflow for detecting breath interruption, (5) inductance plethysmorgraphy for estimating respiratory effort, (6) ECG for measuring heart rate, and (7) arterial oxygen saturation for inspecting blood oxygen.
Anthropometric (weight, height, BMI, waist, neck and hip circumferences, etc.), demographic (age, gender, etc.), symptomatic (diabetes, hypertension, asthma, smoking, alcohol consumption, observed apnea, nocturnal choking, morning headache, wake refresh, day sleepiness, etc.) data, questionnaires including Epworth scaling score (ESS), the sleeping disorders questionnaire, the Beck depression inventory (BDI), and the medical outcome study 36-item short form health survey (SF-36) were filled by the subjects before PSG recording.
4
CDSS Designed with GA and Ensemble SVMRegarding SVM performance, it is critical to determine suitable combination of SVM parameters (log2C and log2γ). Genetic algorithm can find optimal solution within an acceptable time, which is faster than dynamic programming using exhaustive searching strategy. By taking the advantage of GA in quickly searching the optimal features and parameter, a nonlinear hyperplane with a maximum margin can be obtained by using SVM to classify two clusters. Classification of multiple clusters can be easily expanded. The freeware LIBSVM [51], a library for SVM, was adopted to be integrated with
the GA program designed by our team to achieve best performance.
The values of SVM parameters, i.e. regularization parameter (C) and kernel parameter (γ), are critical in optimizing classification performance. Traditionally, regular grid search strategy was used to perform model selection, which is time-consuming with regards to computational complexity. Additionally, different from a previous investigation that GA was used for feature selection followed by SVM for classification [52], the combined GA and ensemble SVM method proposed in this study adjusted SVM parameters and selected features at the same iteration. It can converge to an sub-optimal solution in a reasonable time.
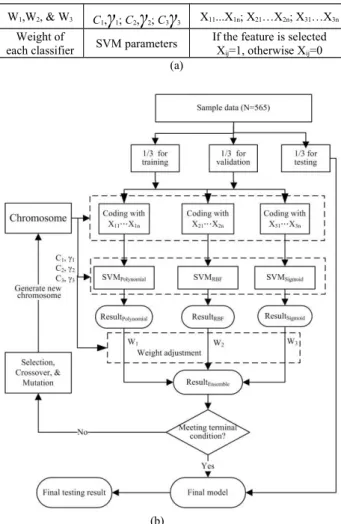
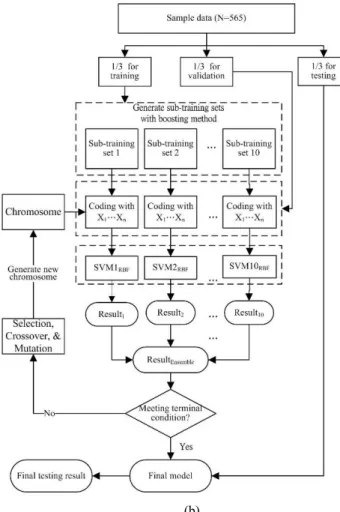
Two ensemble SVM classifiers were design: multiple-kernel and single-kernel. As shown in Fig. 1, an ensemble of 3 SVM classifiers embedded with different kernels (polynomial, RBF, and Sigmoid) were designed. Figure 1(a) illustrates the constituents of the chromosome of GA including weights and parameters of 3 individual SVM models and clinical features. On the other hand, Fig. 2 shows an ensemble of 10 single-kernel SVM classifiers constructed by 10 training subsets obtained from the training set by boosting method. Compared to Fig. 1(a), as indicated in Fig. 2(a), only a set of SVM parameters is needed for this model. Figure 2(b) depicts the model which combines GA and an ensemble SVM classifier for feature selection and CDSS construction. The SVM kernel adopted is radial basis function (RBF) and the fitness function is defined as the accuracy of classification.
In order to prevent over-training with cross validation, data of 565 samples were randomly divided into 3 sets, i.e. training (N=188), validating (M=188), and testing (P=189) sets. A total of 10 training datasets, each containing 188 samples, were obtained using the boosting method by randomly sampling the training dataset to create an ensemble of 10 SVM classifiers. The experimental procedure is summarized as follows:
Training phase (1) Generate an initial population
of chromosomes consisting of SVM parameters and features. (2) Randomly divide the data into training, validating, and testing sets. (3) Obtain 10 sub-training datasets by randomly sampling from the training set using boosting method. (4) Construct an ensemble of 10 SVM classifiers based on the 10 sub-training datasets by using the validating set for validation. A validating sample is classified as sever
OSA if the mean probability of the ensemble SVM classifiers is greater than 0.5. (5) Generate a new population of SVM parameters and features and repeat Step 4 to get optimal SVM parameters and features.
Testing phase (1) Execute Steps 2 and 3 of the
training phase to generate testing set and 10 sub-training sets. (2) Apply the SVM parameters and features obtains from the training phase to construct an ensemble of 10 SVM classifiers based on the 10 sub-training sets, and then use the testing set for testing. A testing sample is classified as severe OSA if the mean probability of the ensemble SVM classifiers is greater than 0.5. (3) Repeat Steps 1 and 2 for 10 iterations to obtain mean accuracy, sensitivity, and specificity and their standard deviations.
W1,W2, & W3 C1,
γ
1; C2,γ
2; C3γ
3 X11...X1n; X21…X2n; X31…X3nWeight of
each classifier SVM parameters
If the feature is selected Xij=1, otherwise Xij=0
(a)
(b)
Figure 1: (a) Chromosome and (b) flowchart of integrated GA and SVM algorithm for designing multiple-kernel ensemble classifiers.
5 Experimental Results
In one experiment, the subjects were divided into two groups with AHI=15 used as the threshold to discriminate severity of OSA by classifying the subjects into normal and mild (AHI<15) as well as moderate and severe (AHI>=15) groups; while in the other experiment, the subjects were divided into non-severe (AHI<30) and severe (AHI>=30) groups using AHI=30 as the threshold.
Tables 1 and 2 show the results of detecting severe OSA patients with thresholds based on AHI=15 and AHI=30, respectively, using an ensemble of 10 SVM classifiers with a single RBF kernel. The accuracy, sensitivity, and specificity are 89.62±1.43, 89.34±1.68, and 90.15±2.07, respectively, for AHI>15, as well as 90.37±0.71, 90.11±1.78, and 90.58±1.78, respectively, for AHI>30.
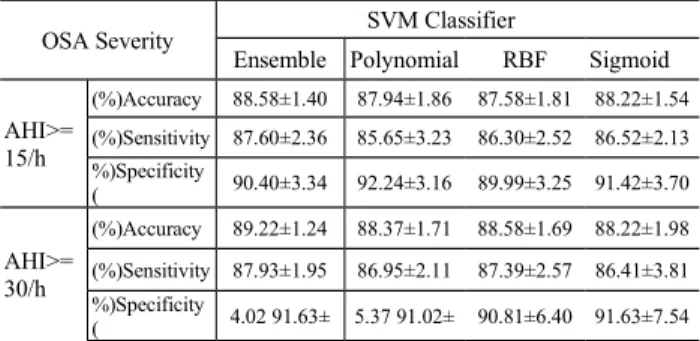
As shown in Tables 3, the accuracy, sensitivity, and specificity for an ensemble of 3 SVM classifiers are 88.58±1.40, 87.60±2.36, and 90.40±3.34, respectively, for AHI>15, as well as 89.22±1.24, 87.93±1.95, and 91.63±4.02, respectively, for AHI>30.
C γ X1 X2 ... Xn
SVM Paramet Features (Xi=1 if selected, otherwise Xi =0
(b)
Figure 2: (a) Chromosome and (b) flowchart of integrated GA and SVM algorithm for designing single-kernel ensemble classifiers.
6 Discussions and Conclusions
The average sensitivities for the single-kernel ensemble SVM classifier achieve 89.34% and 90.11%, respectively for AHI=15 and AHI=30 as the thresholds, which is higher than the multiple-kernel ensemble SVM classifier (87.60% and 87.93%, respectively) and the classifiers constructed with a single kernel (AHI=15/AHI=30:
85.65%/86.95%, 86.30%/87.39%, and
86.52%/86.41% for polynomial, RBF, and sigmoid kernels, respectively).
Recently, a comprehensive evaluation of representative oxyhemoglobin indices for predicting severity of OSA was investigated by Lin et al. [13]. The results showed that ODI had a better diagnostic performance than the time domain and frequency domain indices in diagnosing severity of OSA with sensitivity/specificity achieving 84.0%/84.3% in AHI>15/h and 87.8%/96.6% in AHI>30/h, respectively. The proposed ensemble single-kernel SVM classifier with 3 selected features (ODI, ESS,
or BMI) achieves a better diagnosing performance with sensitivity/specificity of 89.34%/90.15% in AHI>15/h and 90.11%/90.58% in AHI>30/h. On the other hand, the sensitivity/specificity is 87.60%/90.40% in AHI>15/h and similar diagnosing performance of 87.93%/91.63% in AHI>30/h for ensemble multiple-kernel SVM classifier. The classification performances of both ensemble SVM classifiers are better than the non-ensemble SVM classifiers and the classification reported in [13].
Table 1: Detecting severe p
atients with AHI>15
Iteration Accuracy Sensitivity Specificity
1 90.90 89.34 93.84 2 89.30 88.52 90.76 3 89.30 89.34 89.23 4 88.23 87.70 89.23 5 88.23 86.88 90.76 6 90.90 91.80 89.23 7 88.77 88.52 89.23 8 91.44 90.98 92.30 9 91.44 91.80 90.76 10 87.70 88.52 86.15 Mean 89.62 89.34 90.15 STD 1.43 1.68 2.07
Table 2: Detecting severe p
atients with AHI>30
Iteration Accuracy Sensitivity Specificity
1 91.97 90.47 93.20 2 90.37 90.47 90.29 3 90.37 90.47 90.29 4 89.83 89.28 90.29 5 90.37 91.66 89.32 6 90.90 88.09 93.20 7 90.37 94.04 87.37 8 89.30 89.28 89.32 9 89.83 88.09 91.26 10 90.37 89.28 91.26 Mean 90.37 90.11 90.58 STD 0.71 1.78 1.78
Cost-effectiveness was conducted based on two
schemes: oximetry/PSG and PSG. For the former scheme, the physicians are suggested to order a take-home oximetry examination to diagnose severe OSA patients followed by an additional PSG examination for detecting non-severe patients. In contrast, all the suspected OSA patients take PSG examinations to detect OSA severity for the latter scheme. Currently, Bureau of National Health Insurance (BNHI) of Taiwan pays NT$380 and NT$4500 for take-home oximetry and PSG examinations, respectively. Although, except oximetry, the non-severe patients will receive an additional PSG examination, which might cost more, by considering the cost saved by severe OSA patients who take only cheap oximetry examination,
the total diagnosing cost is expected to be reduced, as detailed below.
The average cost (AC) per case of oximetry/PSG scheme in OSA diagnosis can be calculated according to the following equation:
)] / 1 /( 1 [ % 100 P S F T P AC ox psg (12)
where Pox (NT$380) and Ppsg (NT$4500) indicates
the costs of conducting an oximetry test and a PSG examination, respectively; S is the sensitivity; and T and F represent the percentages of TRUE (severe) and FALSE (non-severe) cases, respectively. The first term at the right side of Eq. (12) indicates that all the suspected OSA patients have to take oximetry tests, while only those who are not detected as True-Positive using oximetry need to take an additional PSG examination. In our dataset, there are 309 and 256 cases of severe and non-severe patients. Hence, the average cost per case paid by BNHI for oximetry/PSG scheme is: 380 × 1 + 4500 × [1 - 0.901 / (309 / 256)] = NT$1520, compared to NT$4500 per case for PSG scheme. It can save the BNHI as much as NT$2980 per case. Table 3: Comparisons of an ensemble multiple-kernerl SVM classifier and 3 individual SVM classifiers with single k
ernel
OSA Severity SVM Classifier
Ensemble Polynomial RBF Sigmoid AHI>= 15/h Accuracy (%) 88.58±1.40 87.94±1.86 87.58±1.81 88.22±1.54 Sensitivity (%) 87.60±2.36 85.65±3.23 86.30±2.52 86.52±2.13 Specificity %) ( 90.40±3.34 92.24±3.16 89.99±3.25 91.42±3.70 AHI>= 30/h Accuracy (%) 89.22±1.24 88.37±1.71 88.58±1.69 88.22±1.98 Sensitivity (%) 87.93±1.95 86.95±2.11 87.39±2.57 86.41±3.81 Specificity %) ( 4.0291.63± 5.3791.02± 90.81±6.40 91.63±7.54 Regarding the time needed to confirm a diagnosis is 1 and 7 days, for oximetry and PSG, respectively, under currently outpatient setting in a university hospital situated in middle Taiwan. Hence, the average time of affirmative diagnosis can be calculated as: 1×1+7×[1-0.945/ (309/256)]=2.77 days. In contrast, the average time of the PSG scheme for affirmative diagnosis is as long as 7 days. The average cost ratio of 0.66 indicates that the oximetry/PSG scheme is more cost effective than PSG scheme in the diagnosis of OSA patients. Furthermore, the average waiting time ratio of 0.40 shows that the oximetry/PSG scheme is more time efficient than the PSG scheme. Notice that the higher the sensitivity of detecting severe OSA patients using oximetry, the less the
average cost and the affirmative diagnosis time are needed. It indicates that design of a high-performance CDSS is important.
In conclusion, an ensemble of single-kernel SVM classifier was demonstrated to be effective in the diagnosis of severe OSA patients using two features, ODI and either ESS or BMI. It can be used to diagnose severe OSA patients by using cheap take-home oximetry accompanied with ESS questionnaire or BMI at the first screening stage, which is then followed by PSG examination to confirm severity of other suspected OSA patients. Furthermore, after cost-effectiveness analysis, it was shown that the oximetry/PSG scheme is more effective in reducing the healthcare cost and waiting time than the traditional scheme with PSG examination only
.
Acknowledgements
This work was supported in part by National Science Council of Taiwan (Grant NSC98-2410-H-039-003-MY2) and Central Taiwan University of Science and Technology (Grants CTU100-INS-02, CTU100-INS-03, and PTH10029).
References
[1] T. Young, M. Palta and J. Dempsey, The occurrence of SDB among middle-aged adults, N. Engl. J. Med. (1993), 328, 1230-1235.
[2] T. Young, L. Even and L. Finn, Estimation of the clinically diagnosed proportion of sleep apnea syndrome in middle aged men and women, Sleep. (1997), 20, 705-706.
[3] N. Hartenbaum, N. Collop, I. M. Rosen, B. Phillips and C. F. P. George, Sleep Apnea and Commercial Motor Vehicle Operators: Statement from the joint task force of the American College of Chest Physicians, American College of Occupational and Environmental Medicine, and the National Sleep Foundation, JOEM. (2006), 48, S4-S37.
[4] J. C. M. Lam, B. Lam, C. L. Lam, D. Fong, J. K. L. Wang, H. F. Tse, K. S. L. Lam and M. S. M. Ip, Obstructive sleep apnea and the metabolic syndrome in community-based Chinese adults in Hong Kong, Respiratory Medicine. (2006) 100, 980-987.
[5] J. C. Coffee, Is chronic hyperventilation syndrome a risk factor for sleep apnea? Part 1, Journal of Bodywork and Movement Therapies. (2006), 10, 134-146.
[6] G. Devouassoux, P. Levy, E. Rossini, I. Pin, M. Fior-Gozlan, M. Henry, D. Seigneurin and J. L. Pepin, Sleep apnea is associated with bronchial imflammation and continuous positive airway pressure-induced airway
hyperresponsiveness, J Allergy Clin Immunol. (2007), 119, 597-603.
[7] J. Montplaisir, M. A. Bedard, F. Richer and I. Roulea, Neurobehavioral manifestations in obstructive sleep apnea syndrome before and after treatment with continuous positive airway pressure, Sleep. (1992), 15, 517-519.
[8] P. E. Teloken, E. B. Smith, C. Lodowsky, T. Freedom and J. P. Mulhall, Defining association between sleep apnea syndrome and erectile dysfunction, Urology. (2006), 67, 1033-1037.
[9] N. Gosselin, A. Mathieu, S. Mazza, D. Petit, J. Malo and J. Montplaisir, Attentional deficits in patients with obstructive sleep apnea syndrome: An event-related potential study, Clinical Neurophysiology. (2006), 117, 2228–2235.
[10] R. Taman and D. Gozal, Obesity and obstructive sleep apnea in children, Pediatr Respir Review. (2006), 7, 247-259.
[11] W. W. Flemons, M. R. Littner, J. A. Rowley, P. Gay, W. McDowell Anderson, D. W., Hudgel, R. D. McEvoy and D. I. Loube, Home diagnosis of sleep apnea: A systematic review of the literature, Chest. (2003), 124, 1543-1579.
[12] N. Netzer, A. H. Eliasson, C. Netzer and D.A. Krisco, Overnight Pulse Oximetry for Sleep-Disordered Breathing in Adults-A Review, Chest. (2001), 120, 625-633.
[13] C. L. Lin, C. Yeh, C. W. Yen, W. H. Hsu and L. W. Hang, Comparison of the indices of oxyhemoglobin saturation by pulse oximerty in obstructive sleep apnea hypopnea syndrome, Chest. (2009), 135, 86-93.
[14] J. A. Osheroff, J. M. Teich, B. Middleton, E. B. Steen, A. Wright and D. E. Detmer, A Roadmap for National Action on Clinical Decision Support, JAMIA. (2007), 14, 141-145.
[15] A. X. Garg, N. K. J. Adhikari and H. McDonald, Effects of Computerized Clinical Decision Support Systems on Practitioner Performance and Patient Outcomes- A Systematic Review, JAMA. (2005), 293(10), 1223-1238. [16] L. Lin, P. J. H. Hu, O. R. L. Sheng, A decision support
system for lower back pain diagnosis: Uncertainty management and clinical evaluations, Decision Support Systems. (2006), 42,1152-1169.
[17] L .S. Goggin, R. H. Eikelboom and M.D. Atlas, Clinical decision support systems and computer-aided diagnosis in otology, Otolaryngology-Head and Neck Surgery. (2007), 136, S21-S26.
[18] J. H. Eom, S. C. Kim and B. T. Zhang, AptaCDSS-E: A classifier ensemble-based clinical decision support
system for cardiovascular disease level prediction, Expert Systems with Applications. (2008), 34(4), 2465-2479. [19] M. M. Zheng, S. M. Krishnan and M. P. Tjoa, A
fusion-based clinical decision support for disease diagnosis from endoscopic images, Computer in Biology & Medicine. (2005), 35(3), 259-274.
[20] S. J. Leslie, M. Hartswood, C. Meurig, S. P.McKee, R. Slack, R. Procter and M. A. Denvir, Clinical decision support software for management of chronic heart failure: Development and evaluation, Computer in Biology & Medicine. (2006), 36(5), 495-506.
[21] S. R. Raghavan, V. Ladik and K.B. Meyer, Developing decision support for dialysis treatment of chronic kidney failure, IEEE Transa Infor Tech Biom. (2005), 9(2), 229-238.
[22] C. Cornalba, R.G. Bellazzi and R. Bellazzi, Building a normative decision support system for clinical and operational risk management in hemodialysis, IEEE Trans Infor Tech Biom. (2008), 12(5), 678-686.
[23] F. Lyerla, C. LeRouge, D. A. Cooke, D. Turpin and L. Wilson, A nursing clinical decision support system and potential predictors of head-of-bed position for patients receiving mechanical ventilation, Am J Crit Care. (2010), 19(1), 39-47.
[24] S. Eslami, N. F. de Keizer, A. Abu-Hanna, E. de Jonge and M. J. Schutz, Effect of a clinical decision support system on adherence to a lower tidal volume mechanical ventilation strategy, Journal of Critical Care. (2009), 24(4), 523-529.
[25] J. C. Hsu, Y. F. Chen, Y. C. Du, Y. F. Huang, X. Jiang, and T. Chen, Design of a Clinical Decision Support System for Determining Ventilator Weaning Using Support Vector Machine, International Journal of Innovative Computing, Information & Control. (2012), 8 (1B), 933-952.
[26] S. W. Chien, C. T. Bau, K. C. Lin, K. A. Wang, Y. F. Chen, and J. C. Chen, Evaluation of Intelligent System to the Control of Diabetes, International Journal of Innovative Computing, Information & Control. (2012), 8 (1B), 779-790.
[27] S. Idicula-Thomas, A. J. Kulkarni, B. D. Kulkarni, V. K. Jayaraman and P. V. Balaji, A support vector machine-based method for predicting the propensity of a protein to be soluble or to form inclusion body on overexpression in Escherichia coli, Bioinformatics. (2006), 22(3), 278-84. [28] S. Tsantis, D. Cavouras, I. Kalatzis, N. Piliouras and N.
Dimitropoulos G. Nikiforidis, Development of a support vector machine-based image analysis system for assessing the thyroid nodule malignancy risk on ultrasound, Ultrasound Med. Biol. (2005), 31(11), 1451-9.
[29] P. M. Kasson, J. B. Huppa, M. M. Davis and A. T. Brunger, A hybrid machine-learning approach for segmentation of protein localization data, Bioinformatics. (2005), 21(19), 3778-86.
[30] M. E. Mavroforakis, H. V. Georgiou, N. Dimitropoulos, D. Cavouras and S. Theodoridis, Mammographic masses characterization based on localized texture and dataset fractal analysis using linear, neural and support vector machine classifiers, Artif. Intell. Med. (2006), 37(2), 145-62.
[31] M. P. S. Brown et al., Knowledge-based analysis of microarray gene expression data using support vector machines, PNAS. (2000), 97(1), 262–267.
[32] D. DeCoste and B. Schuolkopf, Training invariant support vector machines, Machine Learning. (2002), 46, 161-190.
[33] Y. Lecun et al., Comparison of learning algorithms for handwritten digit recognition, International Conference on Artificial Neural Networks. (1995), 53-60.
[34] S. Theodoridis and K. Koutroumbas, Pattern Recognition. 2nd edition. Academic Press, San Dieago. (2003). [35] D. Opitz and R. Maclin, Popular ensemble methods: An
empirical study, Journal of Artificial Intelligence Research. (1999), 11, 169-198.
[36] R. Polikar, Ensemble based systems in decision making, IEEE Circuits and Systems Magazine. (2006), 6(3), 21-45.
[37] L. Rokach, Ensemble-based classifiers, Artificial Intelligence Review. (2010), 33, 1-39.
[38] T. G. Dietterich, Ensemble methods in machine learning, Proceedings of the 1st International Workshop on Multiple Classifier Systems. (2000), 1-15.
[39] G. Brown, J. Wyatt, R. Harris and X. Yao, Diversity creation methods: A survey and categorisation, Inf. Fusion. (2005), 6(1), 5-20.
[40] L. Breiman, Bagging predictors, Mach. Learn. (1996), 24(2), 123-140.
[41] R. E. Schapire, The strength of weak learnability, Mach. Learn. (1990), 5(2), 197–227.
[42] T. K. Ho, The random subspace method for constructing decision forests, IEEE Trans. Pattern Anal. Mach. Intell. (1998), 20(8), 832–844.
[43] I. Guyon and A. Elisseeff, An introduction to variable and feature selection, Journal of Machine Learning Research. (2003), 3, 1157-1182.
[44] G. P. Zhang, Neural networks for classification: a survey, IEEE Trans SMC- Part C. (2000), 30(4),
451-462.
[45] L. Boroczky, L. Zhao and K. P. Lee, Feature subset selection for improving the performance of false positive reduction in lung nodule CAD, IEEE Transactions on Information Technology in Biomedicine. (2006), 10(3), 504-511.
[46] S. Osowski, R. Siroić, T. Markiewicz and K. Siwek, Application of support vector machine and genetic algorithm for improved blood cell recognition, IEEE Transactions on Instrumentation and Measurement. (2009), 58(7), 2159-2168.
[47] Y. Bazi and F. Melgani, Toward an optimal SVM classification system for hyperspectral remote sensing images, IEEE Transactions on Geoscience and Remote Sensing. (2006), 44(11), 3374-3385.
[48] S. Maldonado and R. Weber, A wrapper method for feature selection using support vector machines, Information Sciences. (2009), 179, 2208-2217.
[49] A. Rakotomamonjy, Variable selection using SVM-based criteria, Journal of Machine Learning Research. (2003), 3, 1357-1370.
[50] M. E. Blazadonakis and M. Zervakis, Wrapper filtering criteria via linear neuron and kernel approaches, Computers in Biology and Medicine. (2008), 38, 894-912.
[51] C. C. Chang, C. J. Lin, LIBSVM: a library for support vector machines, (2001), http://www.csie.ntu.edu.tw/ ~cjlin/libsvm
[52] S. Osowski, R. Siroic, T. Markiewicz and K. Siwek, Application of support vector machine and genetic algorithm for improved blood cell recognition, IEEE Trans Instrument & Measurement. (2009), 58(7), 2159-2168.