Sound Wave Propagation Anisotropy in Silver Nanoprisms:
Characterization of Photoinduced Multiple Modes Using
the Symmetric Molecular Dynamics Method
Ming-Yaw Ng,
†,‡Pyng Yu,
‡,§Jau Tang,*
,‡,§and Yia-Chung Chang*
,†,‡ †Department of Physics, National Cheng Kung University, Tainan, Taiwan‡Research Center for Applied Sciences, Academia Sinica, Taipei, Taiwan §Institute of Photonics, National Chiao-Tung University, Hsinchu, Taiwan
ABSTRACT: We present both theoretical and experimental studies of the sound velocity anisotropy and laser-induced multiple acoustic phonon oscillations in silver nanoprisms. A large-scale simulation method based on molecular dynamics and group theory for nanoprisms with C3v symmetry was developed. We observed the most prominent planar modes and the less studied vertical modes and found that the anisotropic vibrational properties of silver nanoprisms strongly depend on the particle’s aspect ratio (bisector length over thickness). For the case of a smaller aspect ratio, we identified
these modes as the A1modes with a larger in-phase radial atomic displacement. These modes can be classified into three main types: breathing modes and totally symmetric modes which are planar modes and thickness-related vertical modes. Due to the strong coupling with laterally confined modes, a broad band of thickness-related modes is found (in contrast to a single sharp peak for thinfilms), which leads to a fast decaying component in the oscillation spectrum. The calculated results and the sound velocity anisotropy along different crystal axes are in good agreement with our transient optical absorption experiments.
■
INTRODUCTIONOver recent years, laser-induced ultrafast structural dynamics in nanomaterials such as nanoparticles or nanocrystals of semi-conductors and metals have been a subject of considerable study using time-resolved optical pump−probe techniques.1−9 The remarkable dynamic phenomena due to transient responses of electrons and phonons in nanomaterials have been attractive to researchers. The thermal properties of nanomaterials such as thermal conductivity and capacity are associated with the confined phonon oscillations.10In particular, complex confined phonon modes can be excited in low-symmetry metallic nanoparticles such as nanorods, nanocubes, nanoprisms, and nanodisks, and the complexity depends not only on their shapes and sizes but also on their realistic crystalline structure.4,7−9,11,12 For time-resolved pump−probe experiments, the oscillation frequencies of metallic nanoparticles are obtained from the analysis of the transient signals, and the measured signals are influenced strongly by several experimental conditions such as the pump power and wavelength of pump and probe beams, etc.4,13,14 Furthermore, only vibrational modes with a large amplitude can be identified by fitting the experimental data. Several previous experiments showed that two planar-like modes were observed in metal nanoprisms, and the involved modes have been calculated by Bonacina et al.4and Burgin et al.8using a numerical method based on an isotropic elastic model and the two dominant modes which were observed in experiment could be identified phenomenologically. However, in such a continuum
model, the nanoprism is treated as a homogeneous isotropic elastic matter with D3hsymmetry, and thus, the anisotropic effect
of the crystal structure is ignored in these calculations. Recently, the weaker thickness-related modes of gold nanoplates or nanoprisms with various thicknesses have been studied by several experimental works.8,15−17When the bisector length is far larger than the thickness, the thickness-related mode of nanoprisms is similar to the out-of-plane mode observed in thin metalfilms. However, when L is close to T, the out-of-plane oscillation has a strong coupling with the in-plane oscillation, and therefore, the effect due to thickness and anisotropy of silver nanoprisms has significant impacts on the characteristics of phonon modes. It implies that one cannot simply draw a satisfactory conclusion from experimental studies alone. Instead, a detailed theoretical model including structural properties of nanomaterials and appropriate experimental conditions is needed.
In this paper, we report detailed analyses of experimental data via a theoretical study of laser-induced multiple vibrational modes in anisotropic silver nanoprisms (which contain up to 106atoms) using
the symmetric molecular dynamics (SMD) method, which is capable of describing the bulk phonon dispersion relations accurately.18The SMD method is an atomistic method based on molecular dynamics (MD) method and group theory. The interatomic interactions are
Received: April 15, 2013
Revised: June 8, 2013
Published: June 8, 2013
described by the long-range empirical potential (LREP), i.e., tight-binding potential based on the second-moment approximation (TB-SMA).19 To simulate large-scale nanoprisms, group theory is applied to increase the computational efficiency in MD simula-tions.20,21We found that the vibrational properties of silver nanoprisms are strongly dependent on the aspect ratio of the nanoprismκ, which is defined as the ratio between the bisector length L and the thickness T (L/T). For nanoprisms with a large aspect ratio, their oscillation spectra are consistent with the previous studies as mentioned above. For the smaller aspect ratio, more than two dominant oscillations can be identified due to strong coupling of the in-plane and out-of-plane oscillations, and the higher-frequency modes distributed widely around the thickness-related mode of the silver thinfilm.
■
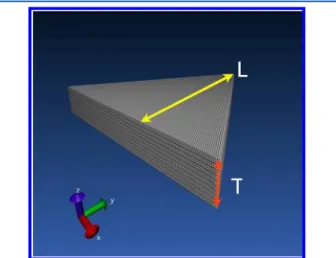
METHODTheoretical Section. Simulation Model. A single silver nanoprism has an fcc structure that has a (111) lattice plane and C3vsymmetry, as shown in Figure 1. According to the group
theory, the C3vgroup has the following symmetry operations: the identity E, two 3-fold axes C3, and three vertical reflection planes
σv. The vibrational modes in silver nanoprisms can be divided
into three symmetry types, associated with representations A1,
A2, and E. Only the A1modes can be excited by the symmetric sudden thermal expansion. It should be noted that, for the calculations based on a continuum model, the silver nanoprism is treated as an isotropic structure with D3h symmetry, and the
displacement patterns on different planes (along the z-axis) are the same since D3h symmetry has a horizontal reflection plane
perpendicular to the z-axis; for the atomistic method, the real nanoprism actually has a lower symmetry C3v(compared to D3h)
after considering the crystal structure, and according to the group theory, the nanoprism can have different displacement patterns along the z-axis due to the anisotropy of fcc structures.
The laser heating process is an important but complicated issue for our SMD simulations, because the excitation of phonon modes in nanoprisms strongly depends on the initial conditions (or experimental conditions). We assume that a silver nanoprism is illuminated uniformly by a pulsed laser and the energy of laser light is absorbed by conduction electrons (electron expansion) and then transferred to the lattice (lattice expansion) by electron−phonon coupling within a very short time τep (less than a few ps). The lattice temperature can reach about 450 K
theoretically at equilibrium.22The heat effect causes the nearest-neighbor distance in the lattice to increase approximately byΔr = 0.01 Å at 450 K.23The nearest-neighbor distance restores back to r0 with a characteristic time τc as t → ∞, since the heat is
dissipated to the surrounding environment. The thermal expansion of nanoprisms is described as a time-dependent change of the TB-SMA potential (see eq 1). Since silver has the highest thermal conductivity of any noble metal, the thermal gradient in nanoprisms after thefirst few ps can be ignored, and the expansion can be treated as a symmetric sudden expansion. In the SMD simulation, our study focused on the long-time oscillation behavior of silver nanoprisms, and thus, the thermal expansion process including hot-electron pressure for t <τepis excluded in the simulation. Therefore, our simulations always start after the electrons and lattice reached quasi-thermal equilibrium for the hot electrons with the lattice (t >τep), and the effect due to hot-electron pressure, which has significant contribution to the phase and amplitude of the oscillation pattern at short times, has been ignored in our model.13,22 The equations of motion of atoms are solved using the velocity Verlet algorithm, and the time step Δt is set to be 4 fs. In order to have a higher resolution oscillation spectrum, the total simulation time for each case is 1.76 ns.
Symmetric Molecular Dynamics Method. In the SMD method, we choose one atom from each shell (in group theory, the atoms whose positions can be transformed into one to another by the six symmetry operations for the C3vpoint group
belong to the same shell) as the representative atom to participate in the MD simulation. These representative atoms form an irreducible segment of the nanoprism. Only the positions and velocities of atoms in the irreducible segment are calculated in the simulation, and the corresponding results for other atoms can be obtained by applying the six symmetry operations on these representative atoms. Compared with the standard MD method, group theory can help not only reduce the cost of computational time and memory but also increase the numerical stability. To further improve the computational efficiency for SMD simulations, the graphics processing unit (GPU) parallel computing technique is implemented. The calculation for each atom in the irreducible segment can be accelerated significantly, and therefore, the modeling of a nanoprism of up to 106atoms can be achieved on a personal computer with a GPU card. The long-range empirical potential (LREP) with a new set offitting parameters (see Table 1) is
applied to describe the interatomic force between silver atoms.18 The LREP model with our newfitting parameters can obtain an accurate phonon dispersion curve for bulk silver; therefore, the phonon oscillation of silver nanoprisms can be modeled reliably Figure 1.A single silver nanoprism that has a (111) lattice plane and C3v
symmetry. L and T are the bisector length and thickness of the nanoprisms, respectively.
Table 1. Fitting Parameters of the LREP Model for Bulk Silver
m 4 n 6 rc1(Å) 6.185728 rc2(Å) 7.651708 x0(eV Å−m) 0.1700981 x1(eV Å−m−1) −0.1558156 x2(eV Å−m−2) 0.052233055 x3(10−2eV Å−m−3) −0.74555622 x4(10−4eV Å−m−4) 3.6332160 α (10−4eV2Å−n) 0.93295035 β 3.489679 r0(Å) 2.892067
via the SMD simulation. The total time-dependent model potential ETcan be written as
∑
= + = E [E E ] i N i i T 1 B R (1) where∑
= − + + + + ≠ E 1 r r x x r x r x r x r 2 ( ) ( ) i j i N ij c m i j ij ij ij R 1 0 1 , 2 2 3 3 4 4 ρ = − E tiB( ) i( )t∑
ρ = α − β ≠ − − t r r ( ) ( ) e i j i N ij c n r r t 2 (( / ( )) 1)ij mEiRis a repulsive interaction term for atom i due to the interaction
with its neighboring atoms (rij≤ rc1), and rijis the interatomic distance. EiBis an attractive many-body term due to attractive
interaction between the valence electrons of atom i and its neighboring ions (rij≤ rc2). m, n, rc1, rc2, x0, x1, x2, x3, x4,α, β, and
r0are the 12 empirical parameters used in the LREP model. It is noted that the nearest-neighbor distance in the lattice as given in ref 19 is modified according to the expression r0→ rm= r0+Δr exp(−t/τc). According to our previous study,18the laser-induced
vibrational modes are not sensitive to the characteristic time, and thus,τcis set to be 1 ps in our simulations.
Before running a SMD simulation, a symmetric relaxation method is applied tofind the equilibrium position of each atom in the nanoprism. This method can guarantee the symmetry of nanoprisms. In our simulation, the surface atoms are allowed to move freely (free boundary condition). The equation of motion for an atom i with velocity viand mass miis given by
∂ ⃗ ∂ = ⃗ − ⃗ m v t F f i i i i T d (2) where F⃗iTis the total force on the atom i and f ⃗idis a frictional force.
The damping of the acoustic oscillation of nanospheres has been studied in several experimental works.13,24,25Since the damping rate is influenced by the surrounding medium of the nanoprisms, to simulate the damping in a MD simulation, a frictional force f ⃗id = cv⃗
i is included empirically in the equation of motion.
According to a previous study of Yu et al.,26the corresponding constant c ranges from 10−3to 10−5for different particle sizes. In our calculation, we choose c = 10−5(in units of eV·ps/Å2) to simulate a damped behavior in the oscillation of silver nanoprisms and to improve the numerical stability of the MD simulation due to insufficiently short-time step. The velocity− velocity autocorrelation function⟨C(t)⟩ is calculated to obtain the periodic patterns of the oscillations and⟨C(t)⟩ is defined by
∑
τ ⟨C t ⟩ = ⃗ · ⃗ NM v t v ( ) 1 ( ) ( ) i k N M i i k , , (3) where N and M are the number of atoms and the new time origin τk, respectively. vi⃗(t) is the velocity of atom i at time t. Theoscillation spectra g(ω) are obtained by calculating the Fourier transform of the velocity−velocity autocorrelation function.
Confined Phonon Modes in Silver Nanoprisms: Classifica-tion and Analysis Using Group Theory. To identify the confined phonon modes excited by the symmetry expansion in silver nanoprisms, all eigenmodes of a nanoprism of N atoms are
calculated by solving a 3N × 3N eigenvalue equation of the dynamic matrix DNP. In our study, particles consisting of over 105 atoms are modeled. It is difficult to diagonalize a large-size DNP
directly by present computers. To reduce the computational effort, the theory of point groups is applied to decompose the large-size matrix into several smaller matrices, and then we can solve them separately. DNPof a nanoprism with C
3vsymmetry can
be decomposed into three smaller matrices for three different irreducible representations A1, A2, and E of the C3vpoint group. Since the number of phonon modes is large, all modes are classified according to these irreducible representations, and only A1modes are discussed with the symmetric expansion as an initial
condition of SMD simulations. For example, consider a silver nanoprism of L = 19.6 nm and T = 7.8 nm, and the dimensions of the dynamics matrix are 322353 × 322353. By using group theory, the matrix size for the A1modes becomes 54400× 54400.
The computational effort can be reduced dramatically. The large-size matrix is transformed into several block-diagonal matrices with new basis functions, and the new basis functions can be constructed straightforwardly using the projection operator technique.21The symmetrized basis functions can be obtained by the linear combinations of p-like orbitalsα (α = x, y, z) at sites within a shell. For the C3vpoint group, theα orbitals transform likeΓ1(z-component) andΓ3(x- and y-component), while linear
combinations of sites can transform according toΓposition. Here, Γ1= A1,Γ2= A2, andΓ3= E. Using the direct-product table in ref
20, we have Γ × Γ = Γ + Γ + Γ × Γ + Γ = Γ + Γ + Γ α ( ) ( ) 2 2 4 position 1 2 3 1 3 1 2 3 (4)
and the coupling coefficients can be obtained.
Experimental Section. Synthesis and Characterizations. A wet chemical method developed by Mirkin and his colleague was applied to synthesize silver nanoprisms.27 An aqueous solution of silver nitrite, AgNO3(0.1 mM, 100 mL), trosodium citrate, Na3C6H5O7 (30 mM, 6 mL), poly(vinylpyrrolidone)
(PVP Mw55 000 g/mol, 0.7 mM, 6 mL), and hydrogen peroxide, H2O2(35 wt %, 240μL) was added in sequence and vigorously
stirred at 23°C. Finally, a 100 mM sodium borohydride, NaBH4, was injected into the mixture in the amounts of 500μL in order to control the synthesized thickness of the nanoprisms. For about 20−40 min, silver triangle nanoprisms were synthesized with the indication that the yellow mixtures became blue. The concentration of the suspended silver triangle nanoprisms was estimated to be about 0.31 nM in water solution after centrifugation (9000 prm, 8 min). The images of the synthesized nanoprisms were observed by a transmission electron microscope (TEM, Hitachi H-7100) operated at 75 kV. All UV−vis absorption spectra of the silver nanoprism solutions were measured by a spectrophotometer (JASCO V-670) with a 10 mm light path of a cell.
Time-Resolved Transient Absorption Measurements. For the transient absorption measurements, the single color pump− probe technique was employed with the detailed experimental setup given elsewhere. A 100 fs visible tunable laser provided by an optical parametric amplifier (TOPAS, Spectra Physics, Inc.) with a repetition rate of 1 kHz was applied to the nanoprisms for single color pump−probe measurements. Here, the OPA laser was generated by an amplifier of a Ti:sapphire laser system (Spitfire, Spectra Physics, Inc.), in which a amplifier laser was pumped and seeded by an diode laser (Spectra Physics, Inc.) and an oscillator of the Ti:sapphire laser system (Tsunami, Spectra Physics, Inc.). A translational stage was performed to control the
delay time between the pump and probe beams, which were focused on the samples with a laser energy ratio of 100 to 1. The probe beam was detected by a photodiode detector (2001-FC, New Focus Inc.), and acquired by a personal computer through a lock-in amplifier (SR830, Stanford Research Inc.). A perpendic-ular polarization between the two beams was employed tofilter out the scattered light of the pump beam which was chopped with a frequency of 1 kHz. Here, the samples were stored in an ice bath and a dark environment and circulated in aflow cell in a 1 mm optical light path to reduce the photodegradation during the measurements.
■
RESULTS AND DISCUSSIONThe computed normalized oscillation spectra for silver nano-prisms of varying particle sizes are shown in Figure 2a and b. For each case, the spectrum is normalized with respect to the largest amplitude of that case, and the frequency resolution is 0.000 417 THz. In Figure 2a, T isfixed to be 6.8 nm and L > 34 nm (κ > 5); two dominant oscillation frequencies are observed in the spectra. According to previous experimental observations,4,8 the first frequency corresponds to the breathing mode and the second frequency corresponds to the totally symmetric mode. According to the characteristics of these modes, the breathing mode corresponds to a large in-plane displacement at the three
corners (Figure 3a), and the totally symmetric mode corres-ponds to a large in-plane displacement at the edge centers (Figure 3b). In general, the amplitude of thefirst mode is larger than that of the second mode. However, the amplitude ratio cannot be calculated quantitatively from our oscillation spectra due to the frequency resolution of discrete Fourier transform, and the amplitude of each excited mode is influenced strongly by the initial condition of the SMD simulations. These two modes exhibit planar-like oscillation (oscillation in the x−y plane), and our simulated results are consistent with the previous experimental observation.
For L < 34 nm (κ < 5), multiple oscillation frequencies can be observed and their contribution becomes obvious when L is decreased. For the nanoprism of L = 19.6 nm (bottom of Figure 2a), four main oscillation frequencies can be found (0.09125, 0.1100, 0.1575, and 0.1737 THz). The modes at 0.1100 and 0.1575 THz can be found in nanoprisms with a larger L, and the other two frequencies are observed only in nanoprisms with a smallerκ. For nanoprisms with a smaller κ, the four dominant modes correspond to two closely spaced breathing modes and two closely spaced totally symmetric modes, both with about 0.01− 0.018 THz frequency difference. For nanoprisms with fixed L = 19.6 nm, the frequencies of the breathing and totally symmetric modes which are observed only in nanoprisms with a largerκ Figure 2.Normalized oscillation spectra for silver nanoprisms: (a) for nanoprisms with T = 6.8 nm and different bisector lengths L and (b) for nanoprisms with L = 19.6 nm and different T. The black dashed line denoted the oscillation frequencies in silver thin films with different thickness excited by the symmetric expansion. The dominant peaks correspond to planar-like oscillations. The several weaker peaks which depend on the thickness are observed.
Figure 3.Laser-induced vibrational modes in silver nanoprisms can be classified into two planar modes: (a) breathing modes and (b) totally symmetric modes, and (c) thickness-related (vertically confined) modes. The regions of the larger displacement of atoms are denoted in red color.
are shifted slightly (Δf = 0.067−0.094 THz), when the T is increased from 4.9 to 7.8 nm (Figure 2b). We found that, when T was increased to 7.8 nm, the two closely spaced breathing modes made dominant contributions to the spectrum, while the two closely spaced totally symmetric modes become weaker. Such behavior could be understood from the laser-induced oscillation of nanocubes or nanospheres. Whenκ approaches 1, a nanoprism becomes more similar to a cube-like nanoparticle, and the predominant modes excited by laser-induced heating are the breathing modes.28
Figure 2 shows that multiple weaker oscillation frequencies could be found in the higher-frequency region ( f > 0.2 THz). These frequencies are associated with the thickness-related mode of nanoprisms (Figure 3c). In Figure 2a, the weaker oscillation frequencies are densely distributed around the thickness-related mode (vertically confined mode) of a silver thin film with thickness T = 6.8 nm (denoted by a black dashed line), and for every frequency, it seems to converge to the oscillation frequency (0.295 THz) of a thinfilm as the bisector length L increases, due to increasing decoupling of the laterally and vertically confined modes. Figure 2b shows that the lower-frequency modes (which depend on the bisector length) do not have significant changes, but the higher-frequency modes and the thickness-related mode of the silver thin film have similar frequency shifting as the thickness T increases. Figure 2 indicates that the contribution of the thickness-related modes to oscillation spectra becomes significant for nanoprisms with a smaller κ.
Next, we compare our calculated results with the experimental data. The silver nanoprisms were synthesized by us using a wet chemical method described previously. The out-of-plane quadrupole resonance at 340 nm, in-plane quadrupole resonance at 470 nm and broad in-plane dipole resonance at 660 nm are clearly observed in the extinction spectrum of nanoprisms, as shown in Figure 4b. The dimensions of synthesized silver nanoprisms with 43.1± 8.6 nm bisector length and 7.0 ± 0.8 nm thickness were determined from TEM images (Figure 4a), and the histograms of the bisector length and thickness are shown in
Figure 4c and d. The transient absorption time traces for silver nanoprisms with an excitation and probe wavelength at 670 nm Figure 4.(a) TEM image of the silver nanoprisms. (b) Absorption spectrum of the silver nanoprisms. (c, d) The size distributions of the bisector length and thickness.
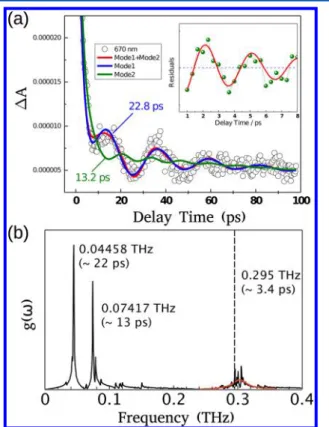
Figure 5.(a) The observed transient absorption trace with an excitation wavelength at 670 nm at a pump power of 0.5μJ. The red curve is fitted by eq 5 with periods of 22.8± 0.16 and 13.0 ± 0.29 ps corresponding to the breathing mode and the totally symmetric mode, respectively. The inset shows the high frequency mode with a period of 2.96± 0.085 ps. (b) The normalized oscillation spectrum for the silver nanoprism with L = 44.5 nm and T = 6.8 nm. The group of thickness-related oscillations isfitted by a Lorentzian function with fwhm = 0.028 THz (shown as a red curve in part b).
and a pump power of 0.5 μJ are shown in Figure 5a. Our experimental data curves werefitted by the following equation:
τ τ π τ ϕ τ π τ ϕ τ π τ ϕ τ − + − + + − + + − + + − − − A t A t A t t A t t A t t exp( / ) exp( / ) cos(2 / ) exp( / ) cos(2 / ) exp( / ) cos(2 / ) exp( / ) e e ph l ph sur br br br dbr
tot tot tot dtot
th th th dth (5)
Several parameters were used in the above equation, including the electron−phonon coupling time constant τe−ph, thermal
dissipation decay timeτph−sur, periods τbr/tot/th, damping times τdbr/dtot/dth, and phases φbr/tot/th for three damped oscillations.
The oscillation periods were determined by ignoring the last term in eq 5first and fitting the data with τbr= 22.8± 0.16 ps for
the breathing mode and τtot= 13.0 ± 0.29 ps for the totally symmetric mode. In Figure 5b, the oscillation spectrum of a relaxed silver nanoprism of L = 44.5 nm and T = 6.8 nm shows that the calculated periods areτbr= 22.4 ps andτtot= 13.5 ps,
respectively. The calculated results are in excellent agreement with experimental data. After subtracting the above two main components from the observed time trace, the high-frequency oscillation component with a periodτth= 2.96 ps (0.338 THz)
andτdth= 6.65± 2.77 ps can be identified as shown in the inset of Figure 5a, and the component corresponds to the thickness-related mode of the nanoprism. Here, a shortτdthcorresponds to a broad peak in frequency domain with a full width at half-maximum (fwhm) ofΔf = 0.048 ± 0.013 THz. The calculated average period for the group of thickness-related modes shown in
Figure 5b is estimated to be 3.29 ps (0.304 THz) with a fwhm of Δf = 0.028 ± 0.002 THz. It should be noted that the theoretical results are calculated on the basis of the oscillation of a single nanoprism with a smaller friction, and thus, the homogeneous and inhomogeneous damping were not included. Therefore, the experimental results (which are taken from a collection of nanoprisms in water solution) are broader as compared with theoretical results and τdth includes the combined effect due to homogeneous and
inhomogeneous contributions, and the spread of thickness-related modes. Both experimental and calculated results show that the frequency of the thickness-related mode in the nanoprism is higher than in a 6.8 nm thinfilm. This behavior can be ascribed to the strong coupling of the out-of-plane oscillation associated with a thickness confined mode with many laterally confined modes.
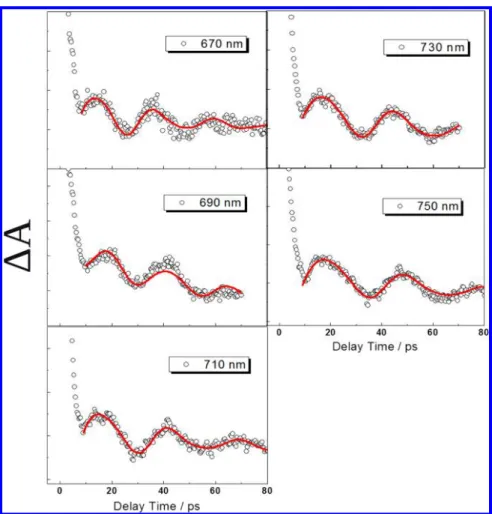
The transient absorption traces of different probe wavelengths and the deduced high frequency oscillation components within 8 ps are shown in Figures 6 and 7, respectively. The period versus probe wavelength results for the breathing mode, totally symmetric mode, and thickness-related mode are presented in Figure 8. The periods of the breathing mode and totally symmetric mode clearly increase as the probe laser is tuned from short to longer wavelength, which could be attributed to that longer wavelength light interrogate larger nanoprisms (i.e., longer edge length and bisector) in the inhomogeneous samples. Similar results were observed in gold nanorods.14In contrast, for the thickness-related mode, the period is relatively insensitive to the probe wavelength.
For a crystalline silver nanoprism, the oscillations for the breathing modes, the totally symmetric modes, and the thickness-related modes correspond to sound wave propagating along the [12̅1], [101̅], and [111] directions, respectively. The estimated Figure 6.The observed transient absorption time trace with different excitation wavelengths at a pump power of 0.5 μJ. The red curve is fitted by eq 5.
transverse (VT) and longitudinal (VL) sound velocities obtained from the LREP model for silver vibrational modes along these directions are shown in Table 2. According to our previous 2D study,30the estimated sound velocity for the breathing mode in our experimental sample Vbris about 3786± 755 m/s and that for the totally symmetric mode Vtotis about 3829± 796 m/s. The error of
sound speeds mainly results from the size distribution of the sample. On the basis of Figure 5b, the theoretical Vbrand Vtotare 3968 and
3811 m/s, respectively. The results are consistent with the longitudinal sound wave propagating along the [12̅1] and [101̅] directions (Table 2), and these velocities are faster than the longitudinal velocity for polycrystalline silver (3650 m/s). The results indicate that the sound velocity anisotropy along different crystal axes can be observed experimentally and theoretically. Although the estimated sound velocity for the high-frequency oscillation component Vthis about 4730± 558 m/s which is 16%
faster than VL along the [111] direction due to the collective effect of multiple thickness-related modes, however, according to
Figure 2a, we expect that the Vthwill converge to VLalong the [111] direction as L (κ) increases. On the basis of Figure 2b, the estimated sound velocity for the vertical mode in a thin silverfilm is about 3993 m/s. We have also found that with a large aspect ratio the ratio of the oscillation periods for the breathing mode versus the totally symmetric mode is close to√3, yet this ratio becomes smaller than√3 if the triangle side length decreases.
To obtain a detailed understanding about the influence of anisotropy of silver nanoprisms with a smaller aspect ratio on the characteristic of vibrational modes, we have to identify and analyze the vibrational modes involved in the oscillation spectra. The eigenfrequencies of nanoprisms with various sizes are obtained by diagonalizing the dynamic matrix DNP. By employing
point group theory, all vibrational modes are classified according to three irreducible representations of the C3vgroup, and only the modes with A1symmetry are considered in this study when the
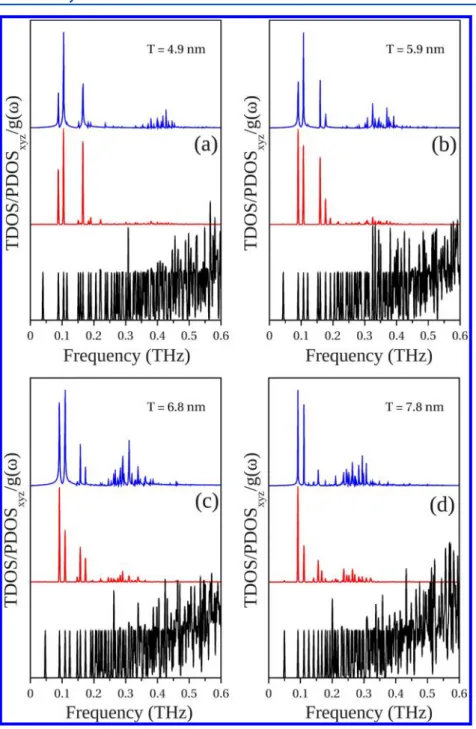
symmetric expansion as an initial condition of the SMD simulations. The comparison between the total density of states (TDOS), projected density of states (PDOS), and oscillation spectra is shown in Figure 9. The nanoprism sizes are the same as in Figure 2b. A Gaussian broadening of 0.00125 THz is used in the calculation of density of states.
Figure 7.The deduced high frequency oscillation components (circles) within 8 ps andfitting curve (red lines).
Figure 8. Period versus pump−probe laser wavelength for silver nanoprisms. The periods of the breathing mode and totally symmetric mode increase as the probe wavelength increases. The thickness-related mode is insensitive to the probe wavelength.
Table 2. The Transverse (VT) and Longitudinal (VL) Sound
Velocities (m/s) Calculated from the LREP Modela
symmetry direction LREP model Expt. (at 0 K) [101̅] VT1 1297 1268 VT2 2102 2192 VL 3905 3945 [12̅1] VT1 1570 1581 VT2 1873 1934 VL 3922 3967 [111] VT1 1611 1635 VT2 1611 1635 VL 4020 4078
aThe experimental values are calculated from the experimental elastic constants.29
Since the few lowest A1modes (<0.2 THz) look like discrete
states, well separated in frequency from other states, the vibrational modes corresponding to the dominant oscillation frequencies can be easily identified from TDOS. However, for higher-frequency modes (>0.2 THz), the density of states of those vibrational modes tends to form a continuous spectrum (black lines in Figure 9). To identify the involved modes accurately, a detailed analysis of the properties of the modes such as the displacement of atoms is required. We assume that the vibrational modes observed in oscillation spectra should possess a larger in-phase radial displacement, so the radial projected density of states PDOSxyzare calculated by the following:
∑
ω = P ω δ ω−ω PDOS ( )xyz ( ) ( ) j j j (6)∑
ω = | ⇀ ⇀ · ̂|ψ Pj( ) ( )r r i N j i i 2where Pj is the radial projection coefficient and⇀ ⇀ψj( )ri is the
displacement of the atom i associated with frequencyωj. The
vibrational mode with index j is labeled asνj.
From comparison between oscillation spectra (blue lines) and PDOSxyz(red lines) in Figure 9, vibrational modes correspond-ing to the dominant modes and thickness-related modes can be identified accurately after considering the characteristics of vibrational modes. Figure 9 shows their dominant oscillation frequencies in spectra associated with theν2,ν3,ν6, andν7modes (ν2,ν3, andν7for T = 4.9 nm,ν2,ν3,ν6, andν7for T = 5.9 and
6.8 nm, andν2,ν3, andν6for T = 7.8 nm). These results verify that theν2andν3modes are the two closely spaced breathing
Figure 9.Oscillation spectra (blue lines), radial projected density of states PDOSxyz(red lines), and total density of states TDOS (black lines) of
vibrational modes with A1symmetry for silver nanoprisms of L = 19.6 nm and (a) T = 4.9 nm, (b) T = 5.9 nm, (c) T = 6.8 nm, and (d) T = 7.8 nm,
modes and theν6andν7modes are the two closely spaced totally
symmetric modes in Figure 2b. It should be noted that the lowest vibrational mode in each nanoprism with different particle sizes is an“invisible” high-angular momentum mode, which cannot be excited by the totally symmetric expansion due to their much smaller in-phase radial displacement.18
To illustrate the properties of involved modes in detail, the projected density of states for the in-plane (PDOSxy) and
out-of-plane (PDOSz) displacements for four different thicknesses are
shown in Figure 10. PDOSxyand PDOSzare normalized with
respect to the largest amplitude of PDOSxyz. The comparison between PDOSxyz(black lines) and PDOSxyindicates that the dominant modes are the in-plane modes, and the out-of-plane component has a minor effect on PDOSxyz. PDOSzshows that
the thickness-related higher-frequency modes have a significant out-of-plane component, and thus, they correspond to confined
longitudinal modes. PDOSxy and PDOSz show that the
contribution of weaker higher-frequency modes becomes significant when T is increased due to the strong coupling between the in-plane and out-of-plane modes. The results are consistent with the observation in Figure 2.
The normalized displacement patterns for ν2,ν3,ν6, andν7
modes in a silver nanoprism with L = 19.6 nm and T = 5.9 nm at different z values are presented in Figure 11. The displacement patterns are divided into two parts: an in-plane component (Figure 11a) and an out-of-plane component (Figure 11b), and the largest in-plane and out-of-plane components in each mode are normalized to 1, separately. As illustrated in Figure 11a, each layer exhibits different in-plane displacement patterns, since the C3vgroup has no horizontal reflection plane perpendicular to the
z-axis. The displacement pattern for a C3vnanoprism presented
at the top (z = 0) and bottom (z = 5.9 nm) layers shows a larger Figure 10.Normalized PDOSxyz(black lines), PDOSxy(blue lines), and PDOSz(red lines) of vibrational modes with A1symmetry for silver nanoprisms
of L = 19.6 nm and (a) T = 4.9 nm, (b) T = 5.9 nm, (c) T = 6.8 nm, and (d) T = 7.8 nm. The weaker PDOSzhas been magnified 30 times. The
contribution of weaker thickness-related modes increases when T is increased due to the enhanced coupling between the in-plane and out-of-plane oscillations.
difference from the patterns for a D3h nanoprism using the
isotropic elastic model.4 It is indicated that the anisotropy of silver nanoprisms has a significant impact on the displacement of the atoms on the largest nanoprism surface. However, for the patterns at z = 2, 3, and 4 nm, in general, theν2andν3modes correspond to a large displacement at the three corners, and the ν6andν7modes correspond to a large in-plane displacement at
the edge centers. These observations are similar to Bonacina’s results. We conclude that, even though multiple dominant modes can be observed in nanoprisms with a smallerκ, these modes can still be classified as breathing modes or totally symmetric modes. In Figure 11b, the diversity of the out-of-plane component pattern between each layer seems smaller than the in-plane component, especially forν2andν3breathing modes. Theν2and ν3modes have a large out-of-plane displacement at the center of
the largest nanoprism surface and the triangular tips, while theν6
andν7modes have the large displacement concentrated at the tips only. It is noted that the out-of-plane component is not always weaker than the in-plane component; however, these out-of-plane components correspond to smaller in-phase oscillations. Thus, the out-of-plane component has a minor impact on the PDOSxyz, as shown in Figure 10.
■
CONCLUSIONSA large-scale realistic SMD method has been proposed to study the laser-induced structural dynamics of silver nanoprisms. The reliability of this method has been verified experimentally by our time-resolved pump−probe measurements. We determined the mode frequencies for the most prominent planar and vertical modes which are related to the sound velocity along different crystal axes are different from the usual angle-averaged bulk value obtained for polycrystalline samples. The calculated results indicated that the lattice oscillations of silver nanoprisms induced by the symmetric expansion correspond to the excitation of the A1modes with the largest in-phase radial displacement of the atoms, and these involved modes can be classified into three main types: the breathing modes, the totally symmetric modes, and the thickness-related modes. For nanoprisms with a larger aspect ratio, the observation is consistent with calculations for the isotropic elastic model with D3h symmetry. However, multiple dominant modes and the anisotropic effect can appear in the vibrational
pattern of the nanoprisms with a smaller aspect ratio. A group of highly concentrated thickness-related modes can be excited in silver nanoprisms. A broad oscillation peak, which has been observed in our experiment as a damped oscillation with period, is consistent with our model calculation.
■
AUTHOR INFORMATIONCorresponding Author
*E-mail: jautang@gate.sinica.edu.tw (J.T.); yiachang@gate. sinica.edu.tw (Y.-C.C.).
Notes
The authors declare no competingfinancial interest.
■
ACKNOWLEDGMENTSWork supported in part by the National Science Council of Taiwan under Contract Nos. NSC99-2221-E-001-002-MY and NSC101-2112-M-001-024-MY3. M.-Y.N. thanks his colleagues in the National Center for Theoretical Science (south) for constant support and help.
■
REFERENCES(1) Hartland, G. Phys. Chem. Chem. Phys. 2004, 6, 5263−5274. (2) Devos, A.; Poinsotte, F.; Groenen, J.; Dehaese, O.; Bertru, N.; Ponchet, A. Phys. Rev. Lett. 2007, 98, 207402.
(3) Jerebtsov, S.; Kolomenskii, A.; Liu, H.; Zhang, H.; Ye, Z.; Luo, Z.; Wu, W.; Paulus, G.; Schuessler, H. Phys. Rev. B 2007, 76, 184301.
(4) Bonacina, L.; Callegari, A.; Bonati, C.; Van Mourik, F.; Chergui, M. Nano Lett. 2006, 6, 7−10.
(5) Zijlstra, P.; Tchebotareva, A.; Chon, J.; Gu, M.; Orrit, M. Nano Lett. 2008, 8, 3493−3497.
(6) Wang, L.; Kiya, A.; Okuno, Y.; Niidome, Y.; Tamai, N. J. Chem. Phys. 2011, 134, 054501−054501.
(7) Staleva, H.; Hartland, G. Adv. Funct. Mater. 2008, 18, 3809−3817. (8) Burgin, J.; Langot, P.; Del Fatti, N.; Vallée, F.; Huang, W.; El-Sayed, M. J. Phys. Chem. C 2008, 112, 11231−11235.
(9) Tai, P.; Yu, P.; Tang, J. J. Chem. Phys. 2011, 134, 184506. (10) Ponomareva, I.; Srivastava, D.; Menon, M. Nano Lett. 2007, 7, 1155−1159.
(11) Owrutsky, J.; Pomfret, M.; Brown, D. J. Phys. Chem. C 2009, 113, 10947−10955.
(12) Tai, P.; Yu, P.; Huang, J.; Tang, J. Chem. Phys. Lett. 2010, 496, 326−329.
(13) Hartland, G. J. Chem. Phys. 2002, 116, 8048−8055.
Figure 11.(a) In-plane component and (b) out-of-plane component of normalized displacement patterns of four dominant vibrational modes in a silver nanoprism with L = 19.6 nm and T = 5.9 nm at different z values. Each layer exhibits different displacement patterns, since the nanoprism with C3v
(14) Hartland, G. V.; Hu, M.; Wilson, O.; Mulvaney, P.; Sader, J. E. J. Phys. Chem. B 2002, 106, 743−747.
(15) Chen, J.; Chen, W.-K.; Tang, J.; Rentzepis, P. M. Proc. Natl. Acad. Sci. U.S.A. 2011, 108, 18887−18892.
(16) Fedou, J.; Viarbitskaya, S.; Marty, R.; Sharma, J.; Paillard, V.; Dujardin, E.; Arbouet, A. Phys. Chem. Chem. Phys. 2013, 15, 4205−4213. (17) Major, T.; Devadas, M.; Lo, S.; Hartland, G. J. Phys. Chem. C 2013, 117 (3), 1447−1452.
(18) Ng, M.-Y.; Chang, Y.-C. J. Chem. Phys. 2011, 134, 094116. (19) Dai, X. D.; Kong, Y.; Li, J. H. Phys. Rev. B 2007, 75, 104101. (20) Koster, G.; Dimmock, J.; Wheeler, R.; Statz, H. Properties of the 32 Point Groups; MIT Press: Cambridge, MA, 1963.
(21) Tinkham, M. Group Theory and Quantum Mechanics; Dover Publications: Mineola, New York, 2003.
(22) Perner, M.; Gresillon, S.; März, J.; von Plessen, G.; Feldmann, J.; Porstendorfer, J.; Berg, K.-J.; Berg, G. Phys. Rev. Lett. 2000, 85, 792−795. (23) Hu, J.; Cai, W.; Li, C.; Gan, Y.; Chen, L. Appl. Phys. Lett. 2005, 86, 151915.
(24) Del Fatti, N.; Voisin, C.; Chevy, F.; Vallée, F.; Flytzanis, C. J. Chem. Phys. 1999, 110, 11484.
(25) Pelton, M.; Sader, J. E.; Burgin, J.; Liu, M.; Guyot-Sionnest, P.; Gosztola, D. Nat. Nanotechnol. 2009, 4, 492−495.
(26) Yu, P.; Tang, J.; Lin, S.-H. J. Phys. Chem. C 2008, 112, 17133− 17137.
(27) Métraux, G. S.; Mirkin, C. A. Adv. Mater. 2005, 17, 412−415. (28) Petrova, H.; Lin, C.; de Liejer, S.; Hu, M.; McLellan, J.; Siekkinen, A.; Wiley, B.; Marquez, M.; Xia, Y.; Sader, J.; Hartland, G. J. Chem. Phys. 2007, 126, 094709.
(29) Kittel, C.; McEuen, P. Introduction to Solid State Physics; Wiley: New York, 2005.