patient-oriented and epidemiological research
Apolipoprotein B and non-high density lipoprotein
cholesterol and the risk of coronary heart disease
in Chinese
Kuo-Liong Chien,
1,*
,†,§Hsiu-Ching Hsu,
†Ta-Chen Su,
†Ming-Fong Chen,
†Yuan-Teh Lee,
1,†,**
and Frank B. Hu
§Institute of Preventive Medicine,* College of Public Health, National Taiwan University, Taipei, Taiwan;
Department of Internal Medicine,
†National Taiwan University Hospital, Taipei, Taiwan; Department
of Nutrition,
§School of Public Health, Harvard University, Boston, MA; and Ming-Shen Medical Center,**
Taoyuang, Taiwan
Abstract
The aim of our study was to compare
apolipo-protein B (apoB), non-high density lipoapolipo-protein cholesterol
(nonHDL-C), low density lipoprotein cholesterol (LDL-C),
and other lipid markers as predictors of coronary heart
dis-ease (CHD) in Chinese. Overall, 122 individuals developed
CHD during a median 13.6 years of follow-up in 3,568 adult
participants from a community-based cohort. The
multivari-ate relative risk of CHD in the highest quintile compared with
the lowest quintile was 2.74 [95% confidence interval (CI),
1.45–5.19] for apoB, 1.98 (95% CI, 1.00–3.92) for
nonHDL-C, and 1.86 (95% CI, 1.00–3.49) for LDL-C (all tests for trend,
P , 0.05). ApoB also had the highest receiver operator
char-acteristic curve area (0.63; 95% CI, 0.58–0.68) in predicting
CHD. When apoB and nonHDL-C were mutually adjusted,
only apoB was predictive; the relative risk was 2.80 (95% CI,
1.31–5.96; P 5 0.001) compared with 1.09 (95% CI, 0.49–2.40;
P 5 0.75) for nonHDL-C. Compared with the lowest risk,
par-ticipants with the highest apoB and total cholesterol/HDL-C
had a 3-fold increased risk of developing CHD (relative risk 5
3.21; 95% CI, 1.45–7.14).
These data provide strong
evi-dence that apoB concentration was a better predictor of
CHD than other lipid markers in Chinese.—Chien, K-L., H-C.
Hsu, T-C. Su, M-F. Chen, Y-T. Lee, and F. B. Hu.
Apolipo-protein B and non-high density lipoApolipo-protein cholesterol and
the risk of coronary heart disease in Chinese. J. Lipid Res.
2007. 48: 2499–2505.
Supplementary key words lipids & lipoproteins & apolipoproteins & risk factors
Increased low density lipoprotein cholesterol (LDL-C)
concentrations are a well-established risk factor for
coro-nary heart disease (CHD) and are currently recommended
as the primary target for lipid-lowering therapy for the
prevention and treatment of cardiovascular disease)(1).
However, recent evidence suggests that apolipoproteins,
especially apolipoprotein B (apoB), may be more strongly
associated with CHD incidence than LDL (2, 3).
Apolipo-protein plays a role in transporting lipid particles and is
considered a direct measurement of proatherogenic
par-ticles (3, 4). In addition, non-high density lipoprotein
cho-lesterol (nonHDL-C; calculated as the difference between
total cholesterol and HDL cholesterol), reflecting the
cholesterol concentration of all atherogenic lipoproteins,
has also been demonstrated to predict CHD risk (5, 6).
NonHDL-C has been recommended as a target for
pri-mary prevention among patients with diabetes or high
triglyceride (TG) levels (1, 7). However, the superiority of
LDL-C, apoB, and nonHDL-C in predicting CHD remains
unsettled (8, 9). Furthermore, to our knowledge, no
pre-vious study has directly compared the predictive capacity
of these biomarkers in Asian populations. Therefore,
we conducted a prospective study to examine the role of
apoB, nonHDL-C, and LDL-C in predicting CHD
inci-dence among ethnic Chinese in Taiwan.
METHODS
Study design and study population
Details of this cohort study have been published previously
(10–12). Briefly, the Chin-Shan Community Cardiovascular
Co-hort Study began in 1990 by recruiting 1,703 men and 1,899
women >35 years old, homogeneous in Chinese ethnicity, and
living in the Chin-Shan township 30 km north of metropolitan
Manuscript received 8 May 2007 and in revised form 5 July 2007 and in re-revised form 3 August 2007.
Published, JLR Papers in Press, August 13, 2007. DOI 10.1194/jlr.M700213-JLR200
Abbreviations: apoB, apolipoprotein B; CHD, coronary heart dis-ease; LDL-C, low density lipoprotein cholesterol; nonHDL-C, non-high density lipoprotein cholesterol; ROC, receiver operator characteristic; TC, total cholesterol; TG, triglyceride.
1To whom correspondence should be addressed.
e-mail: [email protected] (K-L.C.); [email protected] (Y-T.L.)
at National Taiwan Univ. on April 29, 2009
www.jlr.org
Taipei, Taiwan. Information about anthropometry, lifestyle, and
medical conditions was assessed by interview questionnaires in
2 year cycles, and the validity and reproducibility of the collected
data and measurements have been reported in detail elsewhere
(12). In follow-up of the cohort through 2005 (median 13.6 years),
we identified 122 incident cases of CHD (79 men, 43 women),
defined as nonfatal myocardial infarction, fatal CHD, or
hospi-talization for percutaneous coronary intervention and coronary
bypass surgery. Deaths were identified from official death
cer-tificates and further verified by house-to-house visits. Fatal CHD
was considered to have occurred if there was fatal myocardial
infarction confirmed by hospital records, or if CHD listed as the
cause of death on the death certificate was the underlying and
most plausible cause of death, or if evidence of previous CHD
was available. The National Taiwan University Hospital
Com-mittee Review Board approved the study protocol. All
partici-pants provided oral informed consent when they were recruited
into the study in 1990.
All venous blood samples drawn after a 12 h overnight fast
were immediately refrigerated and transported within 6 h to
National Taiwan University Hospital. Serum samples were then
stored at 270jC before batch assay for levels of total
choles-terol (TC), TG, HDL-C, apoA-I, and apoB. Standard enzymatic
tests for serum cholesterol and TG were used (Merck 14354 and
14366, respectively). HDL-C levels were measured in supernatants
after the precipitation of specimens with magnesium chloride
phosphotungstate reagents (Merck 14993). LDL-C concentrations
were calculated as TC minus cholesterol in the supernatant by
the precipitation method (Merck 14992). ApoA-I and apoB
con-centrations were measured by turbidimetric immunoassay with
commercial kits (Sigma). NonHDL-C was calculated by
subtract-ing HDL-C from TC. A total of 3,568 participants with blood
TABLE 1. Distribution of various baseline demographic, lifestyle, and socioeconomic factors in the study population in the CCCC (1990–1991), specified by apoB quintiles
Quintiles Variable 1 (n 5 721) 2 (n 5 682) 3 (n 5 700) 4 (n 5 680) 5 (n 5 685) P % Women 51.0 55.9 48.7 55.7 55.9 0.013 Age (years) ,0.0001 35–44 30.6 28.7 24.0 23.1 19.4 45–54 25.7 23.7 25.0 25.6 25.7 55–64 22.6 24.0 29.0 27.4 27.2 65–74 13.6 14.3 17.3 19.0 19.7 >75 7.5 9.4 4.7 5.0 8.0
Body mass index (kg/m2) ,0.0001
,18 6.5 3.8 3.7 2.4 1.8
18–20.9 29.5 23.3 18.5 16.0 10.7
21–22.9 28.8 25.9 24.1 23.2 20.4
23–24.9 19.1 20.9 21.7 23.8 23.3
>25 16.2 26.1 32.0 34.7 43.8
Current smoker (yes) 36.8 33.3 38.3 36.0 35.0 0.378
Alcohol drinking (yes) 29.4 25.8 31.6 30.6 30.5 0.157
Marital status 0.003
Single 4.2 2.5 3.0 1.8 2.5
Living with spouse 86.4 86.0 88.6 84.2 83.9
Divorced or separated 9.5 11.5 8.4 14.0 13.6 Education level 0.938 ,9 years 94.7 94.6 94.1 94.3 93.7 >9 years 5.3 5.4 5.9 5.7 6.3 Job status 0.000 No job 46.5 50.9 48.0 52.2 54.7 Blue collar 39.9 34.6 36.0 31.3 27.0 White collar 13.6 14.5 16.0 16.5 18.3
Regular exercise (yes) 12.6 14.8 15.4 15.4 16.4 0.354
Family history of CHD 9.0 8.1 10.0 9.6 11.7 0.228
Hypertension 21.5 27.3 28.2 32.3 43.0 ,0.0001
Diabetes mellitus 8.8 9.1 12.0 17.0 19.9 ,0.0001
Variable Mean SD Mean SD Mean SD Mean SD Mean SD P
Age 53.6 12.6 54.6 13.2 54.8 11.7 55.1 11.7 56.6 12.1 0.0002
Body mass index 22.2 3.1 23.1 3.3 23.6 3.4 24.0 3.5 24.6 3.4 ,0.0001
Lipid profiles TC 163.3 31.9 185.3 32.8 197.3 37.4 210.6 40.1 234.1 48.3 ,0.0001 TG 93.4 81.1 103.6 78.4 118.8 84.2 138.3 92.3 178.7 113 ,0.0001 HDL-C 51.4 13.1 49.6 13.5 47.6 13.6 45.1 10.8 43.4 10.4 ,0.0001 LDL-C 100.4 29.1 124.0 29.6 137.8 34.2 152.5 37.0 176.5 46.6 ,0.0001 NonHDL-C 111.7 30.1 135.7 30.7 149.4 35.4 165.4 38.8 190.5 47.5 ,0.0001 TC/HDL-C 3.34 1.01 3.96 1.10 4.41 1.34 4.89 1.36 5.64 1.58 ,0.0001 ApoA-I 129.3 29.4 128.8 26.2 131.4 26.7 136.8 58.0 141.8 27.2 ,0.0001 ApoB 56.5 9.1 75.2 4.3 90.6 4.6 108.6 6.3 144.0 21.1 ,0.0001 ApoB/apoA-I 0.46 0.12 0.61 0.13 0.72 0.15 0.83 0.16 1.05 0.22 ,0.0001
ApoB apolipoprotein B; CCCC, Chin-Shan Community Cardiovascular Cohort; CHD, coronary heart disease; HDL-C, high density lipoprotein cholesterol; LDL-C, low density lipoprotein cholesterol; nonHDL-C, non-high density lipoprotein cholesterol; TC, total cholesterol; TG, triglyceride.
at National Taiwan Univ. on April 29, 2009
www.jlr.org
lipid data and free from cardiovascular disease at baseline were
included in the study.
Statistical analysis
Participants were categorized on the basis of quintile of apoB
levels, and continuous variables are presented by mean, standard
deviation, or median levels; categorical data are presented in
contingency tables, with ANOVA to test for differences among
quintiles. Relationships between lipid marker levels were
ex-amined by the age- and gender-adjusted Spearman’s partial
cor-relation coefficients.
CHD incidence rates were calculated by person-year methods
and stratified by various lipid marker quintiles. We analyzed the
association between lipid levels and risk of CHD using the Cox
regression model, adjusting for potential confounding factors.
The proportionality assumption and the fit of the proportional
hazards model were verified by the Grambsch and Therneau
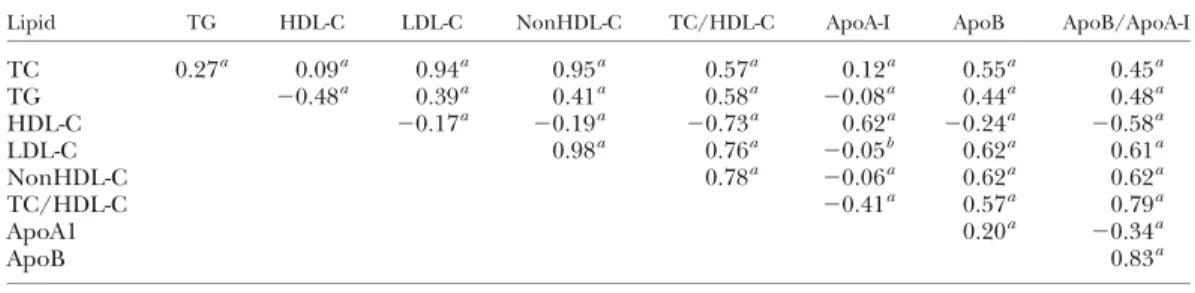
sta-TABLE 2. Age- and gender-adjusted Spearman partial correlation coefficients between various lipid profiles among the study subjects in the CCCC
Lipid TG HDL-C LDL-C NonHDL-C TC/HDL-C ApoA-I ApoB ApoB/ApoA-I
TC 0.27a 0.09a 0.94a 0.95a 0.57a 0.12a 0.55a 0.45a TG 20.48a 0.39a 0.41a 0.58a 20.08a 0.44a 0.48a HDL-C 20.17a 20.19a 20.73a 0.62a 20.24a 20.58a LDL-C 0.98a 0.76a 20.05b 0.62a 0.61a NonHDL-C 0.78a 20.06a 0.62a 0.62a TC/HDL-C 20.41a 0.57a 0.79a ApoA1 0.20a 20.34a ApoB 0.83a a P , 0.001. b P , 0.01.
TABLE 3. Relative risks (and 95% CI values) of CHD during a median 13.6 years of follow-up according to quintiles of baseline lipid profiles in 1990–1991 in the CCCC study 1 2 3 4 5 Trend Test TC 145 172 193 217 258 Incidence rate 2 1.8 3.3 2.4 4 Model 1 1 0.91(0.46—1.78) 1.65(0.91—2.98) 1.15(0.61—2.15) 1.93(1.08—3.44) 0.014 Model 2 1 0.91(0.46—1.80) 1.54(0.84—2.82) 1.02(0.54—1.94) 1.64(0.90—2.97) 0.08 TG 54 76 99 133 231 Incidence rate 1.4 2.8 2.1 2.7 4.5 Model 1 1 1.88(0.96—3.66) 1.43(0.71—2.90) 1.80(0.91—3.57) 3.13(1.66—5.87) 0.000 Model 2 1 1.74(0.89—3.39) 1.15(0.56—2.35) 1.19(0.59—2.41) 2.05(1.06—3.97) 0.07 HDL-C 64 53 46 41 33 Incidence rate 1.6 1.4 2.2 3.2 4.9 Model 1 1 0.73(0.46—1.17) 0.51(0.30—0.89) 0.33(0.17—0.63) 0.39(0.21—0.71) ,.0001 Model 2 1 0.85(0.53—1.38) 0.63(0.36—1.11) 0.45(0.23—0.86) 0.55(0.29—1.04) 0.013 LDL-C 87 112 134 158 197 Incidence rate 1.8 1.6 2.7 2.8 4.7 Model 1 1 0.88(0.43—1.80) 1.48(0.78—2.79) 1.57(0.83—2.97) 2.50(1.38—4.51) 0.000 Model 2 1 0.80(0.38—1.67) 1.31(0.68—2.52) 1.27(0.65—2.47) 1.86(1.00—3.46) 0.008 NonHDL-C 97 124 145 170 211 Incidence rate 1.5 2.1 2.4 3 4.5 Model 1 1 1.26(0.62—2.56) 1.51(0.75—3.05) 1.87(0.96—3.65) 2.71(1.43—5.15) 0.000 Model 2 1 1.16(0.56—2.41) 1.29(0.62—2.67) 1.51(0.75—3.05) 1.98(1.00—3.92) 0.016 TC/HDL-C 2.8 3.5 4.2 5 6.4 Incidence rate 1 1.7 2 3.3 5.5 Model 1 1 1.60(0.70—3.67) 1.89(0.84—4.21) 3.05(1.44—6.48) 4.38(2.14—8.98) ,.0001 Model 2 1 1.58(0.69—3.65) 1.59(0.70—3.61) 2.38(1.09—5.19) 3.04(1.42—6.50) 0.001 ApoA-I 169 146 131 117 101 Incidence rate 1.4 2.4 3.1 3.1 3.4 Model 1 1 1.02(0.61—1.72) 1.09(0.64—1.86) 0.91(0.51—1.62) 0.54(0.27—1.06) 0.08 Model 2 1 1.17(0.69—2.00) 1.30(0.75—2.25) 1.08(0.60—1.94) 0.68(0.34—1.36) 0.32 ApoB 58 75 91 108 139 Incidence rate 1.6 1.9 1.8 3 5.3 Model 1 1 1.22(0.60—2.47) 1.13(0.55—2.31) 1.92(1.00—3.68) 3.38(1.85—6.20) ,.0001 Model 2 1 1.18(0.57—2.44) 1.03(0.49—2.16) 1.67(0.85—3.30) 2.74(1.45—5.19) ,.0001 ApoB/apoA-I 0.43 0.57 0.69 0.84 1.07 Incidence rate 1.5 1.6 2 2.1 6.4 Model 1 1 1.02(0.48—2.16) 1.29(0.63—2.63) 1.27(0.62—2.60) 3.57(1.95—6.57) ,.0001 Model 2 1 0.91(0.43—1.95) 1.10(0.53—2.28) 0.89(0.42—1.88) 2.61(1.38—4.95) ,.0001
CI, confidence interval. Incidence rates are presented per 1,000 person-years. Model 1: adjusted for age groups (35–44, 45–54, 55–64, 65–74, or >75 years old) and gender. Model 2: as for model 1 plus body mass index (,18, 18–20.9, 21–22.9, 23–24.9, or >25 kg/m2), smoking (yes/no or abstinence), current alcohol drinking (regular/no), marital status (single, married and living with spouse, or divorced and living separately), education level (,9 years, at least 9 years), occupation (no work, labor, official, or business), regular exercise habit (yes/no), family history of CHD (yes/no), baseline hypertension (yes/no), and diabetes mellitus (yes/no).
at National Taiwan Univ. on April 29, 2009
www.jlr.org
tistics (13). We specified two Cox models to evaluate the
ad-justed relative risks of quintile values. Model 1 was adad-justed
for age groups (35–44, 45–54, 55–64, 65–74, and >75 years
old) and gender only. Model 2 included additional
confound-ing factors: body mass index (,18, 18–20.9, 21–22.9, 23–24.9,
or >25 kg/m
2), smoking (yes/no or abstinence), current
alco-hol drinking (regular/no), marital status (single, married and
living with spouse, or divorced and living separately), education
level (,9 years, at least 9 years), occupation (no work, labor,
of-fice, or business), regular exercise habit (yes/no), family history
of CHD (yes/no), baseline hypertension (yes/no, defined by
blood pressure of at least 140/90 mm Hg or on medication),
and diabetes mellitus (yes/no, defined by fasting plasma
glu-cose of at least 126 mg/dl or on medication). To test for linear
trends across lipid marker categories, we used the median lipid
profile levels within quintiles as a continuous variable. We also
tested the goodness of fit of the model using the Hosmer and
Lemeshow test (14).
We used the area under the curve of the receiver operator
characteristic (ROC curve) to compare the discriminative ability
of various risk factors (15). The area under the ROC curve was
considered a global performance indicator for a prognostic
fac-tor (16). In addition, likelihood ratio test statistics were used to
compare model fitting. We compared models with and without
the four dummy lipid profiles and conducted likelihood ratio
tests between nested models.
All statistical tests were two-tailed, and P , 0.05 was
consid-ered statistically significant. Analyses were performed with SAS
version 9.1 (SAS Institute, Cary, NC) and Stata version 9.1 (Stata
Corp., College Station, TX).
RESULTS
Participants with higher apoB levels were more likely
to be female and older. They were more likely to have
higher body mass index, hypertension, diabetes mellitus,
higher levels of TC, TG, LDL-C, nonHDL-C, TC/HDL-C,
apoA-I, and apoB/apoA-I, and significantly lower levels of
HDL-C. There were no statistical differences in lifestyle
factors such as smoking, alcohol consumption, and
exer-cise habits across various apoB quintiles (Table 1).
We found strong correlations among TC, LDL-C,
nonHDL-C, and TC/HDL-C, ranging from 0.76 to 0.98
(Table 2). HDL-C was inversely associated with other lipid
markers, except with apoA-I (r 5 0.62). The correlations
of apoB with other lipid markers were moderate,
rang-ing from 0.20 to 0.62.
Table 3 shows the relative risks of CHD during a
me-dian 13.6 years of follow-up across quintiles of lipid levels
at baseline. After multivariate adjustment, the lipid ratios,
such as TC/HDL-C and apoB/apoA-I, had the strongest
associations with CHD (relative risks in the highest
quin-tile 5 3.04 and 2.61). Among single lipid markers, apoB
showed the strongest association with CHD (relative risk 5
2.74). NonHDL-C was also strongly predictive of CHD,
with a multivariate risk similar to that of LDL (i.e., 1.98 vs.
1.86). The association of HDL-C with CHD was similar
to that seen with LDL; participants in the lowest quintile
had a 1.81-fold (1/0.55) higher risk of CHD than those
in the highest quintile. Figure 1 shows the cumulative
CHD event-free rates according to quintiles of apoB and
nonHDL-C. Compared with those in the lower quintiles,
participants with the highest apoB or nonHDL-C quintile
had significantly lower CHD event-free rates.
To determine the predictive values of various lipid
markers, we estimated the ROC curves and performed
likelihood ratio tests. Except for lipid ratios (TC/HDL-C
and apoB/apoA-I), both apoB and HDL-C showed greater
ROC and likelihood ratio Chi-square values than TC, TG,
LDL, or nonHDL-C (Table 4).
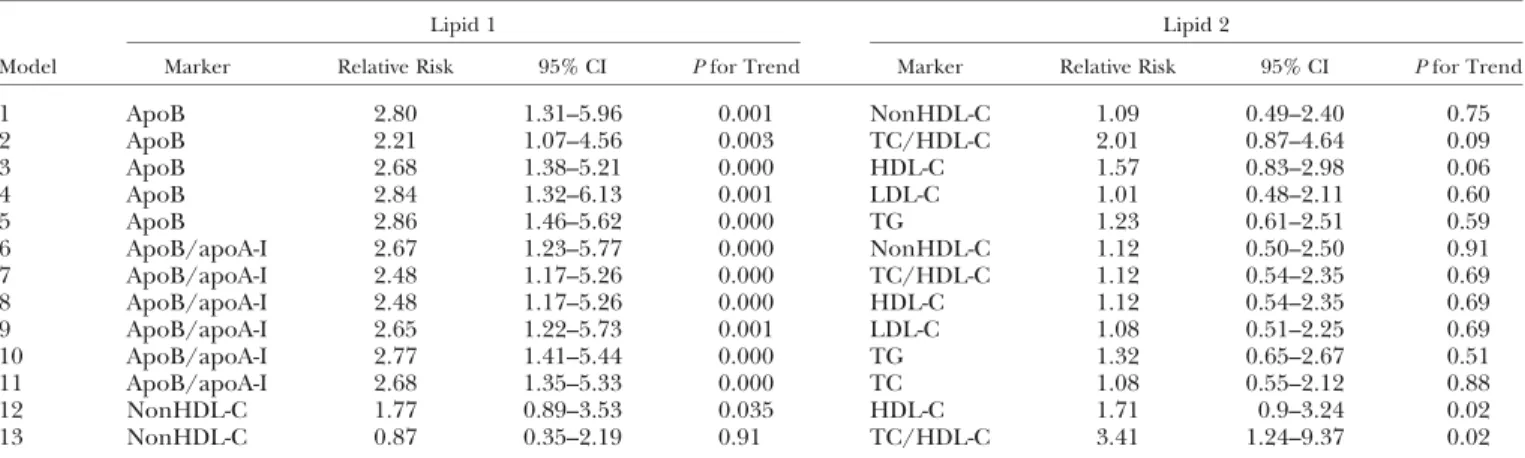
In mutually adjusted models, apoB and apoB/apoA-I
remained significant and strong risk factors for CHD,
whereas other lipid variables became nonsignificant
(Table 5). In joint analyses, participants in the highest
tertile of both apoB and TC/HDL ratio had .3-fold
greater risk of CHD than those in the lowest tertiles of
both variables (Fig. 2).
DISCUSSION
In this prospective cohort of middle-aged to older ethnic
Chinese, higher levels of apoB were strongly and
indepen-dently associated with increased future risk of CHD. ApoB
appeared to be a stronger predictor of CHD risk than LDL
or nonHDL-C. ApoB provided additional predictive power
beyond the TC/HDL ratio.
Fig. 1. Cumulative coronary heart disease (CHD) event-free rates according to quintiles of apolipoprotein B (apoB) (upper) and non-high density lipoprotein cholesterol (nonHDL-C) (lower).
at National Taiwan Univ. on April 29, 2009
www.jlr.org
Our results are consistent with previous studies
con-ducted in primarily white populations (17). In the Health
Professionals’ Follow-Up Study conducted in the United
States, apoB appeared to be the strongest predictor of
CHD among individual lipid factors (17). After
adjust-ment for matching factors, the relative risk of CHD in the
highest quintile compared with the lowest quintile was 2.76
[95% confidence interval (CI), 1.66–4.58] for nonHDL-C,
3.01 (95% CI, 1.81–5.00) for apoB, and 1.81 (95% CI, 1.12–
2.93) for LDL-C. As in our study, when apoB and nonHDL
or LDL were mutually adjusted, only apoB remained
sta-tistically significant. Three other studies have also found
strong and independent effects of apoB (18–20).
ApoB is synthesized by the liver, and because there is
one apoB molecule in each lipoprotein particle, apoB
re-flects the total number of chylomicrons, VLDL,
inter-mediate density lipoprotein, and LDL particles and can
be viewed as total atherogenic burden (3). In our study,
apoB was significantly related to CHD risk even after
adjust-ment for other lipid markers, such as LDL-C and nonHDL-C
values, despite its correlations with these markers.
Several studies have also suggested that nonHDL-C level
is a better predictor of CHD than LDL-C level. In a sample
of diabetic men, Jiang et al. (5) found that, after
adjust-ment for age, body mass index, and other lifestyle risk
factors, the multivariate relative risk of cardiovascular
dis-ease (the highest vs. the lowest quartile) was 2.34 (95% CI,
1.26–4.32) for nonHDL-C, 2.31 (95% CI, 1.23–4.35) for
apoB, and 1.74 (95% CI, 0.99–3.06) for LDL cholesterol.
The ROC areas were similar for apoB and nonHDL, and
both were greater than for LDL-C. NonHDL-C has also
been shown to be a strong predictor of cardiovascular
disease risk in diabetic patients in two other studies. In the
Strong Heart Study cohort, nonHDL-C was a stronger
predictor of cardiovascular disease than LDL-C in 2,108
American Indian men and women aged 45–74 years with
diabetes during an average of 9 years of follow-up (7).
In a Finnish cohort study of 1,059 middle-aged men and
women with type 2 diabetes, higher levels of nonHDL-C,
as well as low HDL-C and TGs, were each independently
associated with a 2-fold increased risk of CHD mortality
during 7 years of follow-up (21). But these two studies did
not compare the predictive values of apoB and nonHDL-C.
In our study, nonHDL-C was superior to LDL-C in
pre-dicting CHD risk, consistent with other studies (5, 22).
Because nonHDL-C is easily calculated and highly
corre-lated with apoB, it has been suggested that nonHDL-C can
be substituted for apoB as a predictor of CHD risk (8, 23).
However, our data showed that apoB was more strongly
related to CHD risk than was nonHDL-C. Several
sub-clinical disease studies provided evidence that apoB was
superior to nonHDL-C in reflecting carotid and coronary
artery atherosclerosis burden (24, 25). Our results support
the hypothesis that direct measurement of the
athero-genic particles (apoB concentration) is more biologically
meaningful than the measurement of the cholesterol
con-centration in these particles (nonHDL-C concon-centration)
(3, 17, 26). Neither nonHDL-C nor apoB measurements
require fasting samples. In clinical practice, nonHDL-C
is a simpler and more familiar approach to quantify all
TABLE 4. Area under the ROC curve and likelihood ratio test of various lipid profiles for CHD among the study subjects in the
CCCC (1990–2005)
Lipid
Area under the
ROC Curve 95% CI Likelihood Ratio Test TC 0.58 0.52–0.63 11.8 TG 0.59 0.54–0.64 17.0 HDL-C 0.62 0.57–0.68 26.7 LDL-C 0.60 0.55–0.65 17.9 NonHDL-C 0.60 0.55–0.65 16.3 TC/HDL-C 0.65 0.60–0.70 37.2 ApoA-I 0.57 0.52–0.62 9.0 ApoB 0.63 0.58–0.68 26.6 ApoB/apoA-I 0.66 0.60–0.71 44.1
ROC, receiver operator characteristic. Area under the ROC curve values are for a univariate model, with four dummy variables in the model. The likelihood ratio test compared the model with the corre-sponding marker and the model without the correcorre-sponding marker with 4 degrees of freedom.
TABLE 5. Combination of two lipid profiles adjusted for confounding factors in multivariable-adjusted models in the subjects
Lipid 1 Lipid 2
Model Marker Relative Risk 95% CI P for Trend Marker Relative Risk 95% CI P for Trend
1 ApoB 2.80 1.31–5.96 0.001 NonHDL-C 1.09 0.49–2.40 0.75 2 ApoB 2.21 1.07–4.56 0.003 TC/HDL-C 2.01 0.87–4.64 0.09 3 ApoB 2.68 1.38–5.21 0.000 HDL-C 1.57 0.83–2.98 0.06 4 ApoB 2.84 1.32–6.13 0.001 LDL-C 1.01 0.48–2.11 0.60 5 ApoB 2.86 1.46–5.62 0.000 TG 1.23 0.61–2.51 0.59 6 ApoB/apoA-I 2.67 1.23–5.77 0.000 NonHDL-C 1.12 0.50–2.50 0.91 7 ApoB/apoA-I 2.48 1.17–5.26 0.000 TC/HDL-C 1.12 0.54–2.35 0.69 8 ApoB/apoA-I 2.48 1.17–5.26 0.000 HDL-C 1.12 0.54–2.35 0.69 9 ApoB/apoA-I 2.65 1.22–5.73 0.001 LDL-C 1.08 0.51–2.25 0.69 10 ApoB/apoA-I 2.77 1.41–5.44 0.000 TG 1.32 0.65–2.67 0.51 11 ApoB/apoA-I 2.68 1.35–5.33 0.000 TC 1.08 0.55–2.12 0.88 12 NonHDL-C 1.77 0.89–3.53 0.035 HDL-C 1.71 0.9–3.24 0.02 13 NonHDL-C 0.87 0.35–2.19 0.91 TC/HDL-C 3.41 1.24–9.37 0.02
Results are from separate models of each combination of lipid profiles. Relative risk and 95% CI values are for the highest compared with the lowest quintile of each lipid profile. P for trend across quintiles of each profile was tested by replacing the median value as each quintile. Each lipid profile was added to the model in the quintile with four dummy variables. Adjustments were for age, gender, body mass index, family history of CHD, diabetes, hypertension, alcohol intake, smoking, exercise habit, marital status, education, and job status.
at National Taiwan Univ. on April 29, 2009
www.jlr.org
atherogenic lipoproteins. However, the methodology for
measuring apoB has been standardized and is becoming
more widely available (9).
To our knowledge, this is the first extensive
investi-gation of various lipid markers and risk of CHD among
ethnic Chinese. Evidence from other Asian populations
also demonstrates that atherogenic particles play an
im-portant role in predicting CHD events, (27–31), but the
head-to-head comparison of nonHDL-C and apoB has not
been available. Because of the prospective cohort design,
the baseline measurements of all cohort members were
unlikely to be affected by storage and laboratory issues that
might be raised in some nested case-control studies. The
use of a community-based population could reduce the
possibility of selection bias. We also included important
socioeconomic status and lifestyle factors in the models
to control for potential confounding factors. Finally,
be-cause few participants (,1%) reported taking
cholesterol-lowering medications, our results were minimally affected
by statins and other cholesterol-lowering drugs.
Our study had several potential limitations. First, the
incident cases of CHD events were relatively few, even
with a median 13.6 years of follow-up, which would reduce
the power to detect subtle differences between various
lipid markers and make the relative risk estimation
un-stable. However, the 95% CI values for the estimated
rela-tive risks were narrow and tests for linear trends were
significant for most lipid variables. Second, because lipid
levels were measured only once, our results might be
at-tenuated by intraindividual variations.
In conclusion, we clearly demonstrate that apoB is more
strongly associated than LDL-C with risk of CHD among
ethnic Chinese. Our data indicate that apoB, a marker of
LDL-carrying particles, should be taken into consideration
in Asian populations, in addition to other lipid markers
such as nonHDL-C. Because of only moderate correlation
coefficients between apoB and other lipid markers (?0.2–
0.6), we recommended that apoB be measured for
com-prehensive evaluation of CHD risk in Asian populations.
The authors thank the participants in the Chin-Shan
commu-nity and the cardiologists at National Taiwan University
Hos-pital for their assistance in this study. This study was supported
partly by grants from the National Science Council in Taiwan
(Grants NSC 95-2314-B-002-125, NSC 94-2314-B-002-290, and
NSC 94-2314-B-039-006). F.B.H.’s research is partly supported by
an American Heart Association Established Investigator Award.
REFERENCES
1. Expert Panel. 2002. Third Report of the National Cholesterol Edu-cation Program (NCEP) Expert Panel on Detection, Evaluation, and Treatment of High Blood Cholesterol in Adults (Adult Treat-ment Panel III) final report. Circulation. 106: 3143–3421. 2. Walldius, G., and I. Jungner. 2006. The apoB/apoA-I ratio: a
strong, new risk factor for cardiovascular disease and a target for lipid-lowering therapy—a review of the evidence. J. Intern. Med. 259: 493–519.
3. Sacks, F. M. 2006. The apolipoprotein story. Atheroscler. Suppl. 7: 23–27. 4. Qureshi, A. I., W. H. Giles, J. B. Croft, L. R. Guterman, and L. N. Hopkins. 2002. Apolipoproteins A-1 and B and the likelihood of non-fatal stroke and myocardial infarction—data from the Third National Health and Nutrition Examination Survey. Med. Sci. Monit. 8: CR311–CR316.
5. Jiang, R., M. B. Schulze, T. Li, N. Rifai, M. J. Stampfer, E. B. Rimm, and F. B. Hu. 2004. Non-HDL cholesterol and apolipoprotein B predict cardiovascular disease events among men with type 2 dia-betes. Diabetes Care. 27: 1991–1997.
6. Ridker, P. M., N. Rifai, N. R. Cook, G. Bradwin, and J. E. Buring. 2005. Non-HDL cholesterol, apolipoproteins A-I and B100, stan-dard lipid measures, lipid ratios, and CRP as risk factors for cardio-vascular disease in women. J. Am. Med. Assoc. 294: 326–333. Fig. 2. Hazard risks of CHD during a median 13.6 years of follow-up according to tertiles of apoB and total cholesterol (TC)/HDL-C levels, adjusted for age, gender, body mass index, family history of CHD, diabetes, hypertension, alcohol intake, smoking, exercise habit, marital status, education, and job status. Cutoff points for tertiles of apoB were ,77, 77–104, and >104 mg/dl. Cutoff points for tertiles of TC/HDL-C were ,3.62, 3.62–4.80, and >4.80.
at National Taiwan Univ. on April 29, 2009
www.jlr.org
7. Lu, W., H. E. Resnick, K. A. Jablonski, K. L. Jones, A. K. Jain, W. J. Howard, D. C. Robbins, and B. V. Howard. 2003. Non-HDL cho-lesterol as a predictor of cardiovascular disease in type 2 diabetes: the Strong Heart Study. Diabetes Care. 26: 16–23.
8. Denke, M. A. 2005. Weighing in before the fight: low-density lipo-protein cholesterol and non-high-density lipolipo-protein cholesterol versus apolipoprotein B as the best predictor for coronary heart dis-ease and the best measure of therapy. Circulation. 112: 3368–3370. 9. Sniderman, A. D. 2005. Apolipoprotein B versus non-high-density
lipoprotein cholesterol: and the winner is. Circulation. 112: 3366–3367. 10. Chien, K. L., H. C. Hsu, F. C. Sung, T. C. Su, M. F. Chen, and Y. T. Lee. 2005. Hyperuricemia as a risk factor on cardiovascular events in Taiwan: the Chin-Shan Community Cardiovascular Cohort Study. Atherosclerosis. 183: 147–155.
11. Chien, K. L., F. C. Sung, H. C. Hsu, T. C. Su, W. D. Chang, and Y. T. Lee. 2005. Relative importance of atherosclerotic risk fac-tors for coronary heart disease in Taiwan. Eur. J. Cardiovasc. Prev. Rehabil. 12: 95–101.
12. Lee, Y. T., R. S. Lin, F. C. Sung, C. Y. Yang, K. L. Chien, W. J. Chen, T. C. Su, H. C. Hsu, and Y. C. Huang. 2000. Chin-Shan Community Cardiovascular Cohort in Taiwan: baseline data and five-year follow-up morbidity and mortality. J. Clin. Epidemiol. 53: 836–846.
13. Grambsch, P. M., and T. M. Therneau. 1994. Proportional hazards test and diagnostics based on weighted residuals. Biometrika. 81: 515–526.
14. Hosmer, D. W., Jr., and S. Lemeshow. 2000. Applied Logistic Re-gression. 2ndedition. John Wiley & Sons, New York.
15. Hanley, J. A., and B. J. McNeil. 1983. A method of comparing the areas under receiver operating characteristic curves derived from the same cases. Radiology. 148: 839–843.
16. Greiner, M., D. Pfeiffer, and R. D. Smith. 2000. Principles and practical application of the receiver-operating characteristic analy-sis for diagnostic tests. Prev. Vet. Med. 45: 23–41.
17. Pischon, T., C. J. Girman, F. M. Sacks, N. Rifai, M. J. Stampfer, and E. B. Rimm. 2005. Non-high-density lipoprotein cholesterol and apolipoprotein B in the prediction of coronary heart disease in men. II. Circulation. 112: 3375–3383.
18. Lamarche, B., S. Moorjani, P. J. Lupien, B. Cantin, P. M. Bernard, G. R. Dagenais, and J. P. Despres. 1996. Apolipoprotein A-I and B levels and the risk of ischemic heart disease during a five-year follow-up of men in the Quebec Cardiovascular Study. Circulation. 94: 273–278.
19. van Lennep, J. E., H. T. Westerveld, H. W. van Lennep, A. H. Zwinderman, D. W. Erkelens, and E. E. van der Wall. 2000. Apolipoprotein concentrations during treatment and recurrent coronary artery disease events. Arterioscler. Thromb. Vasc. Biol. 20: 2408–2413.
20. Walldius, G., I. Jungner, I. Holme, A. H. Aastveit, W. Kolar, and E. Steiner. 2001. High apolipoprotein B, low apolipoprotein A-I,
and improvement in the prediction of fatal myocardial infarction (AMORIS Study): a prospective study. III. Lancet. 358: 2026–2033. 21. Lehto, S., T. Ronnemaa, S. M. Haffner, K. Pyorala, V. Kallio, and M. Laakso. 1997. Dyslipidemia and hyperglycemia predict coro-nary heart disease events in middle-aged patients with NIDDM. Diabetes. 46: 1354–1359.
22. Cui, Y., R. S. Blumenthal, J. A. Flaws, M. K. Whiteman, P. Langenberg, P. S. Bachorik, and T. L. Bush. 2001. Non-high-density lipoprotein cholesterol level as a predictor of cardiovascular disease mortality. Arch. Intern. Med. 161: 1413–1419.
23. Expert Panel. 2001. Executive Summary of the Third Report of the National Cholesterol Education Program (NCEP) Expert Panel on Detection, Evaluation, and Treatment of High Blood Choles-terol in Adults (Adult Treatment Panel III). J. Am. Med. Assoc. 285: 2486–2497.
24. Keulen, E. T., M. Kruijshoop, N. C. Schaper, A. P. Hoeks, and T. W. de Bruin. 2002. Increased intima-media thickness in fa-milial combined hyperlipidemia associated with apolipoprotein B. Arterioscler. Thromb. Vasc. Biol. 22: 283–288.
25. Simon, A., G. Chironi, J. Gariepy, P. M. Del, and J. Levenson. 2005. Differences between markers of atherogenic lipoproteins in pre-dicting high cardiovascular risk and subclinical atherosclerosis in asymptomatic men. Atherosclerosis. 179: 339–344.
26. Sniderman, A., K. Williams, S. Haffner, and N. Sattar. 2004. Insights from apoB: from better diagnosis and therapy to the Medusa hy-pothesis. Atheroscler. Suppl. 5: 19–24.
27. Bhalodkar, N. C., S. Blum, and E. A. Enas. 2006. Accuracy of the ratio of triglycerides to high-density lipoprotein cholesterol for predicting low-density lipoprotein cholesterol particle sizes, phe-notype B, and particle concentrations among Asian Indians. Am. J. Cardiol. 97: 1007–1009.
28. Imke, C., B. L. Rodriguez, J. S. Grove, J. R. McNamara, C. Waslien, A. R. Katz, B. Willcox, K. Yano, and J. D. Curb. 2005. Are remnant-like particles independent predictors of coronary heart disease incidence? The Honolulu Heart Study. Arterioscler. Thromb. Vasc. Biol. 25: 1718–1722.
29. Curb, J. D., R. D. Abbott, B. L. Rodriguez, K. Masaki, J. Popper, R. Chen, H. Petrovitch, P. Blanchette, I. Schatz, and K. Yano. 2004. Prospective association between low and high total and low-density lipoprotein cholesterol and coronary heart disease in elderly men. J. Am. Geriatr. Soc. 52: 1975–1980.
30. Koba, S., T. Hirano, T. Sakaue, H. Takeuchi, M. Adachi, and T. Katagiri. 2002. An increased number of very-low-density lipoprotein particles is strongly associated with coronary heart disease in Japanese men, independently of intermediate-density lipoprotein or low-density lipoprotein. Coron. Artery Dis. 13: 255–262.
31. Wang, T. D., W. J. Chen, K. L. Chien, S. S. Seh-Yi Su, H. C. Hsu, M. F. Chen, C. S. Liau, and Y. T. Lee. 2001. Efficacy of cholesterol levels and ratios in predicting future coronary heart disease in a Chinese population. Am. J. Cardiol. 88: 737–743.
at National Taiwan Univ. on April 29, 2009
www.jlr.org