CHINESE JOURNAL OF PHYSICS VOL. 28. NO. 5 OCTOBER I990
Application of Extended X-ray Absorption Fine Structure Technique to Ni in the High-T, Superconductor YBa, CU~_~ Nix O,_y
C. H. Chou ( fl&B ) and S. F. Tsai ( j$Q$% ) Department of Physics, National Taiwan University
Taipei, Taiwan IO 764, R. 0. C.
(Received June 15, 1990; revised manuscript received July 20, 1990)
W e p r e s e n t a s t u d y o f c r y s t a l l i n e Ni(OH), and the high-Tc s u p e r c o n d u c t o r YBa2Cu3_xNix07_y (x X 0.12) by extended x-ray-absorption fine structure (EXAFS). By the use of the theoretical back-scattering amplitudes and phase-shift functions, the EXAFS spectra (L?X(kJ) of NiO, Ni(OH), and YBazCu3_xNix07_y have been simulated in order to aid us to reconfirm the analysis results. The Ni-0 bond distance in crystalline Ni(OH), has been deter-mined as (2.05 - 2.06) a This is accomplished either by using the experimental data of NiO or by using the theoretical back-scattering amplitudes and phase-shift functions. Both were used in this study. Various methods of analysis yield consistent values of (1) the distances between the oxygen atoms and the nickel atom and (2) the number of oxygen atoms around a nickel atom in YBa2Cu3_xNix07_y. Our results indicate that the incorporated Ni atoms replace Cu atoms at the Cu(1) site in YB? CU,O,_~. This work demonstrates that EXAFS can be used to provide information about the position of the incorporated atoms in YBa2Cu3_xNix07_y.
I. INTRODUCTION
The discovery of high-temperature superconductivity in several oxides, such as YBa2 Cu, O7_y, has raised many different speculations about possible new electron-pairing mechanisms. The structural and superconducting properties of the material YBa2Cu307_y have been investigated. 1,2y3,4 The systematic substitution of impurity atoms (in this paper: nickel atoms for copper atoms) and the determination of preferential substitutent effects on superconducting properties provide ways to probe superconductivity in YBa2 Cu3 O7_y .5*6
However, x-ray diffraction data have not revealed how the incorporated nickel ions, which partially substitute for the copper, are distributed over the two copper sites (i.e., the chain site and the Cu-0 plane, labeled Cu( 1) and Cu(2)) present in the structure of YBa2 Cu3 O,, .
Extended x-ray-absorption fine structure (EXAFS)’ has been shown to be a useful tool to determine the local structure surrounding an x-ray-absorbing atom. Many structural parameters such as interatomic distances and the number of coordinating atoms can be
461
462 APPLICATIONOFEXTENDEDX-RAYABSOR~IONFINESTRUCTURE TECHNIQUE..
determined from experimental EXAFS spectra.
Because there are two nonequivalent Cu sites which are associated with five different Cu-0 bond distances and which may be occupied by the incorporated Ni atoms, the applica-tion of the EXAFS technique to Ni in YBa2 Cu3_xNix07_y becomes an elaborate process. Nevertheless, by considering the character of the EXAFS spectra (K-edge absorption of Ni in the materials) and employing versatile methods of analysis, we have been able to draw firm conclusions about the local structure of Ni in YBa2Cu3_xNix07_y and then to verify successfully the sites of the Ni atoms.
II. SAMPLE PREPARATION AND MEASUREMENT
The samples were prepared by mixing appropriate amounts of Y2 0,) BaCO, , CuO and NiO powders of at least 99.9%. The mixtures were calcined in air at 950°C for 24 hours with several intermediate grindings. The resultant powders were ground and pressed into pellets. These pellets were then sintered in a continuous flow of oxygen at 950°C for another 24 hours. Finally an annealing process at 950°C in an O2 environment for 6 hours and cooling in the furnace preceded the various measurements.
The EXAFS measurements were performed on the beam line at the National Syn-chrotron Light Source (NSLS). The absorption spectra of NiO and Ni(OH)2 were measured by means of the transmission experiments; the absorption spectrum of YBa2 CU~_~N~~O~_~ was obtained by means of the excitation method (i.e. fluorescent experiments).
III. DATA AND ANALYSIS
The linear K-shell absorption coefficients (denoted by p) of Ni in NiO, Ni(OI& and YBa2 Cu3_x Nix 07_,, are shown in Fig. 1 (a), (b), (c) respectively.
I . I -OS *am E (eV) 4.0 3-5 3.0 2 *.5 2.0 1.5 1.0 2.5 2.0 (a) (b) Cc)
FIG. 1. The linear absorption coefficient /L obtained from transmission of (a) NiO, (b) Ni(OH)2, and the linear absorption coefficient /J obtained from fluorescence of (c) YBa, CU,~_ Ni, O,_,
.
C. H. CHOU AND S. F. TSAI 463
(1) Utilizing the one-electron, single-scattering approximation, (2) taking the average of the polarization effect, (3) taking the contribution of the thermal fluctuation and static disorder and (4) taking many-body effects into account, we express the oscillatory modula-tion of the linear K-shell absorpmodula-tion coefficient as
X(k) = c((E) - PO (E) PO(E)
=c - So 2 (k)Fj(k) expt-2ofk2 )exP(
Nj
-2(Rj - A)
j kRj2 Aj(k) )sin(2kRj f $tk)) (1)
in which p. is the structureless absorption coefficient of the isolated atom in question, k is the wave vector of the ejected photoelectron, Nj is the number of equivalent scatterers of type j at distance Rj, and Fj(k) is the magnitude of the back-scattering amplitude from each of the Nj neighboring atoms of type j with a Debye-Waller factor exp(-2o? k2) to account for thermal vibration and static disorder; sin(2kRj + $j(kjj is the sinuso:dal interference term, with #j(k) being the composite phase-shift function which contains contributions from both the absorber and the scatterer. So is the amplitude-reduction factor representing shake-up and shake-off effects of the central atom. The term exp(-2(Rj - al/X,(k)) is due to inelastic scattering and decay of the core hole, with Xj being the mean free path and A being a “core radius”. The latter two terms reflect many-body effects.
The x-ray energy E is converted into the wave vector k by means of the equation:
k = [2m,(E - EJ/h’] Ii2
(2)
Here, E,, in general, being in the vicinity’ of the edge, is the so-called threshold energy, me is the mass of the electron, and energy and wave vector are conventionally expressed in the units eV and a-l respectively.
Recent studiesg*tO have indicated that the single scattering approximation is adequate to much smaller energies than previously believed, provided that calculations at these smaller energies are done with the curved-wave formalism, such that the curvature of the outgoing and scattered photoelectron wave functions is taken into account. That is, the EXAFS expression, according to Eq. (I), is valid well into the XANES region” (to -1SeV above the edge, ca. 2A-’ ). Therefore we calculated the Fourier transform over the range that begins at -28-l.
Depending on the facilities that are available for experiments, supplementary techniques may also be employed during the analysis process. In this work, tasks have been accomplished by means of the processes introduced below: 1) extraction of x(k) data, 2)
Fourier filtering, 3) analysis of the Fourier-filtered data.
The structures of crystalline NiO and Ni(OH)2 are well known, however, the Ni-0 bond distance of crystalline Ni(OH)2 is uncertain (see Table I). Therefore, one can use crystalline NiO as a model sample to determine the Ni-0 bond distance of the unknown sample Ni(OI-0,. We extracted the x(k) data of each of NiO and Ni(OH)2 by choosing E,-,
464 APPLICATION OF EXTENDED X-RAY ABSORPTION FINE STRUCTURE TECHNIQUE
TABLE I. Lattice distances and coordination of the first two shells around Ni in NiO and Ni(OH),
Crystalline NiO Crystalline Ni(OH),
Coordination Coordination
Shell Occupancy Distance, A Shell Occupancy Distances, A
1 6 0 2.084 1 3 0 - 2 .
2 12 Ni 2.947 2 3 Ni - 3 .
at the first peak of the absorption coefficient p(E), and by performing the background sub-traction and normalization. We obtained magnitudes of the Fourier transform of the x(k) data sets of NiO and Ni(OH)2, shown in Fig. 2(a)(b), by multiplying the X(k) data by k2
and k3, and by transforming over the k ranges 2.28 - 12.28 A-’ and 2.33 - 13.08 A-l
respectively. We used the standard process of determining the bond distance of the unknown sample to obtain the total phases of the Fourier-filtered X(k) spectra (containing the contribution of the first shell corresponding to the first peak in Fig. 2(a) (b)) of NiO and
FIG. 2. The magnitude of the Fourier transform of (a) the k2$k) spectrum of crystalline NiO, and (b) the
k3x(kl spectrum of crystalline Ni(OH),
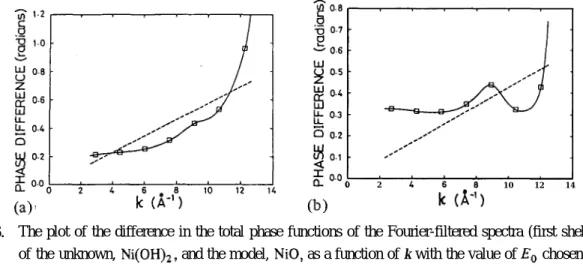
Ni(OH), . Fitting by a straight line the difference in these total phase functions (Ni-0 pair) of NiO and Ni(OH), (shown in Fig. 3(a)) yielded the unknown Ni-0 bond distance of Ni(OH), as (2.063 * 0.003) A. Repeating the same process except to choose E, at the half-height point of the absorption edge, we determined the unknown Ni-0 bond distance of Ni(OH), as (2.055 1: 0.003) a (shown in Fig. 3(b)).
After determining the Ni-0 bond distance in crystalline Ni(OH)2 and neglecting many-body effects, we simulated the k3x(k) function of Ni(OH)2 (shown in Fig. 4(a)), which contains the first two shells (R 1 = 2.05 1 A; R2 = 3.184 A; N, = 3; N2 = 3; a: = 0.002; 04 = 0.002), based on the theoretical phase-shift functions and back-scattering amplitudes calculated by Teo and Lee,12 and we used the simulated ‘NitOH), ’ as the model sample to reconfirm the Ni-0 bond distance of crystalline Ni(OH),. We obtained the magnitude of the Fourier transform of the simulated k3x(k) data by transforming over the k range from 2.15 to 13.25 A-l (shown in Fig. 4(b)).
C.H.CHOU AND S.F.TSAI 465
FIG. 3.
0 2 4 10 12 14
The plot of the difference in the total phase functions of the Fourier-filtered spectra (first shell) of the unknown, Ni(OH)2, and the model, NiO, as a function of k with the value of E, chosen at (a) the first peak of the absorption coefficient I-( and (b) the half-height point of the absorption edge. The straight dashed line was obtained by fitting to the difference of the total phases of the Ni-0 pairs in NiO and Ni(OH)* _
FIG. 4. (a) The simulated k3x,(k) data of the first two shells of Ni(OH)2. (b) The magnitude of the Fourier transform of the simulated k3x(k) spectrum.
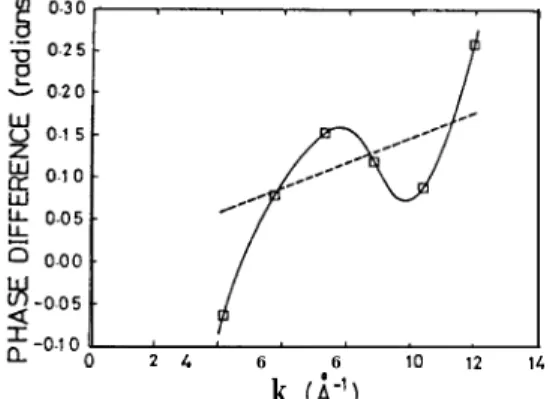
In Fig. 5(a), curve A refers to the Fourier-filtered k3xlk) spectrum (first shell) of the simulated data; curve B refers to the Fourier-filtered k3x(k) spectrum (first shell) of the EXAFS function of Ni(OH)* extracted on the basis of E, being the first peak of the p spectrum; curve C refers to the Fourier-filtered k3x(k) spectrum (first shell) of the EXAFS functions of Ni(OH)2 extracted on the basis of E, being 8 eV above the first peak of p. The corresponding total phase functions are depicted in Fig. 5(b). Because the simulated RI (equal to 2.05 1 A) is nearly equal to the Ni-0 bond distance of Ni(OH)2, the total- phase (line B) of the Fourier-filtered spectrum approaches the simulated total phase (line A) and the phase-difference fitted line passes through the origin (shown in Fig. 5(c)), as E, varies from the first peak of the absorption coefficient to 8 eV above this absorption peak. In other words, due to changing the value of Eo, line B approaches and eventually becomes line C; then lines C and A coincide. The fitted line in Fig. .5(c) yields the Ni-0 bond distance of Ni(OH)2 as (2.0534 + 0.0017) A. Following similar processes, with the exception of
defin-466 APPLICATION OF EXTENDED X-RAY ABSORPTIOI\; FINE STRUCTURE TECHNIQUE.
(a>
FIG. 5. (a) The Fourier-filtered k3Xfkj spectra of: (1) the simulated data (curve A); (2) the EXAFS function of Ni(OH), extracted by choosing E, at the first peak of the absorption coefficient ~1 (curve B); (3) the EXAFS function of Ni(OH), based on E, being 8 eV above the first peak of the absorption coefficient ~1 (curve C). (b) Line A is the simulated total phase; lines B and C illustrate the total phase of the Fourier-filtered spectrum of Ni(OH), with different values of E, corresponding to (a). (c) The plot of the difference in the total phase functions of the Fourier-fitted spectra (first shell) of Ni(OH), , with E, chosen at 8eV above the first peak of the absorp-tion coefficient cc, and of the simulated Ni(OH), .
ing the simulated R, = 2.057 A and the simulated R, = 3.164 8, we obtained the phase-difference fitted line (shown in Fig. 6) which yields the Ni-0 bond distance of Ni(OH), as (2.0496 f 0.0018) A.
2 I 6 6 10 12 Ir.
k (k’,
FIG. 6. The total phase difference and the fitted straight line, similar to Fig. 5(c), except that the simulated R, = 2.057 aand R, = 3.164 a
It is notable both that the plot of the magnitude (i.e. the relative heights and the positions of the first two peaks) of the Fourier-transform of k3 x(k) of Ni(OH), and the plot of that of the first two shells of Ni(OH), simulated are similar (cf. Fig. 2(b) and Fig. 4(b)), and that in the case of NiO and the first two shells of NiO simulated the plots of the magnitudes of the Fourier transform are also similar (cf. Fig. 2(a) and Fig. 7). These results provide us with the opportunity to identify the surrounding environment of the absorbing atom by comparing the magnitudes of the Fourier transform of the simulated data and the
461
FIG. 7. The magnitude of the Fourier transform of the simulated k*x(k) data of NiO, which contains the first two shells (Nr = 6, N2 = 12, R, = 2.08 A, R2 = 2.94& C$ = 0.002, U; = 0.002).
experimental data. It is also notable that, by using the simulated data, we have reconfirmed that the Ni-0 bond distance of Ni(OH), , which was obtained from the experimental spectrum of the model sample NiO, is approximately equal to (2.05 - 2.06) A. Con-sequently, by treating the simple case of Ni(OH)* , we have also confirmed that the theoretical data and the experimental data of NiO are reliable.
. Assuming that the incorporation of Ni atoms into YBa2Cu307_y to replace the Cu atoms at either the Cu(1) or the Cu(2) site does not greatly perturb the structure of this material, we can determine that the nearest shells around the Ni atom within YBa2 Cu3_x Nix 07_,, are formed by oxygen atoms. We obtained the magnitude of the Fourier transform of the kx(k) data of YBa2 CU,_~N~,O~_~, shown in Fig. 8, by transforming over a k space range 2.28 - 11.78 A-‘. The first two peaks, depicted in Fig. 8, correspond
, ?i
I-5
s
0.1 a n 0.10 0.0 a 0.06 U.04 0.02 0.00 0 12 3 4 5 6 7 aFIG. 8. The magnitude of the Fourier-transform of the kuk) data (K-edge absorption of Ni) of
YBa,Cu3-xNix07_,,, obtained by transforming over the k-range 2.28 - 11.78 A-’ and choosing Eo at the first peak of the absorption coefficient /J.
to the nearest two shells around the Ni atom within YBa2 CU~_~N~~O~_~. These two peaks are too close to each other to resolve the contribution of each peak from an inverse Fourier transform. Therefore, the contribution of the first two peaks, taken together, must be dis-tinguished from that of the other peaks. The Fourier-filtered x(k) data, as shown in Fig.
468 APPLICATION OF EXTENDED X-RAY ABSORPTION FINE STRUCTURE TECHNIQUE
9(a), contains these two unresolved shells. The total phase of the Fourier-filtered x(k) spectrum (first two shells) of YBa2 Cus+ Nix O7_y is depicted in Fig. 9(b). According to the beat-node method, the minimum point (beat-node) of the amplitude of the Fourier-filtered
x(k) data, and the associated kink in the total phase (at k, = 7.3 A-’ ), shown in Fig. 9(a)
and 9(b), indicate that the difference of the bond distances of the nearest two shells (AR = R2 - R, ) is equal to 0.215 A. Fig. 9(c) shows the magnitude of the Fourier trans-form of the Fourier-filtered k*x(k), which we obtained by repeating the Fourier transform.
.
(a)
FIG. 9.
K (A-‘)
(a) The inverse transform (the Fourier-filtered x(k) spectrum) from the unresolved 1 st and 2nd shells of YE!a,Cu2xNix07_y. Here, Ee is chosen at the half-height point of the absorption edge. The beat at 7.3 A-r is indicated. (b) The total phase of the Fourier-filtered x(k) spectrum de-picted in (a). (c) The magnitude of the Fourier transform of the Fourier-filtered k*x(k) spectrum depicted in (a) (over the range 2.65 - 12.00 A-’ ).
In this case, the approach to obtain more information is to analyze the Fourier-filtered
x(k) data through the application of the method of fitting. This we accomplished by the
use of the appropriate reference compounds for the back-scattering amplitudes and phases. We fitted the Fourier-filtered x(k) data of YBa2Cu3_xNix07_y by using empirical amplitudes and phases determined from the crystalline NiO for Ni-0 bonds. The k3.4x(k) data (shown in Fig. 10(a)) was synthesized with the parameter values N, = 2, N, “2, R, = 1.83 f 0.01 4, R2 = 2.04 + 0.01 A, u: = 0.002, u; = 0.002 in order to obtain a shape of the curve of the synthesized k3s4x(k) data which is similar to that of the Fourier filtered x(k) data of YBa2 Cu3_x Nix O7_y (the discrepancy between the k-weighting exponents of the synthesized
k3.4x(kl data and the Fourier-filtered x(k) data of YBa2Cu3_xNi,07_y is caused by the
different ways of processing the raw data). That these fitting results are correct is proved by the consistency of the difference of the bond distances obtained independently based on the beat-node method. The total phase of the synthesized x(k) spectrum is depicted in Fig. 10(b), in which the dashed curve refers to the total phase of the Fourier-filtered x(k) data of YBa2 Cu,_x Nix O7_y. This fitting is so nearly perfect that the dashed curve and the solid curve, which refers to the total phase of the synthesized x(k) spectrum, coincide almost completely. Furthermore, it is notable that the total phase of the yfrC) spectrum of the two unresolved shells is not only dependent on R 1 and R2 but also relate; to N, and N, and to the type of atoms involved. By means of other combinations of the values of N, and N, ,
C.H.CHOU AND S.F.TSAI 469
except N, = N, = 2, it is impossible to tit the total phase of the Fourier-filtered x(k) of YBa2 CU~_~ Nix O7_Y as well as that shown in Fig. 10(b). Therefore the fact that the fitting is nearly perfect also supports the conclusion that the nearest two shells around the Ni atom in YBa2 CU~_~ Ni, 07+, contain atoms of the same type. The plot of the magnitude (i.e. the relative heights and the positions of the first two peaks) of the Fourier transform of the
k5.4x(k) data, synthesized with the empirical NiO data (shown in Fig. 10(c)), is similar to
that of the Fourier transform of the Fourier-filtered k’x(k) spectrum of YBa2Cu3_xNix07_y
1.5, 1
(a>
FIG. 10. .
k (A-‘,
(a) The k’“dkj data, which was synthesized with empirical amplitudes and phases obtained from crystalline NiO for Ni-0 bonds. (b) The total phase of the synthesized xf k) spectrum (solid curve), and the total phase of the Fourier-filtered X(k) spectrum, depicted in Fig. 9(b) (dashed curve). (c) The magnitude of the Fourier transform of the synthesized kSAdk) spectrum (over the range 2.50 - 11.80 A-‘). The small peak at -0.7 Acorresponds to noise. ’
(cf. Fig. 10(c) and Fig. 9(c)).
By using the theoretical back-scattering amplitudes and phase-shift functions, as we did in the cases of crystalline NiO and Ni(OH)2, we simulated the x(k) spectrum of the nearest two shells around the Ni atom within YBa, CU,,N~~O~_~ with the following structural parameters N1 = 2, N2 = 2, R,=l.S3A, R2 =2.038A, u: = 0.0021 and 0: = 0.0021. Fig.
1 l(a) illustrates the total phase of the simulated x(k) spectrum. Although there is a difference 2n in the total phase, due to numerical calculation (and lacking physical mean-ing), and the task of adjusting the value of E0 has not been accomplished, the simulated total phase is still qualitatively similar to the total phase obtained from the experimental data of YBa2 (33-X Nix O7_y. By comparing the magnitudes of the Fourier transform of (1) the experimental data and of (2) the simulated data (shown in Fig. 1 l(b)), we reconfirm qualitatively that each of the nearest two shells around the Ni atom contains two oxygen atoms at the distance about R 1 = 1.83 A and R2 = 2.04 A, respectively.
IV. CONCLUSION
The success of our approach is due partly to the fact that the structure of the undoped YBaz Cu3 07-Y is known and that the possible surrounding environments of the different
470 APPLICATION OF EXTENDED X-RAY ABSORPTION FINE STRUCTURE TECHNIQUE.
0 1 2 3 4 5 6 7 8
@I R (A,
FIG. 11. (a) The total phase of the simulated x(k) spectrum, (b) The magnitude of the Fourier trans-form of the simulated k3dk) spectrum (over the range 2.20 - 12.60 8-l ).
sites of the incorporated atom are such that they could be anticipated.
Our results show conclusively that there are two oxygen atoms at a distance RI = 1.83 A and another two oxygen atoms at a greater distance R2 = 2.04 a around the x-ray-absorb-. ing Ni atom. This feature strongly suggests that the surrounding environment of the in-corporated Ni atom in YBa2Cu3_xNi,07_y is similar to that of the Cu atom at the Cu(1) site: the two environments vary primarily in that the Ni-0 bond distance is greater than the origina! Cu-0 bond distance. (as we might expect, given that the Ni-0 bond distance in nickel oxides is greater than the Cu-0 bond distance in copper oxides) In other words, the incorporated Ni atoms preferentially replace a portion of the Cu atoms at the Cu(1) site.
We have demonstrated the power of the EXAFS technique in resolving the local structure of a material as used with the materials of concern in this paper. Although neutron-diffraction measurement is also powerful in determining the location of the impurities in materials, the advantages of EXAFS are that it is less difficult in terms of sample requirement and that the process can be implemented even with ordinary rotating anodes in the x-ray source.
ACKNOWLEDGMENTS
We are grateful to Dr. M. K. Wu for his gracious help and for making available the samples, to Dr. Charlie Yang for the EXAFS data used in these studies and to Dr. G. B. Bunker for the analysis programs. We also express our appreciation to Professor P. K. Tseng for his enthusiasm and to Mr. L. Y. Chang for several discussions.
REFERENCES
1. R. J. Cava, B. Batlogg, C. H. Chen, E. A. Rietman, S. M. Zahurak and D. Werder, Phys. Rev. B36, 5719 (1987).
C. H. CHOU AND S. F. TSAI 471
2. T. Siegrist, S. Sunshine, D. W. Murphy, R. J. Cava and S. M. Zahurak, Phys. Rev. B3.5, 7137 (1987).
3. J. D. Jorgensen, B. W. Veal, W. K. Kwok, G. W. Crabtree, A. Umezawa, L. J: Nowicki and A. P. Paulikas, Phys. Rev. B36, 573 1 (1987).
4. J. D. Jorgensen, M. A. Beno, D. G. Hinks, L, Soderholm, K. J. Volin, R. L. Hitterman, J. D. Grace and Ivan K. Schuller, Phys. Rev. B36,3608 (1987).
5. Gang Xiao, M. Z. Cieplak, A. Gavrin, F. H. Streitz, A. Bakhshai and C. L. Chien, Phys. Rev. Lett. 60, 1446 (1988).
6. T. Siegrist, L. F. Schneemeyer, J. V. Waszczak, N. P. Sir&, R. L. Opila, B. Batlogg, L. W. Rupp and D. W. Murphy, Phys. Rev. B36,8365 (1987).
7. D. C. Koningsberger, R. Prins, Principles, Applications, Techniques of EXAFS,‘i“. SEXAFS and XANES, John Wiley &‘Sons, Inc., New York, (1988).
8. J. J. Baland, F. G. Halaks and J. D. Baldeschweiler, Phys. Rev. B28,2921 (1983). 9. A. G. #kale, B. W. Veal, A. P. Daulikas, S.-K. Chan and G. S. Knapp, J. Am. Chem.
Sot., 110, 3763 (1988).
10. A. G. Mckale, G. S. Knapp, S:-K. Chart, Phys. Rev. B33,841 (1986). 11. Ref 7, PP 603.