IR:Item 987654321/4398
129
0
0
全文
(2) ACKNOWLEDGEMENTS There are many important people in my life that helped to make this thesis possible. I would like to thank my advisory chairperson, dean Ding-shyong Chen. His encouragement and guidance has been an invaluable resource and source of inspiration for all of those around him. I appreciate his insightful comments and his feedback throughout the process. I would also like to thank my committee members, professor Cheryl Bain, and professor Peter Yang, for their careful review of the thesis. The knowledge they offered and constructive criticism they gave were invaluable. Finally, I am indebted to my family, especially my mother, for her lifetime of love and support, and for always reminding me that the end was obtainable. And a special gratitude to my sisters and my father who always knew not to talk about my thesis, and quietly support me throughout the graduate school life. In addition to my family, I am also grateful to James Scott Radant, who was the senior project advisor when I study in National Yunlin University of Science and Technology. Many thanks to him for polishing my English writing, and patiently revising my thesis.. Shih-chang Zhang June 20, 2007. I.
(3) ABSTRACT OF THE THESIS Riding for Leisure or Riding for Function: The Relationship between Recreational Bicycling and Bicycle Commuting In some places, bicycles are considered as one of the transport tools, and riding there is for function, while in some other places, bicycles are taken as physical activity, and thus riding there is for leisure. Riding for leisure or for function? 450 recreational cyclists from bicycle clubs and bicycles activities were sampled using convenience sampling, and there were 392 valid questionnaires or 89.2% of the sample. A self-developed questionnaire was administered to the respondents. This research firstly dealt with the relationship between recreational bicycling and bicycle commuting, second, the motivations and constraints of bicycle commuting were investigated, and finally, bicycle commuting policy was proposed. After the descriptive statistics analysis and Chi-square test, I concluded that there were strong connections between recreational bicycling and bicycle commuting, 38.5% of recreational cyclists also choose bicycle commuting. The motivations for bicycle commuting were enjoying riding bicycle, improving fitness, saving fuel, being environmentally-friendly, controlling weight, and commuting distance was short. The constraints to bicycle commuting were climate, lack of bikeways, bicycle theft, poor air quality, bad pavement, and safety. It is possible to encourage more cyclists to commute with bicycles by cycling awareness programs and better bicycling policies. The Taiwanese government should utilize the advantages of bicycle commuting, and promote cycling in Taiwan, not just for recreational purposes, but also for bicycle commuting purposes.. Key words: bicycle commuting, bikeway, cyclist II.
(4) TABLE OF CONTENTS Page ACKNOWLEDGEMENTS……………………………………………………………... i. ABSTRACT OF THE THESIS………………………………………………………….. ii. LIST OF TABLES……………….…………………………………………………….... v. LIST OF FIGURES…..………………………………………………………………….. viii. Chapter 1. INTRODUCTION………………………………………………………………. 1. Background and Motivation…………………………………………………... 1. Purposes of the Study…………………………………………………………. 3. Research Questions………………………………………………………….... 4. Definition of Terms……...……………………………………………………. 4. Research Process……..……………………………………………………….. 5. 2. REVIEW OF THE LITERATURE…………………………………………….... 6. The Importance and Benefits of Bicycling………………………………….... 6. Current Bicycling Conditions and the Motivation for Bicycle Commuting….. 29. Global Bicycling Conditions and Bikeway Systems...……………..…..…….. 34. The Reasons That Taiwanese Do Not Cycle………………………..……….. 44. Bicycle Policy Development in Taiwan and Foreign Countries...……………. 47. Research Hypotheses…………………………………………………………. 51. 3. METHOD………………………………………………………………………... 52. Research Design………………………………………………………………. 52. Research Scope……………………………………………………………….. 53. III.
(5) Page Sampling..…………………………………………………………………….. 54. Instrument…………….………………………………………………………. 55. Questionnaires Implementation………………………………………………. 57. Data Analysis…………………………………………………………………. 57. 4. RESULTS………………………………………………………………………... 58. Descriptive Analysis………………………………………………………….. 58. Demographic Data Analysis……………………………………………... 58. Bicycle Commuting Data Analysis…………………….………………... 66. Constraints to Bicycle Commuting Data Analysis………………………. 69. Motivations for Bicycle Commuting Data Analysis…………………...... 74. Chi-Square Test and Analysis…..…………………………………………….. 80. 5. Discussion……………………………………………………………………….. 96. Findings………………………..…………………………………………….... 96. Significance of the Study and Suggestions………………………………….... 98. Limitation and Directions for Future Research……..……………………….... 100. Conclusions………………………………………………………………….... 101. REFERENCES….……………………………………………………………………….. 102. English References…………………………………………………………………. 102. Chinese References……………………………………………………………….... 110. Appendices………………………………………………………………………………. 115. A. BICYCLE COMMUTING QUESTIONNAIRE....…...………………………... 115. B. CHINESE QUESTIONNAIRE..………………………………………………... 118. IV.
(6) LIST OF TABLES Page Table 1. Types and definition of bicycles………...…………………………………….... 8. Table 2. The strategy construction of bicycle industry in Taiwan………...…………….. 8. Table 3. Transportation expense per Taiwanese in 2005……………………...…………. 10. Table 4. The cost of private transportation…………………………………………….... 12. Table 5. The direct cost of mass transportation…………………………………..……... 12. Table 6. The direct cost of transportation……………………………………………….. 13. Table 7. Direct cost of different Taiwanese transportation expenses……………………. 14. Table 8. The calorie consumption of different types exercise………………………..…. 16. Table 9. Number of Registered Motor Vehicles in Taiwan-fuchien Area……………….. 20. Table 10. Registered motorcycles distribution in Taiwan……..……………………….... 22. Table 11. Average everyday motorcycle commuting distance (round way)..………….... 23. Table 12. Bicycle, the Green Transportation..……………………………………............ 24. Table 13. Examples of Bicycle Facilities…...………………………………………….... 25. Table 14. Types of Cyclists…………………………………………………………….... 29. Table 15. Classification of Rider Types……………………..……………...………….... 37. Table 16. Transportation mode split in percent of total trips……………………………. 37. Table 17. Purpose of Bicycle Trips in the Netherlands, Germany, and the USA….……. 38. Table 18. Classification of rain type…………………………………………………….. 40. Table 19. Critical criteria of Taiwan meteorology………………………………………. 41. Table 20. Trends in Walking and Bicycling Share of Travel in The Netherlands,. 42. Germany, and the United States, 1977-1995……………..………………... V.
(7) Page Table 21. Comparison of Bicycle Tourism Development in Taiwan and Overseas........... 42. Table 22. Roadway Improvements for Bicycle Facilities...……………………………... 48. Table 23. Recreational cyclists’ population of the study………………………………... 54. Table 24. Gender of the study participants………………………..…………………….. 58. Table 25. Age of the study participants………………………………………………….. 59. Table 26. Occupation of the study participants………………………………………….. 60. Table 27. Car ownership of the study participants…………………………………......... 60. Table 28. Motorcycle ownership of the study participants…………………………….... 61. Table 29. Bicycle ownership of the study participants………………………………….. 62. Table 30. Marital status of the study participants…………...…………………………... 62. Table 31. Usual commute mode of the study participants…………………………......... 63. Table 32. Commute distance of the study participants………………………………….. 64. Table 33. Expenses with driving a car of the study participants…………………............ 64. Table 34. Expenses with riding a motorcycle of the study participants…………………. 65. Table 35. MRT or bus expenses of the study participants………………………………. 65. Table 36. Bicycle commuter of the study participants……………………………........... 66. Table 37. Mass transit experience with bicycle of the study participants……………….. 67. Table 38. Helmet wearing percentage of the study participants……………………….... 67. Table 39. Bicycle commuting history of the study participants…………………………. 68. Table 40. Bicycle commute trip per week of the study participants…………………….. 69. Table 41. Bicycle commuting distance (one-way) of the study participants……………. 69. Table 42. Weather constraint of the study participants…………………………….......... 70. VI.
(8) Page Table 43. The reason(s) not to bicycle commuting of the study participants………….... 72. Table 44. Stolen bicycle experience of the study participants……………………........... 73. Table 45. The reason(s) to bicycle commuting of the study participants………….......... 76. Table 46. Available bicycle facilities of the study participants………………………….. 77. Table 47. The most desired bicycle facility of the study participants………………….... 78. Table 48. Company or school’s encouragement(s) of the study participants……………. 79. Table 49. Chi-Square Test of gender and bicycle commuting data…………………….... 82. Table 50. Chi-Square Test of age and bicycle commuting data…………………………. 84. Table 51. Chi-Square Test of occupation and bicycle commuting data…………………. 87. Table 52. Chi-Square Test of vehicle ownership and bicycle commuter………….…….. 88. Table 53. Chi-Square Test of marital status and bicycle commuting data………………. 90. Table 54. Chi-Square Test of usual commute mode and bicycle commuting data…….... 93. Table 55. Chi-Square Test of transportation expenses and bicycle commuter………….. 95. VII.
(9) LIST OF FIGURES Figure 1. Research process………………………………………………………………. 5. Figure 2. The bicycle wheel – individual segments have formed a whole...……………. 17. Figure 3. The Overseas Bicycle Tourism Model..……………………………………….. 30. Figure 4. Research framework……………………………………………………........... 52. Figure 5. Focuses of the research…………………………………………………........... 53. VIII.
(10) Chapter 1 INTRODUCTION Background and Motivation People faced a transportation revolution in the twentieth century, with motorized vehicles propelling us into a more comfortable and faster transportation era. Motorized transportations are taken as a symbol of developed-machines. In 1950, there were about 53 million cars on the world’s roads; only four decades later, the global automobile fleet became over 430 million, more than an eightfold increase (Walsh, 1992). However, Australian health authorities now recognize our sedentary lifestyle and our reliance on motorized travel as a major ongoing health issue (Sallis, Bauman & Prat, 1998), and the environmental impact and sustainability issues are also of concern (Hsieh, 2002). The decline in levels of physical activity in most developed countries has been accompanied by a growing reliance on the car for transport in urban areas (Mason, 2000; Lumsdon & Mitchell, 1999). In the last 50 years, there has been an increase in the number and length of car trips while the proportion of trips made by physically active modes of transport, such as walking and cycling, has decreased (Ling, Kwang & Tjhin, 2002). Bicycling, the green mode is an ideal way of traveling from the point of view of energy conservation, environmental friendliness and social equality (Tolley, 1990). Russell (1982) claimed that bicycling is a lifelong sport. The bicycle is acknowledged for its cost effectiveness and efficiency over short distances in urban areas (Ho, 2005). Wu and Zhang (2004) and Ho (2003) stated that the bicycle was once the main transport mode in Taiwan, but bicycle usage was gradually decreased because of the widespread of motorcycles and automobiles. However, the bicycle revival was stimulated by the global oil crisis in the early 1.
(11) 1970s (Chang & Chang, 2003). Taiwan is known as the kingdom of bicycles (Liao, 1998; Zhu, 2001); however, it has never been a kingdom of cyclists (H. W. Chang, 2004). In Taiwan, most of the bicycles are for export, 95% of the bicycles are for export use, Taiwanese purchases only five percent of bicycle produced in Taiwan (Liao, 1998), and the American market accounted for 30% of bicycle exports (Ou, 1998). On the average, only five out of 100 Taiwanese own a bicycle. In the Netherlands, the average person owns 1.6 bicycles. Due to these factors, bicycling is an emerging trend as an important leisure and transportation mode. Yang and Chang (2005) stated that bicycle usage has increased in recent years as people become more aware of its health benefits and environmental protection. According to the Department of Transportation of Taipei City Government (2004), bicycling is the most efficient transport mode in getting to a destination within a five km radius if inside a city like Taipei. Still, bicycling in Taiwan is not prevalent compared with European countries; the bicycle’s share of local trips is two percent, car trips is 44%, and motorcycle trips is 53% in Taipei (Ku, 2006) compared with 30% for bike trips in the Netherlands, 20% in Denmark, 12% in Germany, and ten percent in Switzerland. Thus, the promotion of bicycling as an alternative to motorized transportation has a long way to go in Taiwan. There are 23 million residents in Taiwan, six million own cars and 13 million motorcycles; however, only own 1.1 million bicycles, the average Taiwanese has only 0.05 bicycles per person, compared with an average resident having 1.6 bicycles in the Netherlands. Hou (2005) pointed out the bikeway development in Taiwan must been made and improved.. 2.
(12) Taiwan is increasing investment in the boom in bicycle tourism, and both central and local governments have been trying to stimulate the development of bicycle tourism and recreational bicycling (Chang & Chang, 2005), however; Huang, Shiue and Lin (1999) and Hou (2005) have indicated that the Taiwanese government has neglected the benefits of bicycling and paid little attention to bicycle facilities. According to the Environmental Protection Administration (EPA), Executive Yuan, R.O.C. (1997), the doubling of bike trips would save about one to three million US dollars on energy costs and improved fitness levels, reduce air pollution, and decrease energy use. Therefore, the Taiwanese government needs to pay more attention about the bicycling issue. By the year of 2008, the Taiwanese government expects to build 1,200 km of bicycle paths and promote citizens to participate in bicycling. Purposes of the Study The objectives of this study are to answer the following questions: the general situation of bicycle commuters; investigating whether recreational cyclist will bicycle commute or not; the constraints they face when bicycle commuting; the motivations for why they choose to bicycle commute; the benefits created by bicycle commuting; and hence propose how to improve the Taiwanese bicycle commuting situation. This research will be divided into two parts. The first part is the review of the literature and the other part is the questionnaire design. This research aims to use the literature review to analyze bicycle commuting conditions in Taiwan, bicycle commuting conditions in foreign countries, and then, identify the bicycle commuting conditions in Taiwan and foreign countries. Finally, we can then explore the bicycle commuting problems and devise a questionnaire by the analysis. In the second part we will investigate bicycle commuting conditions, the motivation for choosing bicycle commute, bicycle commuting problems and 3.
(13) the reasons for the high number of non-cycling commuters. Research Questions The researcher proposed four research questions according to the purposes of the study: 1. Do recreational cyclists also use their bicycles as a means for commuting? 2. If recreational cyclists do not also use their bicycles to commute, what are their reasons? 3. What are the motivations of recreation cyclists taking bicycles as their means for commuting? 4. How can recreational cyclists be encouraged to become bicycle commuters? Definition of Terms Bicycle Commuting '''Bicycle commuting''' is the act of commuting to work or school by bicycle, a common form of utility bicycling rather than sport bicycling. Bicycle commuter In this study, the term of bicycle commuter was defined as one that used a bicycle at least once per week, for three months for at least half of the year. Recreational cyclist Recreational cyclist was defined as a person who joins the bicycle club or participates in bicycle activities.. 4.
(14) Research Process. Chapter One. Research Motivation and Purposes. Specify Research Literature Review Chapter Two Review of the 1.Journals. 2.Books. 3.Theses. 4.Magaziness. 5.Websites. 6.News Papers. Literature. Affirming Research Questions and Purposes Chapter Three Research Research Method Devising Method. Questionnaires Distribution Chapter Four Research Data Arrangement Conducting. Data Analysis Chapter Five Conclusions and Thesis Finished. Figure 1. Research process.. 5.
(15) Chapter 2 REVIEW OF THE LITERATURE The Importance and Benefits of Bicycling Currently, there is a global energy crisis as well as an air pollution problem (Wu, 2004), and Dill and Carr (2003) and Lohr (1999) agreed that with growing concerns over traffic congestion and vehicle pollution, motor vehicle transport also accelerates global warming through greenhouse gas emissions, increases habitat loss and may impair social contact in the neighborhood (Mason, 2000), and motor vehicle dependency impacts on individual health, public health and the environment (Hamer, 1999). Thus, public policy makers are increasingly promoting bicycling as an alternative for commuting and other utilitarian trip purposes. Thus, bicycling is a good mode of transportation in modern society, as it is an affordable and feasible solution to the traffic congestion and vehicle pollution problem. Kazimee (n.d.) accomplished a paper about twenty five things to do to make an urban neighborhood sustainable. One of the twenty five things is to provide for bicyclists priority connections. He claimed that bikeways and walkways are critical to enhancing a more personal/pedestrian sense of community. These bikeways and walkways should connect to convenient transit stops and should have continuous pavement patterns across driveways and streets. Pedestrian/bike connections are far more energy-and cost-efficient than auto dependent access. They can provide ample bike parking and reduce auto services to a minimum. These sustainable design guidelines are an effective tool for demonstrating the theory, quality and application of a sustainable design to an urban community.. 6.
(16) Multiple Functions of Bicycle The bicycle is one of the first transportation vehicles in our industrial society. The composition of a bicycle is simple, but it can satisfy a variety of needs for the cyclists and can increase transport efficiency (Liao, 2000). The bicycle functions depend on the users rather than the bicycle itself. Not only they can be used for recreation and transportation, but they can also be used for racing or commuting. Xie (1999) stated that bicycle commuting is not common in highly developed cities. Moreover cycling has been moving toward sports and leisure rather than a means of commuting. Most of the Taiwanese used bicycles as a major form of transportation before 1960 (Hsieh, 2002); however, motorized vehicles have taken the role of bicycles in recent years. Though bicycle commuting is declining, Cheng (2005) observed that the population using cycling as a form of recreation is gradually increasing. Ritchie (1998) remarked that the emerging trend of the bicycle is an important leisure and recreational transportation mode. Besides, Krizek and Roland (n.d.) claimed that on-street bicycle lanes usually comprise a critical backbone of a city’s overall bicycle plan, for both recreation and commuting. Papon (2001) observed that the bike fleet has increased as much as the car fleet, but it is less uniformly distributed among households. Only three quarters of it is not used for transportation purposes, not at all, or for only recreation. Various Kinds of Bicycles The researcher roughly classified bicycles into seven categories. They are road bikes, Source: (2005) utility bikes, mountain bikes, folding bikes, child bikes, electric bikes and otherCox kinds of bikes. Each kind of bicycle has been distinguished by its function and specialty.. 7.
(17) Table 1. Types and definition of bicycles. Type of bicycle. Definition. Road bike. Designed for road bicycle racing: they are fast, lightweight and aerodynamic.. Utility bike. Designed for utility bicycling: commuting, shopping, and running errands in towns and cities.. Mountain bike. In contrast to road bicycles, are rugged enough for off-road riding. However, given their popularity and low cost, these bicycles are often ridden on the road. A folding bicycle or folder is a type of bicycle that incorporates a number of hinges or joints,. Folding bike. which may be lockable, that permit it to be folded into a more compact size, typically via folding one or more of the bicycle's components, most often the frame.. Child bike. Design for child and short-distance commuting.. Electric bike Other. Electric scooters are rising in popularity because of higher gasoline prices. Battery technology is rapidly improving making this form of transportation more practical. Other specific-built bikes such as BMX (Bicycle Moto-cross), tandem, recumbent bike. Source: Wikipedia (2006), organized by the researcher. There are various kinds of bicycles consumers in Taiwan; they are workers, seniors, women and children, recreational users and those who bike for exercise. Jin (1999) observed that electric bikes is one trend of bicycle buyers. Electric bikes are not widespread in Taiwan because of its price, weight and battery; however, if the problem of electric bikes could be solved, they could be a future trend. Table 2. The strategy construction of bicycle industry in Taiwan. Consumer market Item. Worker. Senior. Woman and children. 。. 。. Recreation user. Exerciser. ●. Product. All Terrain Bike. ●. City bike. ●. Touring bike Mountain Bike. 。 ●. 。. Road racing Electric bike. 。 ●. ●. ●. ●. 。: Past-oriented strategy ●:Future-oriented strategy Source: Industrial Technology Information Services, organized by Jin (1999) translated by the researcher. 8.
(18) The bicycle is an important means of transport in urban and rural areas. Forester (2005) claimed that bicycle commuting in modern society is competitive with six other modes of transportation. This includes local mass transit, second, all transportation in congested urban areas, third, walking, but very few trips, except in congested urban centers, it is purely walking trips, fourth, urban motor trips when congestion and inconvenient parking make motoring too slow and inconvenient, fifth, walking and local mass transit when those are the choices for those without immediate access to a car, sixth, motoring and walking to locations where car parking is by permit only and where the style of clothing is largely optional, as on many university campuses. Taiwan is crowded with motorized vehicles similar to other developing countries. It is hard to find a parking space and the parking problem alone makes motorized transportation inconvenient. Therefore, bicycling in Taiwan should be promoted as an alternative way for urban commuting. This will hopefully reduce the problem of traffic congestion. The Advantages of Bicycle Commuting According to the previous review of the literature, the researcher concluded that bicycling is an environmentally-friendly mode of transportation. It requires no fuel and compared to motorized vehicles, it is more affordable. Moreover, when cyclists ride bicycles, no matter for transportation or recreation, they provide health benefits. Demaio and Gifford (2004) concluded that bicycles have several advantages over other modes of public transportation for short-distance urban trips because they: first, can reach underserved destinations, second, require less infrastructure, third, are relatively inexpensive to purchase and maintain, fourth, generally do not add to vehicular congestion, fifth, do not create pollution in their operation, and sixth, provide the user with the added benefit of 9.
(19) exercise. Economic Benefit of Biking An average automobile costs NT$600,000, an average motorcycle costs NT$50,000, while an average bicycle costs NT$3,000. In other words, a car is equal to 200 bicycles, and thus, commuting by bicycle is economical, feasible, and affordable (Yang & Chang, 2005), especially when compared with other motorized transport modes. Dora (1999) and Hillman (1997) also noted that commuting by bicycle is the most affordable, feasible, and dependable way for people to get the additional exercise they need. According to Directorate-General of Budget, Accounting and Statistics (DBGAS), Executive Yuan, R.O. C. (2005), each Taiwanese spent on average purchases of transport equipment NT$1,339, average operation of transport equipment for NT$12,166, average NT$4,155 on purchased transportation, average NT$1,345 on insurance of transport equipment, and the total of an average of NT$19,015 were spent on transportation expenses in 2005. Hypothetically, an average Taiwanese travels 3,650 km per year, the average cost per kilometer is NT$5.21, Table 3 shows average transportation fees. Table 3. Transportation expense per Taiwanese in 2005.. Unit: NT. Purchases of transport equipment. NT$1,339. Operation of transport equipment. NT$12,166. Purchased transportation. NT$4,155. Insurance of transport equipment. NT$1,345. Total. NT$19,015. Cost per kilometer. NT$5.21 DBGAS, Executive Yuan, R.O. C. (2005). 10.
(20) Here, the researcher supposed that an average 1.6 liter car cost NT$600,000, and it could be used for ten years, and automobile tax (fuel tax, license tax) costs NT$11,920 [Directorate General of Highways (DGH), M.O.T.C., 2007] annually, and automobile insurance costs NT$4,922 (DBGAS, 2007) annually, while repairs and maintenance (lubricant, tire) cost NT$3,000 annually, and a liter of 95 unleaded petroleum could run ten km. Hypothetically, an average Taiwanese travels 3,650 km per year, and Table 4 shows the car transportation fees. Again, the researcher supposed that an average 125c.c. motorcycle cost NT$50,000, and it be could last for ten years. Motorcycle tax (fuel tax, license tax) cost NT$900 (DGH, 2007) annually, motorcycle insurance cost NT$767 (South China Insurance, 2007) annually, repairs and maintenance (lubricant, tire) cost NT$1,200 annually, and a liter of 95 unleaded petroleum could run 22.5 km (DGBAS, 2005). Hypothetically, an average Taiwanese travels 3,650 km per year, and Table 4 shows the motorcycle transportation fees. On the other hand, hypothesized that all Taiwanese take that bicycle as their commute mode, the transportation expense will be like this: a bicycle could last for five years and it cost NT$3,000, repairs and maintenance (chain and tire) cost NT$500 annually, Hypothetically, an average Taiwanese travels 3,650 km per year, and Table 4 shows the bicycle transportation fees. On the individual aspect, a car driver turns into a bicycle commuter, it is possible to save NT$88,962 (90,062 deduct from 1,100) annually; motorcycle commute mode turns into a bicycle commuter, it is possible to save NT$10,795 annually. The data can be found in Table 4.. 11.
(21) Table 4. The cost of private transportation. Automobile purchase (600,000 divided by 10 yrs) Automobile tax (fuel tax, license tax) Automobile insurance Repair and maintenance (lubricant, tire). 60,000. 11,920 4,922 3,000. Motorcycle purchase (50,000 divided by 10 yrs) Motorcycle tax (fuel tax, license tax) Motorcycle insurance Repair and maintenance (lubricant, tire). Fuel expense (3,650 multiplied by 28 and. Unit: NT$ Bicycle purchase (3,000. 5,000. divided by 5 yrs). 600. 900 767 Repair and maintenance. 1,200. (lubricant, tire). 500. Fuel expense (3,650 10,220. multiplied by 28 and. divided by 10). 4,088. divided by 22.5). Total. 90,062. Total. 11,955. Total. 1,100. Cost per kilometer. 24.67. Cost per kilometer. 3.28. Cost per kilometer. 0.30. On the view of mass transportation mode, Taipei union bus costs two NT dollars per kilometer, 3,650 km commute distance will cost NT$7,300 annually; Taipei MRT costs three NT dollars per kilometer, 3,650 km commute distance will take NT$10,950 annually; Kuo-kuang bus costs NT$1.6 per kilometer, 3,650 km commute distance will take 5,840 annually; Taiwan Railway costs NT$2.3 per kilometer; 3,650 km commute distance will take NT$8,395 annually. Table 5. The direct cost of mass transportation.. Unit: NT$. Taipei Mass Rapid. Mass transportation mode. Taipei union bus. Ticket. NT$15, 7 km. NT$45,15 km. Fuel cost per kilometer. 2/km 7,300. Transportation expense per year (3,650 km). Kuo-kuang bus. Taiwan railway. NT$255,. NT$375,. 160 km. 160 km. 3/km. 1.6/km. 2.3/km. 10,950. 5,840. 8,395. Transit (MRT). Source: C. X. Chang (2004). 12.
(22) Walking is the most economical commute means at NT$0 per kilometer; nevertheless, an average walking speed is approximately five km per hour, this means that ten km round trip will take two hours for the commute distance. In developing countries like Taiwan, two hours to commute is nearly impossible, not to mention there are seldom sidewalks in most urban areas for pedestrians. Bicycling is the second most economical transportation mode at NT$0.30 per kilometer, however, five km of commute distance could be finished within 20 minutes. If the average cycling speed is about 20 km per hour, it is four times faster than walking. Bike and ride is a good transport method for long distance commuting and it is possible to bicycle to bus stations, train stations, or MRT stations, and carry bicycles onto the bus or train. The data can be found in Table 6. Table 6. The direct cost of transportation.. Unit: NT$. Transport means. The direct cost of transportation. Average transportation cost per Taiwanese. 5.21/km. Walking. 0/km. Bicycling. 0.30/km. Motorcycle. 3.28/km. Car. 24.67/km. Taipei union bus. 2/km. Taipei Mass Rapid Transit(MRT). 3/km. Kuo-kuang bus. 1.6/km. Taiwan Railway. 2.3/km. The total of shorter than ten km round way commute distance accounted for 58.2% in 2003, and the total of shorter than ten km round way commute distance accounted for 49% in 2005 (DGBAS, 2005). Hypothetically, all 22,733,839 residents (DGBAS, 2005) multiplied by average transportation NT$19,015, it is equaled to NT$432,283,948,585; if every Taiwanese use car as transport mode it will take 22,733,839 multiplied by 90,062, it is equal 13.
(23) to NT$2,047,455,008,374; all motorcycle commute mode took 22,733,839 multiplied by 11,985, it is equal to NT$27,246,506,415;all MRT commute mode took 22,733,839 multiplied by all bicycle commute mode took 22,733,839 multiplied by 1,100, it is equal to NT$25,007,222,900. The data can be found in Table 7. Table 7. Direct cost of different Taiwanese transportation expenses.. Unit: NT$. Commute mode. Direct cost of Taiwanese transportation expense. Average Taiwanese transport expense (DGBAS, 2005). 432,283,948,585. Car. 2,047,455,008,374. Motorcycle. 272,465,060,415. MRT (Mass rapid transit). 248,935,537,050. Bicycle. 25,007,222,900. On the government aspect, possibly all Taiwanese changed car commute mode into bicycle commute mode, it could save NT$2,294,912,845,889 (2,047,455,008,374 deduct from 25,007,222,900) annually; all Taiwanese changed motorcycle commute mode into bicycle commute mode, it could save NT$247,457,837,515 (272,465,060,415 deduct from 25,007,222,900) annually. Health Benefits of Biking Physically activity is becoming increasingly recognized as a lifestyle behavior with significant individual and population health benefits. For the past ten years, the evidence for the beneficial health effects of physical activity has been accumulating, demonstrating physical activity to be protective against cardiovascular and other chronic diseases, while implicating physical inactivity as a risk factor for these same diseases. Moreover, physical activity is beneficial for the mental health of an individual. These benefits can be obtained from 30 minutes of moderate intensity physical activity on most days of the week, and the benefits are dose-dependent; physical activity of longer duration and greater intensity reap 14.
(24) greater benefits (Ling et al., 2002). Cycling improves cardiovascular fitness. It uses all the major muscle groups, strengthens bones and helps prevent osteoporosis, improves circulation, reduces cholesterol levels, relieves the effects of rheumatoid arthritis and, like all physical activity, helps people cope better with stress (Rissel, 2003). In Wadhwa’s (1998) study, he discovered that health was cited by almost every respondent as a reason for using a bicycle, and 70 percent cited it as the most important reason. The inexpensiveness of a bicycle and ecological considerations also were cited as other reasons for using a bicycle by about three-quarters of the respondents. Being the only alternative was cited by less than half of the respondents, although 60 percent of the respondents did not have sole access to a car. Dora (1999) observed that cycling can bring major health benefits. For example, half an hour a day can halve the risk of developing heart disease. This is equivalent to the effect of not smoking and is valid for most of the population, who do very little physical activity. Even if spread over two or tree shorter episodes, this amount of activity can also halve the risk of developing diabetes, reduce blood pressure (equivalent to the effect of taking antihypertensive drugs), and improve functional capacity. Bicycle commuting has many advantages. For example, while commuting by bicycle to the office or to school, the cyclist gets aerobic exercise at the same time (Zheng, 1997). Many fitness experts have asserted that aerobic exercise could improve fitness levels. Dool (2003) added that it is also a critical means to reduce traffic congestion, air, and noise pollution. The health-damaging and financial costs of physical inactivity represent a major public health problem, comparable to tobacco smoking, and a challenge to health promotion researchers to develop strategies to encourage physical activity. More bicycling as a means of 15.
(25) transport is believed to be one of the few feasible options to increase the levels of physical activity among the general population. Furthermore, Killingsworth and Lamming (2001) remarked that bicycling is a better approach than promoting sports, aerobics, or weightlifting because structured activities only resonate with a small percentage of the population. All in all, bicycle commuting is one simple way to have a healthy body. Bicycling to control weight Running, swimming and cycling are major aerobic exercises. While commuting to the work place or school by bicycle, a ten km commute distance in an urban area takes approximately 40 minutes (five km one way for 20 mins), and this could infer that a 140 pound person could burn extra 341 (512 multiplied by 0.66) calories every bicycle commuting day. A regular bicycle commuter could burn extra 10,230 calories more than non-bicycle commuter monthly, so it is possible to lose 3 pounds if there is no change in the diet in the month. Table 8 shows exercise calorie consumption per hour. Table 8. The calorie consumption of different types exercise. Activity (one-hour duration). Calories burned 140-to 150-pound person. 170-to 180-pound person. Aerobic dancing. 416-442. 501-533. Backpacking. 448-476. 539-574. Badminton. 288-306. 347-369. Bicycling (outdoor). 512-544. 616-656. Bicycling (Stationery). 48-476. 539-574. Bowling. 192-204. 231-246. Canoeing. 224-238. 270-287. Dancing. 288-306. 347-369. Gardening. 256-272. 308-328. Golfing (carrying bag). 288-306. 347-369. Hiking. 384-408. 462-492. Jogging, 5 mph. 512-544. 616-656. 16.
(26) Racquetball. 448-476. 539-574. Rope jumping. 640-680. 770-820. Running, 8 mph. 864-918. 1,040-1,107. Skating (ice-or roller). 448-476. 539-574. Skiing (cross-country). 512-544. 616-656. Stair climbing. 576-612. 693-738. Swimming. 384-408. 462-492. Tennis. 448-476. 539-574. Volleyball. 192-204. 231-246. Walking, 2 mph. 160-170. 193-205. Walking, 3.5 mph. 243-258. 293-312 Source: MayoClinic.com. Engineering. Social. Health. Science. Environment. Planning and design Source: Dool (2003). Figure 2. The bicycle wheel – individual segments have formed a whole. Dool (2003) concluded that bicycling is comprised of six factors: they are social, health, environment, engineering, science, and planning and design. Bicycle, the Anti Air Pollution Transportation Nowadays, air pollution is a critical concern, and road transportation accounted for 81 percent of Nitrogen Oxides (NOx) emissions (diesels four percent; petroleum cars 34 percent and motorcycles 43 percent. Besides, road transportation accounted for approximately 98 17.
(27) percent of these pollutants: vehicles are responsible for 74 percent, motorcycles 21 percent and diesels three percent (Wang, n.d.). Cars, trucks, buses, and other motor vehicles are playing an ever-increasing role in global climate change and air pollution worldwide. Land transport is causing serious environmental problems, not only in industrialized countries, but also in developing ones (Hmaidan, n.d.). Motorized vehicles emit a variety of air pollutants that are known to be associated with adverse health effects. Common air pollutants emitted by motor vehicles include fine particles, nitrogen dioxide and Volatile Organic Compounds (VOCs). Exposure to fine particles is associated with short and long-term adverse health effects on the lungs and heart, including premature death (Chertok, Voulkelatos, Sheppeard & Rissel, 2004; Dora, 2003). Dora (2003) estimated that a change in air pollution from the highest to the lowest amounts was documented in studies in the United States for the long term effects of air pollution (particulate matter smaller than 2.5 µm around 30 µg/m3 of air and 10 µg/m3 of air) could conceivably be associated with a change in life expectancy in the order of years. Another estimate suggests that Dutch men could gain over a year in life expectancy from a reduction in the concentration of particulate matter smaller than 2.5 µm to around 10 µg/m3 of air. Particulate matter is also associated with increases in respiratory symptoms, greater use of drug treatments in people with asthma, reduction in lung function, and admissions to hospital for respiratory and cardiovascular disease. No threshold could be identified below which health effects were not found. In northern Europe, about 40% of particulate matter comes from traffic. Small particles can get indoors freely and can travel long distances, so 18.
(28) neither the indoor environment nor distance from roads offers much protection (Dora, 2003). Most of the Taiwanese believe riding bicycles will expose the rider to the polluted air condition, and endanger their health. However Chertok et al. (2004) observed that international studies have consistently found that exposure to air pollutants is higher inside cars than outside. In their study, they found exposure the lowest levels of exposure to Benzene, Toluene, Ethyl and Xylenes (BTEX) were found for train commuters, followed by pedestrian, cyclists, bus commuters, and the highest for the driver of cars. Walking and bicycling are likely to be the most beneficial when routes are away from busy car routes, although even on the same roadway and taking into account increased respiration due to activity. Cyclists in Amsterdam still had 2-3 times lower exposure to pollutants than the drivers of cars. From 1997 to 2007, the grand total of motorized vehicles has increased drastically from 15,345,745 to 20,368,314, that was 5,022,569 registered vehicles accounted for 32.8% of grand total motorized vehicle growth rate; private passenger car has increased from 4,302,622 to 5,568,590, that was 1,265,968 accounted for 29.4% of private passenger car growth rate; motorcycle has increased from 10,051,613 to 13,602,531, that was 3,550,918 accounted for 35.3% of motorcycle growth rate. Table 9 shows the number of registered motor vehicles in Taiwan-fuchien area.. 19.
(29) Table 9. Number of Registered Motor Vehicles in Taiwan-fuchien Area.. Bus. End of Year. Grand. and. Total. Month. Truck. Passenger Car. Subtotal. Private. Business. Subtotal. Private. Business. Subtotal. 1997. 15,345,745. 22,743. 3,269. 19,474. 158,000. 87,702. 74,298. 1998. 15,939,135. 22,871. 3,088. 19,783. 156,239. 81,953. 74,286. 4,545,488. 4,433,195. 1999. 16,317,768. 23,798. 2,878. 20,920. 152,878. 79,434. 73,444. 4,509,430. 4,401,730. 2000. 17,022,689. 23,923. 2,748. 21,175. 155,623. 81,003. 74,620. 4,716,217. 4,608,960. 2001. 17,465,037. 24,053. 2,580. 21,473. 155,140. 81,813. 73,327. 4,825,581. 4,720,641. 2002. 17,906,957. 25,079. 2,326. 22,753. 155,805. 82,649. 73,156. 4,989,336. 4,888,050. 2003. 18,500,658. 25,628. 2,196. 23,432. 157,156. 83,912. 73,244. 5,169,733. 5,071,981. 2004. 19,183,136. 26,453. 2,042. 24,411. 160,460. 85,662. 74,798. 5,390,848. 5,262,693. 2005. 19,862,807. 26,963. 1,883. 25,084. 164,248. 88,049. 76,199. 5,634,362. 5,495,693. 2006. 20,307,197. 27,522. 1,812. 25,710. 166,211. 90,142. 76,069. 5,698,324. 5,555,507. Feb.. 19,938,794. 27,089. 1,873. 25,216. 164,307. 88,091. 76,216. 5,656,743. 5,516,834. Mar.. 19,971,953. 27,069. 1,843. 25,226. 164,627. 88,305. 76,322. 5,660,472. 5,510,911. Apr.. 19,996,131. 27,162. 1,832. 25,330. 164,796. 88,453. 76,343. 5,662,945. 5,522,093. May.. 20,032,243. 27,175. 1,838. 25,337. 165,062. 88,698. 76,364. 5,671,232. 5,529,699. Jun.. 20,071,354. 22,197. 1,839. 25,358. 165,348. 89,007. 76,341. 5,676,052. 5,533,869. July.. 20,120,824. 27,326. 1,825. 25,501. 165,481. 89,162. 76,319. 5,686,467. 5,543,658. Aug.. 20,155,742. 27,373. 1,820. 25,553. 165,727. 89,268. 76,459. 5,683,635. 5,541,144. Sept.. 20,220,450. 27,429. 1,814. 25,615. 165,877. 89,414. 76,463. 5,689,371. 5,546,826. Oct.. 20,252,522. 27,452. 1,813. 25,639. 165,953. 89,610. 76,343. 5,687,845. 5,545,278. Nov.. 20,286,685. 27,504. 1,812. 25,692. 166,036. 89,844. 76,192. 5,693,346. 5,550,676. Dec.. 20,307,197. 27,522. 1,812. 25,710. 166,211. 90,142. 76,069. 5,698,324. 5,555,507. 2007. 20,368,314. 27,608. 1,808. 25,800. 165,985. 90,383. 75,602. 5,712,766. 5,568,590. Jan.. 20,341,288. 27,433. 1,807. 25,626. 166,024. 90,333. 75,691. 5,708,548. 5,565,022. Feb.. 20,368,314. 27,608. 1,808. 25,800. 165,985. 90,383. 75,602. 5,712,766. 5,568,590. 20. 4,411,911. Private. 4,302,622.
(30) Table 9.(continued) Number of Registered Motor Vehicles in Taiwan-fuchien Area. End of. Passenger Car. Pick-up Truck (Light Truck). Year. Motorcycle. Specially Constructed. Subtotal. Heavy-type. Light-type. 46,066. 10,051,613. 5,875,734. 4,175,879. 7,263. 47,642. 10,529,040. 6,199,613. 4,329,427. 618,943. 8,091. 46,159. 10,958,469. 6,496,189. 4,462,280. 652,963. 643,796. 9,167. 50,791. 11,423,172. 6,848,116. 4,575,056. 104,940. 675,533. 665,718. 9,815. 51,528. 11,733,202. 7,131,438. 4,601,764. 101,286. 101,286. 700,978. 690,750. 10,228. 52,002. 11,983,757. 7,386,784. 4,596,973. 2003. 97,752. 97,752. 728,624. 717,915. 10,709. 52,653. 12,366,864. 7,759,650. 4,607,214. 2004. 128,155. 95,665. 758,809. 743,939. 14,870. 52,616. 12,793,950. 8,239,700. 4,554,250. 2005. 138,669. 94,278. 789,222. 770,659. 18,563. 52,743. 13,195,265. 8,746,286. 4,448,979. 2006. 142,817. 92,418. 805,590. 783,979. 21,611. 52,522. 13,557,028. 9,225,155. 4,331,873. Feb.. 139,909. 94,314. 791,827. 772,771. 19,056. 52,659. 13,246,169. 8,812,061. 4,434,108. Mar.. 140,561. 94,331. 793,979. 774,510. 19,469. 52,665. 13,273,141. 8,850,627. 4,422,514. Apr.. 140,852. 94,203. 796,050. 776,245. 19,805. 52,668. 13,292,510. 8,878,655. 4,413,855. May. 141,533. 94,212. 798,294. 778,076. 20,218. 52,666. 13,317,814. 8,913,032. 4,404,782. June. 142,183. 94,040. 799,704. 779,297. 20,407. 52,664. 13,350,389. 8,955,526. 4,394,863. July. 142,809. 93,807. 801,221. 780,634. 20,587. 52,716. 13,387,613. 9,002,158. 4,385,455. Aug.. 142,491. 93,572. 801,980. 781,218. 20,762. 52,799. 13,424,228. 9,049,314. 4,374,914. Sept.. 142,545. 93,306. 803,861. 782,688. 21,173. 52,812. 13,481,100. 9,115,163. 4,365,937. Oct.. 142,567. 93,049. 804,317. 782,968. 21,349. 52,696. 13,514,259. 9,159,118. 4,355,141. Nov.. 142,670. 92,723. 805,164. 783,656. 21,508. 52,567. 13,542,068. 9,198,190. 4,343,878. Dec.. 142,817. 92,418. 805,590. 783,979. 21,611. 52,522. 13,557,028. 9,225,155. 4,331,873. 2007. 144,176. 92,168. 806,811. 784,793. 22,018. 52,613. 13,602,531. 9,291,284. 4,311,247. Jan.. 143,526. 92,246. 806,747. 784,800. 21,947. 52,651. 13,579,885. 9,260,073. 4,319,812. Feb.. 144,176. 92,168. 806,811. 784,793. 22,018. 52,613. 13,602,531. 9,291,284. 4,311,247. and. Business. Taxi. Subtotal. Private. Business. 1997. 109,289. 109,289. 655,410. 648,713. 6,697. 1998. 112,293. 112,293. 657,855. 650,592. 1999. 107,700. 107,700. 627,034. 2000. 107,257. 107,257. 2001. 104,940. 2002. Month. Vehicles. Source: DGBAS, Executive Yuan, R.O. C. (2005). 21.
(31) Motorcycle, the main transportation in Taiwan There are the total of 13,160,350 registered motorcycles in Taiwan, and the Taiwanese population was 22,733,839 people in 2005. This means that an average Taiwanese had 0.58 motorcycle per person. Table 10 shows the registered motorcycles distribution in Taiwan. Table 10. Registered motorcycles distribution in Taiwan. Location. Registered motorcycles. Percent. Location. Registered motorcycles. Percent. Total. 13,160,350. 100.0. Total. 13,160,350. 100.0. Taipei city. 1,030,972. 7.8. Yunlin county. 447,250. 3.4. Kaohsiung city. 1,128,640. 8.6. Chiayi county. 335,874. 2.6. Taiwan province. 11,000,738. 83.6. Tainan county. 723,786. 5.5. Taipei county. 2,035,899. 15.5. Kaohsiung county. 910,680. 6.9. Yilan county. 270,758. 2.1. Pingtung county. 636,487. 4.8. Taoyuan county. 926,342. 7.0. Taitung county. 163,131. 1.2. Hsinchu county. 231,817. 1.8. Hualien county. 223,292. 1.7. Miaoli county. 314,258. 2.4. Penghu county. 60,278. 0.5. Taichung County. 902,938. 6.9. Keelung city. 176,375. 1.3. Changhua county. 828,130. 6.3. Hsinchu city. 230,144. 1.7. Nantou county. 316,986. 2.4. Taichung city. 562,011. 4.3. Chiayi city. 182,422. 1.4. Tainan city. 521,880. 1.4. Source: DBGAS, Executive Yuan, R.O. C. (2005). Average everyday motorcycle commutes distance 29.3% of motorcycle commuters commute distance is longer than 20 km, follow up by the shorter than one km accounting for 15.7%. The total of shorter than ten km commute distance accounted for 58.2% in 2003, and the total of shorter than ten km commute distance accounted for 49% in 2005. It is possible to conclude that shorter than five km (round way for ten km) motorcycle commute distance accounted for the majority of motorcycle trips.. 22.
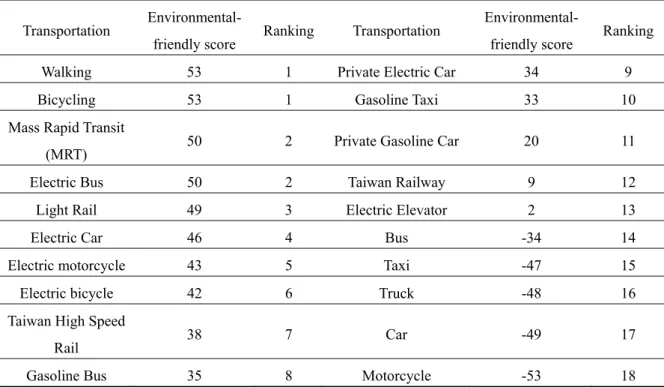
(32) Table 11. Average everyday motorcycle commuting distance (round way).. Unit:%. Item. Total. <1km. 1-3km. 3-5km. 5-10km. 10-15km. 15-20km. >20km. Average. 2003. 100.0. 8.6. 17.7. 15.5. 16.4. 12.1. 9.2. 20.5. 12.2. 2005. 100.0. 7.0. 15.7. 12.1. 14.2. 12.2. 9.4. 29.3. 15.5. 100.0. 6.3. 10.9. 10.0. 12.5. 14.4. 11.3. 34.6. 17.8. 100.0. 7.0. 16.5. 9.4. 16.9. 10.6. 7.3. 32.2. 16.2. 100.0. 7.1. 16.2. 12.7. 14.1. 12.1. 9.4. 28.3. 15.2. 100.0. 3.2. 12.0. 11.3. 15.1. 13.5. 11.8. 33.2. 17.2. 100.0. 3.2. 10.3. 8.3. 16.1. 13.2. 11.8. 37.1. 18.2. 100.0. 5.2. 16.2. 14.2. 12.3. 13.5. 8.0. 30.4. 16.0. 100.0. 11.7. 23.6. 16.4. 13.9. 12.7. 6.3. 15.4. 10.2. 100.0. 15.4. 28.5. 16.2. 16.4. 8.9. 5.7. 8.8. 7.4. 100.0. 7.3. 7.4. 8.0. 9.6. 8.1. 7.5. 52.0. 24.1. Location Taipei city Kaohsiung city Taiwan province Purpose Commuting to work Commuting to school Business Pick up family Shopping Recreation and travel. Source: DBGAS, Executive Yuan, R.O. C. (2005). As many transportation scholars/experts all over the world have pointed out, bicycle transport is regarded as a “green” mode of transportation because bicycles emit no pollution (Liu, Wei, Guan & Ma, 2003). Hsieh (2002) claimed that bicycling is an environmental friendly mode of transportation. There is an environmentally-friendly score chart below. Bicycling and walking are ranked as number one.. 23.
(33) Table 12. Bicycle, the Green Transportation. Transportation. Environmentalfriendly score. Ranking. Transportation. Environmentalfriendly score. Ranking. Walking. 53. 1. Private Electric Car. 34. 9. Bicycling. 53. 1. Gasoline Taxi. 33. 10. 50. 2. Private Gasoline Car. 20. 11. Electric Bus. 50. 2. Taiwan Railway. 9. 12. Light Rail. 49. 3. Electric Elevator. 2. 13. Electric Car. 46. 4. Bus. -34. 14. Electric motorcycle. 43. 5. Taxi. -47. 15. Electric bicycle. 42. 6. Truck. -48. 16. 38. 7. Car. -49. 17. 35. 8. Motorcycle. -53. 18. Mass Rapid Transit (MRT). Taiwan High Speed Rail Gasoline Bus. Source: Chang (2000) translated by the researcher. There are 23 million Taiwanese with 13 million motorcycles and six million automobiles (Chang & Wu, 2005). An average Taiwanese owns 0.78 motorized vehicles; however, these two motorized vehicles are listed as the second to last and last on the environmentally-friendly ranking scale. However bicycles, as a mode of transportation, are owned by only one in 20 people in Taiwan. The Taiwanese government should promote bicycling as a means of commuting or recreation to reduce air pollution, decrease traffic congestion, and promote a healthy lifestyle. There are a variety of bicycle facilities; the American Association of State Highway and Transportation Officials (AASHTO) have classified bicycle facilities into seven categories.. 24.
(34) Table 13. Examples of Bicycle Facilities. Facility. Description Any road, path, or way which in some manner is specifically designated as being open to bicycle travel,. Bikeway. regardless of whether such facilities are designated for the exclusive use of bicycles or are to be shared with other transportation modes.. A bikeway physically separated from motorized vehicular traffic by an open space or barrier and either within the highway right-of-way or within an independent right-of-way.. Bicycle Path (Taichung County). A portion of a roadway which has been designated by striping, signing and pavements marking for the preferential or exclusive use of the bicyclist.. Bicycle Lane (Taitung County). 25.
(35) A segment of a System of bikeways designated by the jurisdiction having authority with appropriate directional and informational markers, with or without a specific bicycle route number.. Bicycle Route (Tainan City). Any roadway upon which a bicycle lane is not designated and which may be legally used by bicycles regardless of whether such facility is specifically designated as a bikeway. Shared Roadway (Taichung City). Visual aids which alert cyclists to conflicts and indicate directions, destinations, distances, route numbers and names of crossing streets.. Signing and Marking (Taipei City). 26.
(36) Parking facilities provided at trip origin and destinations including amenities such as bicycle lockers or racks.. Bicycle Parking (Kaohsiung City). Bicycle Parking Shed (Taipei City) Source: The AASHTO Guide, 1991; photo by the researcher Summary Taiwan is known as the kingdom of bicycle manufacturing; however, 95% of the bicycles are used for exports. Compared to motorized vehicles, the bicycle is cheap and economical; however, bicycles are light and have no identification on them. They can easily be stolen by thieves which may reduce the public’s intention to buy and ride bicycles. The bicycle has various functions; it can be used for recreation, competition and commuting purposes. Due to the elevation of Taiwanese GDP, the motorized vehicle ownership is getting higher; the bicycle has changed its status from a commuting tool to a 27.
(37) recreational toy. The Taiwanese government should encourage the public to get involved in recreational bicycling; however, it should also support people to use bicycles as a form of commuting. This would elevate the bicycle usage rate and improve the air quality in Taiwan. According to Chertok et al. (2004), bicycle commuters inhale less polluted air than those who drive cars, however, the commuting situation is different because there are commuting bikeways in foreign countries while Taiwan does not such bikeways. The Taiwanese believe that cyclists inhale more polluted air than those who drive cars. Although bicycling will improve fitness levels, people in Taiwan believe polluted air will endanger their respiratory systems. Often it is people who do not want to use the bicycle as a means of commuting who spread misinformation about the negative health aspects of cyclists breathing polluted air. Global warming, oil crises and roadway congestion, all these problems heighten the problem of motorized vehicles usage; however, the Taiwanese bicycling policy still has not yet been carried out. Moreover, though people who do want to take bicycles as a mean of transport are often discouraged in Taiwan because of polluted air, safety concerns and lack of bikeways. All these problems reduce people’s inclination to bicycle commuting. Taiwan is a crowded and a small island, and most of the people’s commute distance is shorter than five km, and thus is suitable for bicycle commuting. Building commuting bikeways is a desirable approach to elevate bicycle usage, and reduce the air pollution that is causes by motorized vehicles; however, the problem is how and where to build commuting bikeways in such a crowded island. Besides, Taiwanese have gotten accustomed to relying on motorized vehicles, and the question is, will they change their commuting behavior when there are commuting bikeways. 28.
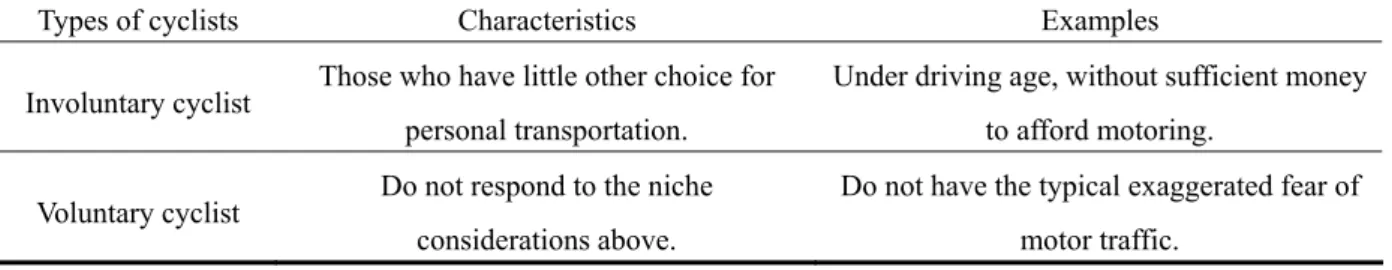
(38) Current Bicycling Conditions and the Motivation for Bicycle Commuting The development of bicycle lanes in Taiwan originated in Taipei and it is based on the purpose of transport function. In 1991, one-metered bicycle lanes were constructed on both sides of the traffic islands. Early in the testing operation stage it failed because the cyclists caused problems with the pedestrians (Chang & Chang 2003). Forester (2005) defined transportation bicycling. It means that bicycles are involved in areas and along routes with motor traffic involves bicycling. Furthermore, Forester (2005) concluded cyclists can be voluntary and involuntary cyclists. Table 14. Types of Cyclists. Types of cyclists Involuntary cyclist. Voluntary cyclist. Characteristics. Examples. Those who have little other choice for. Under driving age, without sufficient money. personal transportation.. to afford motoring.. Do not respond to the niche. Do not have the typical exaggerated fear of. considerations above.. motor traffic. Source: Forester (2005). Current Bikeway System in Taiwan 1. The bikeway development in Taiwan is a top-down procedure, as the central government builds the bicycle facilities and citizens use them as compared with foreign countries’ bottom-up procedure, where bicycle facilities were built to satisfy the need of cyclists.. 29.
(39) Cycling and Cycling. Organization and. Insist government to. Environment. Community Promotion. conduct the plan. Government build them, people use them. Figure 3. The Overseas Bicycle Tourism Model.. Source: Chang & Chang (2003). 2. The Taiwanese government usually stresses protecting the environment, such as by promoting civil engineering work and landscape design but has neglected the characteristics of recreational cyclists and their environmental preferences (H. W. Chang, 2004). 3. There are three kinds of bikeways in Taiwan. (1) Bike path on rights-of-way separate from roadways. This is the safest one. (2) Bike lanes on roadways, separated from motor traffic by a barrier or a painted line. (3) Bike routes on road shared with cars or sidewalks shared with pedestrians.. (1) Bike path. (2) Bike lane. 30. (3) Bike route.
(40) 4. Bikeways in Taiwan shared by bicyclists, hikers, and joggers present the unusual traffic flow situation, and results in a conflict among the three types of users (Yen, Shuien, Shiu, Chiao & Liauo, 2002; Wang, 2004). 5. Bikeways in Taiwan are segregated from major traffic, compared with the integration of bicycle lanes into the existing environment in foreign countries. 6. There are 98 bikeways in Taiwan. The bikeways in Taiwan are a form of sports development, which is used for recreation and rarely for transportation, compared with sustainable development of green transportation mode and green products in foreign countries (Chinese Institute of Landscape Architect in Taiwan, 2002). In most bicycling-oriented European countries roughly two-thirds of trips are utilitarian trips and one-third recreational (Tolley, 1997; Zegeer, 1994). 7. Recreational cyclists in national scenic bikeways and local bike lanes have different preferences. There are two kinds of recreational bikeways in Taiwan. The first are bikeways located in national scenic areas which are built by the central government. The other kind of bikeways are located in local areas and built by the local government. The two types of users differ in terms of accessibility, activity purpose, and attraction (Chang & Chang, 2005). 8. Bicycle parking has been a transportation problem, especially at Mass Rapid Transit (MRT) stations (Tsao & Lin, 2004). Wadhwa (1998) noted that a U.S study found the lack of secure parking facilities and pavement surface conditions to be the principal deterrents to bicycle commuting, while increased exposure to air pollution, traffic and weather were considered to be mildly discouraging factors.. 31.
(41) 9. Professional cyclists’ needs are different with recreational cyclists’ needs. According to the study of K. H. Chang (2004), he wrote that recreational cyclists regard the following three as most important: safety, bicycle lanes and low flow of traffic. The three least important ones are hilliness, satisfying long routes and accommodation facilities. Professional cyclists deem the following three as important: safety, abundant travel resources and hilliness. They believe the following three are the least important: flat terrain, friendly residents and bicycle activities. 10. Men account for most of the bicycle path usage (Krizek, Johnson, Tilahun, 2004; Liao, 2003). Most of the cyclists are 20-30 years old, and most are college-level students. Women make shorter bicycle trips than men (Lo & Lin, 2006). Bikeways in Taiwan are a sport-development phenomena compared with foreign countries’ commuting bikeways, and according to the Chinese Institute of Landscape Architect in Taiwan (2002), there are 80 bikeways in Taiwan. 77 of the bikeways are for leisure and recreational use, while only 3 of the bikeways are for bicycle commuting. Besides, the cyclist percentage in Taiwan is much less than in other foreign countries’. The most effective way to reduce traffic congestion and air-pollution is by bicycle commuting rather than recreational bicycling. The government or policy makers in Taiwan should focus on the development of commuting bikeways. Summary The development of bikeways in Taiwan was based on the purpose of bicycle commuting in 1991. The Chinese Institute of Landscape Architect in Taiwan (2002) conducted a survey which showed that there were a total of 80 bikeways, and three of them were for bicycle commuting. However, the researcher made a phone call to the Sport Council 32.
(42) of Executive Yuan, and the officer responded that there was not a single commuting bikeway in Taiwan in 2006. At first, the bikeway development was based on the purpose of bicycle commuting, and now there is not a single commuting bikeway in Taiwan, so the bicycle commuting situation has gotten progressively worse. On the other hand, the recreational bikeways have increased rapidly to 98 bikeways in 2006. We can thus tell that the bicycle policy in Taiwan pays less attention to bicycle commuting and strengthened its position on recreational bicycling. In January 2007, the researcher toured Taiwan by bicycle in ten days, aiming to investigate the bicycle commuting situation in Taiwan. The researcher found that there are commuting bikeways in Taipei City, Tainan City, Kaohsiung City and Taitung City etc…, however, the utility rate of these bikeways are extremely poor. The researcher observed that the commuting bikeways are rough and not continuous, and these made the bikeway utility rate extremely poor. One of the reasons that Taiwanese do not to bicycle commute is due to the lack of commuting bikeways. Nevertheless, even in big cities like Taipei or Kaohsiung, they did have commuting bikeways, and still bicycle commuting was not popular. According to the researcher’s observations, the researcher concluded: first, commuting bikeways are not continuous, some of the sections of the bikeway are filled with motorized vehicles, second, there are cars, motorcycle or even miscellaneous objects blocking the commuting bikeways, third, the pavement on the commuting bikeways are poor making riders uncomfortable, fourth, the commuting bikeways are set up in remote areas, and riding on them is an inconvenience to riders.. 33.
(43) Global Bicycling Conditions and Bikeway Systems Bicycling in foreign countries by those who enjoy bicycling has had its ups and downs. It was down in the 1920s, up in the Great Depression and until 1950, then down in the 1950s, up again in the 1960s and 1970s, coasted in the 1980s, and again rose in the 1990s (Forester, 2005). With the advent of the automobile and its widespread use, it appeared as though bicycling would have eventually disappeared by the 1960’s. Papon (2001) said that walking and cycling have lost market shares in trips made in France for several decades. However, the gasoline crisis in 1973, the increased of the costs associated with owning an automobile, and the importance of personal fitness, all led to a resurgence of the bicycle (Lohr, 1999; K. H. Chang, 2004). Dora (2003) pointed out that reductions in cycling and walking have been reported in countries for which data are available. In the United Kingdom, cycling accounted for nearly 25% of all road traffic in 1951, but by 1994 this figure had fallen to just one percent. Bicycling is a highly sustainable means of transportation and is used for both commuting and recreational purposes. Over the last two decades, the popularity of bicycling has increased tremendously among all age groups in most developed economies. However, this revival of bicycling has been mainly associated with recreational uses, in particular new forms of bicycling such as mountain biking, while commuting to work has no increased at the same rate (Brandenburg, Matzarakis, & Arnberger, 2004). The Dutch area is about 41,000 square km. It is a little bit bigger than Taiwan which has an area about 36,000 square km. But the Dutch population is about 16 million people and owns 19 million bicycles. Moreover, and the total bikeways length in the Netherlands is more than 17,000 kilometers compared to Taiwan’s 700 kilometers of bikeway. 34.
(44) Copenhagen, the capital of Denmark, has a population of about 1.8 million people. Approximately one-third use bicycles to commute to work and only one-quarter drive to work. Ninety percent of Copenhageners own a bicycle. Those who do not use their bike to commute to work use it for exercise or to run errands (Rollman, n.d.). Replogle (1995) pointed out that road building was abandoned in the early 1970s. A large numbers of bus priority lanes were introduced, and a comprehensive network of segregated cycle paths were built. The result was a ten percent decrease in traffic since 1970 and an 80% increase in the use of bicycles since 1980. About one-third of commuters now use cars, one-third use public transport, and one-third use bicycles. Cycling accidents have decreased slightly, despite the increase in mileage, because of the network of cycle paths, which in many cases were created by reallocating arterial street space from cars. Tokyo, Japan is a good example of cycling nation. About 7.1% of the total urban areas is used for roadways and a city metro network of 614 km in length. The ownership of motor vehicles is 234 per 1,000 people. Despite such high motorization, bicycle mode shares 36.1% of the total trips made in the Tokyo areas. This percentage is still rising. The Bicycle Law issued and implemented by the Japanese government in 1980 encourages the local governments to provide bicycle lanes and bicycle parking facilities near the metro stations. Japan has concluded that the bicycle is an essential component of the passenger transportation system. As a complementary tool, bicycles function “feeding” the passengers into the public transportation system. Many commuters actively commuted to work because the distance was “short” and the public transport service and infrastructure was “poor” (Oja, Vuori & Paronen, 1998). Active commuters were also motivated by a desire for fresh air and to improve their overall health 35.
數據
+7


相關文件
For goods in transit, fill in the means of transport in this column and the code in the upper right corner of the box (refer to the “Customs Clearance Operations and
了⼀一個方案,用以尋找滿足 Calabi 方程的空 間,這些空間現在通稱為 Calabi-Yau 空間。.
develop a better understanding of the design and the features of the English Language curriculum with an emphasis on the senior secondary level;.. gain an insight into the
Then, it is easy to see that there are 9 problems for which the iterative numbers of the algorithm using ψ α,θ,p in the case of θ = 1 and p = 3 are less than the one of the
Third, during period of DPP as ruling party, little evidience shows that connecting with DDP increases dividend, yet there is significance negative relationship between the
專案執 行團隊
Microphone and 600 ohm line conduits shall be mechanically and electrically connected to receptacle boxes and electrically grounded to the audio system ground point.. Lines in
Digital PCR works by partitioning a sample into many individual real-time PCR reactions, some portion of these reactions contain the target molecules(positive) while others do
