A Study of a Ti-rich Ti
51Ni
44Si
5Shape Memory Alloy
1S. F. Hsieh, 2 H. C. Lin and 1W. M. Wu
1 Department of Mold and Die Engineering, National Kaohsiung University of Applied Science,
Kaohsiung, Taiwan 807, Republic of China E-mail : [email protected] 2 Department of Materials Science,
Feng Chia University, Taichung, Taiwan, Republic of China
Abstract
Ti51Ni44Si5 alloy exhibits martensitic transformation,in which the transformation peak
temperatures A* and M* of this alloys are higher than those of equiatomic or Ni-rich TiNi alloys, but lower than those of Ti51Ni49 alloy. There are three different phases in 950℃ annealed
Ti51Ni44Si5 alloy, including the gray Ti(Ni,Si) matrix, the black Ti5(Ni,Si)3 particles and the gray
χ phase. DTA test results show that the annealed Ti51Ni44Si5 alloy has three endothermic peaks in
the thermograph, in which the 1168℃ endothermic peak is associated with the reverse eutectic transition of the Ti5(Ni,Si)3 phase accompanied with the local Ti(Ni,Si) matrix molten around the
Ti(Ni,Si) grain boundaries, the 1270℃ endothermic peak is associated with the reverse peritectic transformation of χ-phase→Ti(Ni,Si)+Liq. and the one at 1293℃ is the dissolution reaction of Ti(Ni,Si)→ Liquid.
Keywords : Ti5(Ni,Si)3 phase; χ-phase; Peritectic and Eutectic reaction.
1. Introduction
Among many shape memory alloys (SMAs), TiNi alloys are the most popular due to their superior shape memory effect and superelastic properties. The application of these alloys has spread not only to engineering but also to medical and dental fields. TiNi thin film fabricated by r.f.-sputtering are considered to be promising candidates for microactuators due to their large deformation and strong recovery force. The sputtering TiNi thin film deposited on Si substrate is amorphous and does not behave as a SMA. Therefore,crystallization annealing is necessary [1]. However, if the annealing temperature is higher than 600℃, Ni and Si atoms diffuse across the interface of TiNi thin film and Si substrate and ternary silicides such as Ti1Ni1Si1, Ti4Ni4Si7 are
formed at the interface. At the same time, it is well-known that a small deviations from stochiometry in TiNi SMAs can give rise to significant precipitation of second phases [2,3]. This in turn affects both the alloy’s strength and its shape memory effect. A peritectic reaction is expected to occur in Ti-rich TiNi alloys. As to, a small amount of Ni replaced by Si in a Ti-rich Ti51Ni44Si5
SMA which ternary silicides can be formed. The effect of Si addition on the characteristics of the peritectic reaction in this alloy is still not clarified. Furthermore, the shape memory behavior of a
Ti-rich Ti-Ni-Si SMAs. The aim of silicides in Ti-rich Ti-Ni-Si SMAs. The aim of present work is to investigate the characteristics of these compounds associated with which reactions may be occurred in a Ti-rich Ti51Ni44Si5 SMA.
2. Experimental Procedure
The conventional tungsten vacuum arc melting technique was employed to prepare a Ti51Ni44Si5 alloy. Titanium (purity: 99.9%), nickel (purity: 99.9%) and silicon ( purity: 99.9%),
totaling about 100 g, were melted and remelted at least six times in an argon atmosphere. Pure titanium button was also melted and used as a getter. The mass loss during the melting was negligibly small. The as-melted buttons were homogenized holding at 950℃ for 3 days and furnace-cooled. The homogenized buttons were cut intoseveral plates with a low speed diamond saw. The homogenized specimens were annealed at 950℃ for 14 days in evacuated quartz capsules and then quenched into ice water. In order to identify phases, some of the annealed plates were heated up to 1175℃ and 1220℃, respectively, and then quenched into ice water. The acquired specimens were polished for DSC/DTA measurements and EPMA examination. DSC measurement was conducted with a Dupont 9990 thermal analyzer equipped with a quantitative scanning system 910 DSC cell for controlled heating and cooling runs on samples encapsulated in an aluminum pan. The running temperature range was from 0℃ to 200℃ with a heating and cooling rate of 10℃ /min. The continuous heating experiments were conducted using a differential thermal analyzer (DTA) in which a bulk sample was analyzed in an Al2O3 crucible using a Perkin Elmer DTA7
under a flowing purified argon atmosphere. The running temperature range was from 900℃ to 1400℃ with heating rate of 10℃/min. Microstructure observations employed JEOL JXA-8600 SX EPMA, which was utilized to take the image, line-scanning profiles (LSPs) and quantitative chemical compositions. The EPMA was operated at 15 Kv with a probe current 100 nA.
3. Experimental results and discussion
3.1 The transformation behavior in Ti51Ni44Si5 alloy
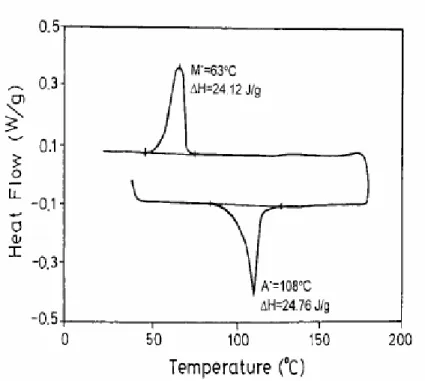
Figure 1 shows the experimental result of DSC measurement for the annealed Ti51Ni44Si5 alloy
in both forward and reverse transformations. The peak temperatures A* and M* appearing in Figure 1 are identified as being associated with the martensitic transformation of B2 . B19’. The transformation temperatures A* and M* of the Ti-rich Ti51Ni44Si5 alloy is higher than those of
equiatomic or Ni-rich TiNi alloys, but slightly lower than those of Ti51Ni49 alloy. This result
indicates that the Si solid-soluted in Ti-rich TiNi alloys may result in a different chemical free energy between binary TiNi and ternary TiNiSi SMAs.
Figure 1. DSC curve for annealed Ti51Ni44Si5 alloy 3.2 The phases in annealed specimen
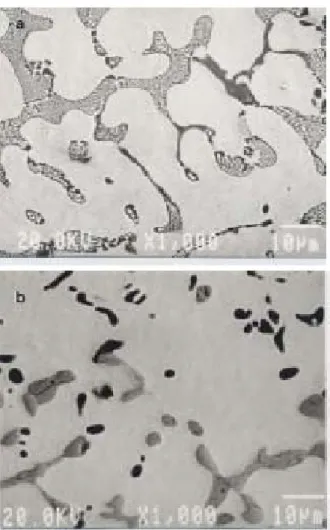
Figures 2 (a) and (b) show the EPMA back-scattering electron image (BEI) of the arc-melted and 950℃ annealed Ti51Ni44Si5 alloy. In Figure 2 (a), the second phase particles and laminar
structure locate around the grain boundaries. Because the intensity of the back-scattering electron is proportional to the atomic number of the individual element in the illuminated area, the darker areas in Figure 2 (b) indicate the regions of the larger Si, Ti and the lower Ni contents. On the contrary, the brighter ones have the higher Ni and the lower Si, Ti contents. It is clear that there are three different contrast areas, including the gray matrix, the darker (i.e. black) particles and brighter (i.e. gray) ones, coexisting in the Ti-rich Ti51Ni44Si5 alloy. Note that gray matrix has the higher Ni and
lower Si contents than those of brighter (gray) particles. The chemical compositions of these particles and matrix determined by the EPMA Wave Dispersed spectrometer (WDS) are shown in Table 1. The ratio of Ti/(Ni+Si) in the matrix, black particles and gray particles are about 1.06, 1.7 and 1.07 for this alloy is also shown in Table 1. Compared with Ti-Ni and Ti-Si binary phase diagrams, the results of Table 1 indicate that the gray matrix in Figure 2 (b) is the Ti(Ni,Si) phase, the black particles are the Ti5(Ni,Si)3 phase. However, the gray particles in Figure 2 (b) should be a
new Ti-Ni-Si ternary phase except that Ti(Ni,Si) phase for the ratio being nearly equal to one. In order to clarify the relations among these three phases, a further experiment is conducted in Section 3.3.
Figure 2. The EPMA back-scattering electron image (BEI) of ( a ) vacuum-arc melted, and( b ) 950℃ annealed Ti51Ni44Si5 alloy.
Table 1. The compositional analyses for annealed Ti51Ni44Si5 alloy at 950℃×14 days
Figure 3 is the BEI with Ti, Ni and Si line-scanning profiles for the annealed Ti51Ni44Si5alloy
at 950℃ for 14 days. Note that Ti concentration increases in black particles and decreases in brighter particles. On the contrary, Ni concentration decreases in black particles and increases in brighter particles. The black particles have higher Si content than the gray particles. The primary difference between the black and white particles is thus their Ti/(Ni+Si) ratio. The compositional partition phenomena of Ti, Ni and Si elements in both particles is why they have a distinct
contrasting image in the observed microstructures of Figures 2 (b) and 3. According to the 750℃ Ti-Ni-Si ternary isotherm diagram proposed by Markiv et al. [4], there is a ternary χ phase ( Ti5Ni4Si1 ) existing in the Ti-Ni-Si ternary alloy system, in which the composition of this phase
could not be identified; this phase crystallizes in the composition range 50~55 at.% Ti and 10~15 at.% Si. Based on the data of Table 1 and 750℃ Ti-Ni-Si ternary isotherm diagram, Figure 2 (b) shows that the gray matrix, black and gray particles should be corresponding to the Ti(Ni,Si), Ti5(Ni,Si)3 and χ phases in this alloy.
Figure 3. The BEI with Ti, Ni and Si line-scanning profiles for Ti51Ni44Si5 alloy annealed at 950℃×14 days. 3.3 The DTA thermograph of Ti51Ni44Si5 alloy and the characteristic of each phase
In order to understand the characteristics of the above mentioned three phases, a DTA analysis was conducted on the annealed Ti51Ni44Si5 alloy, as shown in Figure 4. In Figure 4, three
endothermic peaks appear at about 1168℃, 1270℃ and 1293℃, respectively. To 1168℃, 1270℃ and 1293℃, respectively. To understand the phase transformation related to each peak of Figure 4, some specimens of this alloy were heated up to 1175℃ or 1220℃. The experimental results are discussed as follows.
Figure 4. DTA thermograph of the 950℃ annealed Ti51Ni44Si5 alloy. 3.3.1 The characteristic of Ti5(Ni,Si)3 phase
In order to reveal which phase transition is associated with the 1168℃ endothermic peak shown in Figure 4, one annealed specimen in Ti51Ni44Si5 alloy was heat-treated at 1175℃ for 8
minutes and then quenched into ice water. The microstructure of this specimen observed by BEIs of EPMA is shown in Figure 5. As the specimen was heated to 1175℃, it was discovered that a small amount of liquid phase flowed out on this specimen’s surface, indicating that the 1168℃ phase transition involves a liquid phase reaction.
As seen in Figure 5 (a) the Ti(Ni,Si) grains have obviously grown and they are larger than the as-annealed ones shown in Figure 2(b). In Figure 5(a), the morphology of the gray particles (χ -phase) remains unchanged just as the as-annealed ones. Only the black Ti5(Ni,Si)3 particles change
their morphology and spread out along Ti(Ni,Si) grain boundaries due to their changing into liquid phase at 1175℃. Figure 5(b) shows the magnification of Figure 5(a) on the right upper corner, in which the microstructure of the liquefied phase reveals finer laminar structure around the gray matrix. Therefore, the phase liquefied at 1175℃ should be the Ti5(Ni,Si)3 phase molten which is
Figure 5. ( a ) The EPMA back-scattering electron image, and ( b ) the magnified morphology of ( a ) in the right upper corner for Ti51Ni44Si5 alloy heat-treated at 1175℃ for 8 minutes and then quenched into ice water.
From Figure 2(a), the second phase particles and laminar structure located around the grain boundaries of the Ti(Ni,Si) grains can be gradually separated due to the composition partition by the interdiffusion on Ti, Ni and Si among these phases. Therefore, the compositional phases can be separated by the 950℃ annealing procedure, as shown in Figure 2(b). The microstructural evolution in the homogenized specimen can be occurred before that, and then, the composition of the black particles and local Ti(Ni,Si) matrix in the neighborhood of them can be analyzed by the EPMA WDS. The average compositions of the black particles and neighboring matrix are Ti55.85Ni17.52Si26.63 and Ti52.51Ni41.82Si5.67, respectively. Based on the Ti-Si and Ti-Ni binary phase
diagrams, the melting point of Ti5Si3 and TiNi phases are 2124℃ and 1312℃, respectively. The
reverse eutectic reaction Ti5(Ni,Si)3 + local Ti(Ni,Si) near the black particles → Liq. at 1175℃
may be occurred by the interdiffusion of Ti, Ni and Si atoms among these phases, in which phases transition make the black particles ,Ti5(Ni,Si)3 phase, increase Ni content but decrease the Ti and Si
contents, on the contrary, local Ti(Ni,Si) matrix near them decrease Ni content but increase the Ti and Si contents; black particles and neighboring Ti(Ni,Si) matrix may reach the concentration for reverse eutectic reaction to be occurred at 1175℃. Therefore, the phase liquefied at this temperature
associated with the solid+solid → liquid reverse eutectic transition of Ti5(Ni,Si)3 phase.
There are some χ particles that have been trapped inside the Ti(Ni,Si) grains, as shown by the single arrow in Figure 5(a). This phenomenon is quite different from that exhibited in 950℃ annealed specimens of Figure 3 in which all particles are located around the Ti(Ni,Si) grain boundaries. It is speculated that these particles trapped inside the Ti(Ni,Si) grains and without contacting the liquid phase were produced by the rapid moving velocity of Ti(Ni,Si) grain boundary at a high temperature. The higher the heating temperature, the larger the grow rate of Ti(Ni,Si) grains and the faster the moving velocity of Ti(Ni,Si) grain boundaries. Thus, if the χ particles can not move in the same direction as the moving Ti(Ni,Si) grain boundaries, They will be trapped inside the Ti(Ni,Si) grains, as those mentioned above. Certainly, the liquefied phase can move rapidly due to its fluidity. Therefore, some of χ particles can move with the flowing liquid and aggregate together at Ti(Ni,Si) grain boundaries after the specimen has cooled down, as shown by the double arrows in Figure 5(a). Meanwhile, some of the smaller Ti(Ni,Si) particles can be left in the flowing liquid, as shown in Figure 5(b), due to the reverse eutectic reaction is proceeding around the Ti(Ni,Si) grain boundaries and then, the remainder of the Ti(Ni,Si) particles can be left behind after this reaction. The average composition of the smaller Ti(Ni,Si) particles in the flowing fluid and liquefied phase after reverse eutectic transition are Ti51.65Ni45.98Si2.37 and
Ti51.36Ni36.39Si12.25, respectively.
3.3.2 The characteristic of χ phase
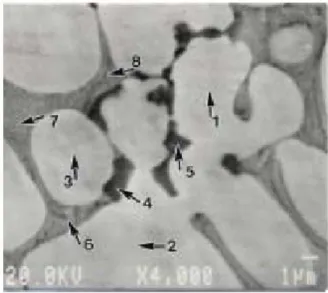
In order to clarify what reaction is associated with the 1270℃ endothermic peak of Figure 4, another annealed specimen in this alloy was heated at 1220℃ for 5 minutes and then quenched into ice water. The microstructure of this specimen observed by BEI of EPMA is shown in Figure 6. In Figure 6, there are two different morphologies of the gray particles coexisting with the Ti(Ni,Si) matrix, which are included as the larger and finer particles locally confined around the grain boundaries of Ti(Ni,Si) grains. The larger particles have been proven by the EPMA WDS analysis to be the χ phase (Ti50.59Ni47.84Si11.97). Obviously, much more finer χ particles have been
partially decomposed in the flowing fluid around several Ti(Ni,Si) grains. The similar morphologies are also found in Ti-rich TiNiZr alloys, in which (Ti,Zr)2Ni phase has been encountered with the
reverse peritectic reaction at 990℃ [5]. This feature indicates that the 1270℃ endothermic peak appearing in Figure 4 is associated with the reverse peritectic reaction χ phase →Liq.+Ti(Ni,Si). However, there are still many χ particles retained in the Ti(Ni,Si) grain boundaries. It is reported the time needed for the completion of the peritectic reaction is a function of the undercooling degree and of the solute diffusion coefficient [6]. We suggest that this phenomena may also occur in the reverse peritectic transformation of χ particles which need a rather long time for solute diffusion among these phases to fully decompose at 1220℃.
Figure 6. The EPMA back-scattering electron image for Ti51Ni44Si5 alloy heat-treated at 1220℃ for 5 minutes and then quenched into ice water
The numbers #1~#8 shown by arrows in Figure 6 indicate the locations of compositional analyses By EPMA WDS. The acquired compositions are shown in Table 2. The last column of Table 2 also shows the corresponding phase of each location, estimated from the 750℃ Ti-Ni-Si ternary isotherm diagram and the analytic results of Section 3.2. For examples, in Figure 6, the gray matrix (#1~#3), the larger (#4~#5) and the smaller (#6~#8) particles are the Ti(Ni,Si) phase, χ phase and decomposedχphase. The finer decomposed χ particles (#6~#8) take its average composition because it may be included the phases induced by the reverse peritectic reaction. Based on the data of Table 2, the χ particles show the lower Ti content than their original ones in Table 1. Thus, the finer decomposed χ particle has the lower Ti content than that of the liquefied phase (Ti51.36Ni36.39Si12.25) formed by reverse eutectic reaction, as mentioned in Section 3.3.1. These
features indicate the new Ti(Ni,Si) phase forms during the reverse peritectic reaction and it grows on the interface of the original Ti(Ni,Si) matrix. Meanwhile, the interdiffusion of Ti, Ni and Si atoms among χ, Ti(Ni,Si) and decomposed χ phases during the reverse peritectic reaction make the χ phase and decomposed χ phase decrease their Ti and Si contents but increase Ni content, as seen with locations #4~#5 for the former and locations #6~#8 for the latter in Figure 6.
Table 2. The compositional analyses for Ti51Ni44Si5 alloy heat-treated 1220℃×5 minutes and then quenched into ice water.
Concerning the endothermic peak appearing at 1293℃ in Figure 4, we suggest that it is the dissolution reaction of the Ti(Ni,Si) → Liquid. From a thermodynamic point of view, the solid-soluted impurity will lower the melting point of the original pure material. This phenomenon should also occur in Si soluted TiNi alloy, in which the melting point of TiNi is 1312℃, but that of Ti(Ni,Si) is around 1293℃.
In summary, There are three different phases in 950℃ annealed Ti51Ni44Si5 alloy, including
the gray Ti(Ni,Si) matix, the black Ti5(Ni,Si)3 particles and the gray χ phase. There are three
endothermic peaks in the DTA thermograph of the annealed Ti51Ni44Si5 alloy. The peak at 1168℃
is associated with the reverse eutectic transition of the Ti5(Ni,Si)3 phase accompanied with the local
Ti(Ni,Si) matrix molten around the Ti(Ni,Si) grain boundaries. The peak at 1270℃ is associated with the reverse peritectic transformation of χ-phase →Ti(Ni,Si)+Liq. The peak at 1293℃ is the dissolution reaction of Ti(Ni,Si) → Liquid.
Reference
[1] Chen, J. Z. and S. K. Wu, “Crystallization Behavior of R. F.-Sputtered TiNi Thin Films,” Thin
Solid Films, Vol. 339, 1999, pp 194-199.
[2] Nishida, M., C. M. Wayman, and T. Honda, “Precipitation Processes in Near-Equiatomic TiNi Shape Memory Alloys,” Metall. Trans., Vol. 17A, 1986, pp 1505-1515.
[3] Lin, H. C., S. K. Wu, and J. C. Lin, “The Martensitic Transformation in Ti-rich TiNi Shape Memory Alloy,” Materials Chemistry and Physics, Vol. 37, 1991, pp. 184-190.
[4] Markiv, V. and E. I. Ya, “GLADYSHEVSKII, P. I. KRIPYAKEVICH, and T. I. FEDORUK, Ti-Ni-Si,” Inorganic Mater., Vol. 2 , 1996, pp 1126-1127.
[5] Hsieh, S. F. and S. K. Wu, “Room-Temperature Phase Observed in Ti53-XNi47ZrX High Temperature Shape Memory Alloys,” J. Alloys and Compounds, Vol. 266, 1998, pp. 276-282. [6] Lopez, H. F., “Analysis of Solute Segregation Effects on the Peritectic Transformation,” Acta