J O U R N A L O F M A T E R I A L S S C I E N C E : M A T E R I A L S I N E L E C T R O N I C S 9 ( 19 9 8 ) 14 5 — 15 0
Effect of MgO addition on the electrical transport
properties of highly Sb-doped BaTiO
3
ceramics
B I - S HI O U C HI O U , I - HO R N W A N G
Dept. of Electronics Engineering and Institute of Electronics, National Chiao Tung University,
Hsinchu, Taiwan
BaTiO3ceramics doped with Sb donors and Mg acceptors have been fabricated. The lattice
constant ratio
c
/a
and the Curie pointTc
decrease with increasing Sb concentration. The minimum room temperature resistivityqminof the codoped BaTiO3occurs at a compositionof 0.9 mole% Sb2O3-1 mole % MgO as compared to the literature reportedqminat 0.3 mole % antimony for the Sb2O3-doped BaTiO3. The Mg2# ion acts as an acceptor in the BaTiO3
ceramics, which compensates the donor contribution from Sb3# and shifts the
doped-BaTiO3semiconducting region to higher antimony content. The calculated donor
concentration confirms the compensation effect of Mg acceptors over Sb donors. The temperature dependence of both barrier height and dielectric constant of specimens is discussed. 1998 Chapman & Hall
1. Introduction
Barium titanate has attracted much attention in the field of electronic ceramics. Doped, n-type barium titanate ceramics exhibit an abrupt rise in resistivity near the Curie temperature (¹c): the so-called positive temperature coefficient of resistivity (PTCR) effect. This anomaly of resistivity renders barium titanate useful in various applications [1, 2]. Many factors affect the PTCR phenomena of BaTiO3 ceramics such as: the concentration and the distribution of the trace additives [2—6], the impurities in the raw materials, and the firing conditions [7—9].
The U-shaped relation between the dopant ion con-tent and the resistivity of semiconducting BaTiO3 is well known [5]. For Sb2O3-doped BaTiO3, the minimum resistivity exists at 0.3 mole % content of antimony dopant. However, an insulating BaTiO3 is obtained beyond that range [10]. Previous work by Chiou et al. [7] reported that the Curie point of BaTiO3-based ceramics was altered by addition of Sb2O3 and the dielectric peak was maintained by the presence of MgO additive. In addition, the presence of magnesium ions, which acted as acceptors, pushed the BaTiO3 semiconducting region to higher Sb2O3 con-tent. However, the effect of MgO on Sb-doped BaTiO3 is not well known.
In this study, the dielectric properties and PTCR effect of MgO-Sb2O3 codoped BaTiO3 are investi-gated. The antimony dopant content employed is lar-ger than normally reported [11]. The doping concentrations in these specimens are 1 mole % MgO, 0.05 mole % MnO2, and 0.8 to 1.0 mole % Sb2O3. The addition of MnO2 enhances the PTCR effect [7]. Manganese is an acceptor dopant. Ting et al. [12] reported that the acceptor effect of Mn2` became pronounced only at an Mn2` concentration of above
0.05 mole %. Illingsworth et al. [17] found that a small addition of Mn (0.04 mole %) to BaTiO3 had negligible effect on both the bulk resistance and the dielectric constant above ¹#. A 0.05 mole% MnO2 addition in this study optimizes the PTCR phe-nomena while minimizing the acceptor effect of Mn2`. The possible role of Mg in the PTCR behaviour of highly Sb-doped BaTiO3 is discussed.
2. Experimental procedures
Samples were prepared by a conventional ceramic fabrication process. Appropriate amounts of BaCO3, TiO2, MgO, MnO2, and Sb2O3 (reagent grade, Merck & Co. Inc., Darmstadt, Germany), together with ethyl alcohol, were ball-milled for 24 h. The mo-lar ratio of BaCO3 and TiO2 was 1:1.01, excess TiO2 was added to obtain a TiO2-rich liquid phase during sintering [7]. After drying, the mixture was calcined in an alumina crucible at 1100 °C for 2 h, then crushed into powder and pressed into a disk-shape specimen, 10 mm in diameter and 1.5 mm in thickness. Sintering was carried out with an initial heating rate of 100 °C min~1 to 1200 °C, and held at 1200 °C for 6 min, then heated to 1400 °C at 100 °C min~1 and held at 1400 °C for 18 min. The two-stage firing result-ed in a more uniform microstructure than a single-stage firing [7]. After sintering, electrodes were ap-plied to the specimens by rubbing In-Ga (40 : 60) alloy on both surfaces to provide ohmic contacts.
The resistance of samples was measured with a pA meter (HP4140B, Hewlett Packard). The impedence of samples was measured with an impedence analyser (HP4192A). The densities of the sintered specimens were determined by the Archimedes method. Micro-structure and elemental distribution of the samples
( 1998 Chapman & Hall 145
976 78 BR R S AV IT H A VI JA Y A
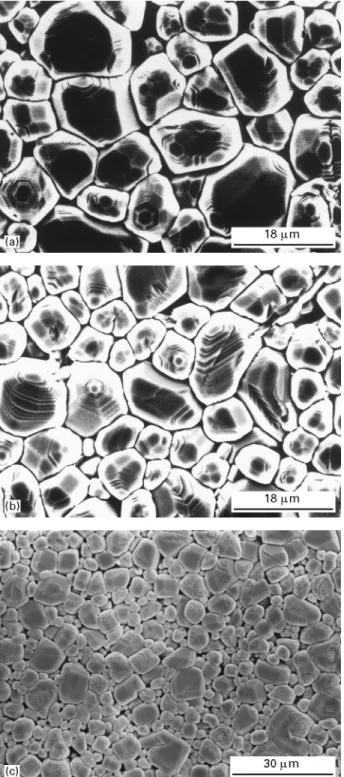
Figure 1 SEM micrographs for BaTiO3 doped with 1.0 mole%
MgO, 0.05 mole % MnO2 and x mole% Sb2O3. (a) x"0.8, (b)
x"0.9, and (c) x"1.0.
were examined with a scanning electron microscope (SEM, Hitachi, S-570) and an electron microprobe analyser (EPMA, JEOL JCXA-733, Japan). Phase identification of the samples was carried out with an X-ray diffractometer. The average grain size of the sample was determined by the linear intercept method from the scanning electron micrograph of the as-fired surface.
3. Results and discussion
The microstructures for Sb2O3-doped BaTiO3 are shown in Fig. 1. The average grain size is 9.2, 7.0, and 5.0lm for samples doped with 0.8, 0.9, and 1.0 mole % Sb2O3, respectively. Addition of Sb2O3 inhibits the grain growth of BaTiO3 ceramics. The X-ray diffrac-tion (XRD) patterns indicate that the specimens are of perovskite structure. The lattice constant as a function of Sb2O3 concentration is calculated on the basis of the XRD results and shown in Fig. 2. In contrast to the decrease in lattice constant c, lattice constant a in-creases and the c/a ratio dein-creases with increasing Sb content. At room temperature a and c for pure BaTiO3 are 0.3992 nm and 0.4035 nm, respectively. These values are not obtained by extrapolating data in Fig. 2 at 0 mole % Sb2O3, because two other addi-tives, MgO and MnO2, are present in BaTiO3 ceram-ics. The theoretical density Dth is calculated from the lattice constants. Table I lists the grain size and the measured and theoretical density of the specimens. The percentage of the Dth increases with Sb2O3 content, the 97.5% Dth is obtained for the 1.0 mole% Sb2O3 sample. Figs 3 and 4 show the temperature variation of the dielectric constant and dissipation factor of the Sb2O3-doped BaTiO3, respectively. The Curie temper-atures are 64 °C, 60 °C, and 55 °C for the 0.85, 0.9, and 1.0 mole % specimens, respectively.
The resistivity q as a function of temperature is given in Fig. 5. The resistivity decreases initially and then increases as the Sb2O3 content increases from 0.85 mole % to 1.0 mole %. The specimen with 0.9 mole % Sb2O3 has the lowest resistivity. The room temperature resistivity for the 0.9 mole % Sb2O3-MgO codoped sample is &240) cm which is compa-rable to the minimum resistivity reported for the Sb2O3-doped BaTiO3 [10]. The ionic radii of Ba2`, Sb3`, Ti4`, and Mg2` ions are 0.135, 0.076, 0.065, and 0.069 nm, respectively [13]. The trivalent Sb3` ions tend to occupy the position of Ba2` in preference to Ti4` ions, while Mg2` would replace Ti4` instead Ba2`, as expected from the radii. Possible defect reac-tions are as follows [12]:
2Sb2O3#4TiO2P4Sb·
B!#4TiXT*#12OXO
#O2#4e@ (1)
2MgO#2BaO#O2P2MgAT*#2BaXB!#6OXO#2h·
(2) Magnesium ions behave as electron acceptors in BaTiO3 and compensate some of the donor Sb3` ions. Consequently, the antimony content for minimum resistivity of Sb2O3-MgO codoped BaTiO3 is higher than that for Sb2O3-doped BaTiO3.
The values of qr.t, qmax, qmax/qr.t, and ¹max are summarized in Table II. The 0.9 mole % Sb2O3 sample has the smallest resistivity increase qmax/qr.t and the largest ¹max among the compositions studied. Also, a strong NTCR effect is noticeable for the specimen with 1.0 mole % Sb2O3 after the max-imum resistivity is reached at about 200 °C, as shown in Fig. 5.
The PTCR effect has been confirmed to originate from the grain boundary property and to be asso-ciated with the ferroelectric-pararelectric phase transition in semiconducting barium titanate ceramics [8, 14]. According to Heywang’s [10, 11] model, the presence of grain boundary depletion layers consisting 976
78 BR R S AV IT H A VI JA Y A
Figure 2 Lattice constant as a function of Sb2O3 concentration.
T A BL E I Average grain size and density for BaTiO3 doped with 1.0 mole % MgO, 0.05 mole % MnO2 and various amounts of Sb2O3
Sb2O3 Average Theoretical Measured Dth
(mol %) grain size density density (%)
(lm) (g cm~3) (g cm~3)
0.8 9.2 5.99 5.66 94.5
0.9 7.0 6.00 5.75 95.8
1.0 5.0 6.01 5.86 97.5
Figure 3 Apparent dielectric constant as a function of temperature
for BaTiO3 doped with 1.0 mole% MgO, 0.05 mole% MnO2, and
x mole % Sb2O3, where x"0.85 (L), 0.9 (K) and 1.0 (d).
Figure 4 Dissipation factor as a function of temperature for BaTiO3
doped with 0.1 mole % MgO, 0.05 mole % MnO2 and
x mole % Sb2O3 at 1 kHz: (d) x"0.85, (L) x"0.9. and (K) x"1.0.
Figure 5 Resistivity as a function of temperature for BaTiO3 doped
with 1.0 mole % MgO, 0.05 mole % MnO2 and x mole% Sb2O3: (L) x"0.85, (K) x"0.9, and (d) x"1.0.
of two-dimensional surface acceptor states gives rise to a potential barrier at the grain boundary as a result of the upward bending of the conduction band, as shown schematically in Fig. 6 [15].
The charge in the surface states equals the charge in the depletion region. Below ¹c, the potential barrier is compensated by the charges arising from the 976
78 BR R S AV IT H A VI JA Y A
T A BL E I I Logarithm of room temperature resistivityqr.t, max
-imum resistivityqmax, resistivity increase qmax/qr.t and temperature of maximum resistivity ¹max for BaTiO3 doped with 1.0 mole% MgO, 0.05 mole % MnO2 and various amounts of Sb2O3
Sb2O3 logqr.t logqmax logqmax/qr.t ¹max
(mol %) () cm) () cm) (°C)
0.85 2.8 8.0 5.2 230
0.9 2.4 7.0 4.6 250
1.0 3.3 9.2 5.9 200
Figure 6 Energy level diagram near a grain boundary [15].
Figure 7 Plots of ln(qdc) against 1/em¹ for BaTiO3 doped with
1.0 mole % MgO, 0.05 mole % MnO2, and x mole% Sb2O3: (L)
x"0.85, (K) x"0.9, and (d)x"1.0. Dielectric constant em is
measured at 1 kHz.
spontaneous polarization, rendering the whole mater-ial conductive. Above ¹#, the spontaneous polariza-tion disappears and the resistivity is controlled by the potential barrier. The barrier height'o is [6, 7, 16]
'o"en2/8eoner (3) and the barrier thickness b is
b"ns/2n (4) where e is the electron charge, n (cm~3) the effective donor concentration within the grain,eo the permittiv-ity of free space, ns number of electrons trapped in the surface states (number is Ns at a distance Es below the conduction level),er the relative permittivity, and
er"C/¹!¹c (5)
where C is the Curie constant and ¹ is the absolute temperature. The measured dielectric constant em of a material consisting of insulating grain-boundary layers and a semiconducting grain is [18]
em"egbd/t (6) where d is the average grain size of the dielectric and egb and t are the dielectric constant and thickness of the insulating grain boundary layer, respectively. In this case,
t"2b (7)
egb"er (8)
and
em"er (d/2b) (9) The dielectric constants of samples in this study are one to two orders of magnitude larger than those of the undoped BaTiO3 at ¹c (i.e. 1000&5000) [11]. Yamamoto and Takao [19] estimated a grain bound-ary layer of &0.26lm thickness for a PTC
thermi-stor. The average grain size of the 0.9 mole % Sb2O3-doped sample is 7.0lm. Substituting these data into Equation 9 one obtainsem values of around 1.3]104 to 6.7]104 which are in agreement with the measured data shown Fig. 3. This suggests that the BaTiO3 ceramic exhibits the characteristics of the so-called grain boundary barrier layer (GBBL) capacitors [18]. From semiconductor theory, the resistivity of the de-pletion layerqL is given by
qL"qo exp(e/o/k¹) (10) For a polycrystalline sample with semiconducting grain and insulating barrier layers, the resistivity can be expressed as
q"qg#qL+qL (11) whereqg is the resistivity of the grain.
Combining Equations 4, 9, 10 and 11 into Equation 3, one has
q"qo exp(e/o/k¹)
"qo exp(Ans/em¹) (12)
A"e2d/8ke0 (13) Fig. 7 is the ln(qdc) versus 1/em¹ plots. It is seen that the slopes of the curves decrease as temperature in-creases from ¹c to ¹max. This suggests a decrease of the grain boundary acceptor states ns with temperature.
Previous work reported a value of ns to be about 1014 cm~2 and n of &3]1019 cm~3 for BaTiO3 doped with 0.07 wt % Sb2O3 [19]. In this study, the ns at ¹c is &4]1013 cm~2 which is of the same order as literature reported data [19]. However, the effective donor concentration n, estimated on the basis of 976
78 BR R S AV IT H A VI JA Y A
Figure 8 The potential barrier height as a function of temperature
for BaTiO3 doped with 1.0 mole% MgO, 0.05 mole% MnO2, and
x mole % Sb2O3: (L) x"0.85, (K) x"0.9, and (d)x"1.0.
Figure 9 Reciprocal of the dielectric constant as a function of
temperature for BaTiO3 doped with 1.0 mole% MgO, 0.05 mole % MnO2, and 0.85 mole% Sb2O3.
dielectric data in Fig. 4 and Equations 4 and 9, is &2]1017 cm~3 which is much smaller than reported data [19]. This confirms that not all of the Sb2O3 addition was effective in making the ceramics semiconducting. Only part of the Sb2O3 addition was effective as donors. Magnesium ions behave as elec-tron acceptors in BaTiO3 ceramics, and compensate some of the donor Sb3` ions.
The barrier height'o is calculated on the basis of Equation 3 and plotted as a function of temperature, as shown in Fig. 8. Combining Equations 3 and 5, one has
'o"ens (¹—¹c)/8Cneo (14) which indicates that, for given values of n and ns, 'o is directly proportional to temperature. However, since
ns decreases as temperature increases, the increase of
'o with temperature is not as great at elevated temper-atures. Hence, a slower increase in'o is observed at temperatures higher than 140 °C, as shown in Fig. 8. In addition, the barrier height increases as the Sb2O3 concentration is raised from 0.9 mole % to 1.0 mole %.
The relation between 1/em and temperature at ¹'¹c, exhibited in Fig. 9, indicates that the Curie—Weiss law is obeyed at temperatures in the range between 70 °C and 130 °C. At higher temper-atures, 1/em still increases linearly, but more slowly with temperature, giving a second region with smaller slope. The number of surface states ns can be expressed as [15]:
ns"Ns/M1#exp[(Ef#e'—Es)/k¹ ]N (15) Equation 9 can be rewritten as:
em"er(dn/ns) (16)
At lower temperatures, the acceptor states at the grain surface are almost fully ionized, i.e. ns+Ns, and em is expected to follow the Curie—Weiss law. However, at sufficiently high temperatures, Ef#e' approaches Es and depopulation of surface states occurs (Fig. 6). The decrease in ns with rising temperature counteracts the reduction of em. Hence, 1/em rises more slowly with temperature once depopulation of the surface states begins.
4. Conclusions
1. BaTiO3 doped with 1.0 mole % MgO, 0.05 mole% MnO2, and various amounts of Sb2O3 were fab-ricated with a two-stage firing profile. The Curie tem-perature and grain size decrease with the increase of Sb2O3 content.
2. For the Sb2O3—MgO codoped samples, the min-imum resistivity, smallest resistivity increaseqmax/qr.t and the largest ¹max occur at 0.9 mole% Sb2O3 for 1 mole % MgO addition.
3. Magnesium ions, substituting as the Ti4` sites, behave as electron acceptors in BaTiO3 and compen-sate some of the donor Sb3` ions. This results in smaller donor concentrations than in other reported work.
4. The measured dielectric constant em is inversely proportional to temperature as predicted by the Curie—Weiss law. However, as depopulation of surface states occurs, 1/em rises more slowly with temperature at higher ¹.
Acknowledgment
This work is supported by the National Science Coun-cil, Taiwan, under the contract NO. NSC
85-2216-E-009-012. 976 78 BR R S AV IT H A VI JA Y A
References
1. B . M . K U L W I C K I ,in ‘‘Grain Boundary Phenomena in Elec-tronic Ceramics’’, Adv. in Ceramics, Vol. 1, edited by L. Levin-son (American Ceramic Society, Inc., Columbus, OH. 1981) pp. 135—154.
2. D. C . H I L LandH . L . T U L L E R ,in ‘‘Ceramic Sensors: Theory and Practice’’, Ceramic Materials for Electronics-Processing, Properties, and Applications, edited by R. C. Buchnan (Mar-cell Dekker, Inc., New York, 1986) pp. 265—374.
3. M. K U W A B A R A ,J. Am. Ceram. Soc. 71 (1988) C110.
4. H. M . A L - A L L A K , T . V . P A R R Y , G . J . R U S S E L and J . WO OD S ,J. Mater. Sci. 23 (1988) 1083.
5. T . M A T S U OK A , Y . M A T S U O, H . S A S A K I and H A Y -A K -A W-A ,J. Am. Ceam. Soc. 55 (1972) 108.
6. H. F . C H E N G ,J. Appl. Phys. 66 (1989) 1382.
7. B . S . C H I O U , C . M . K O HandJ . G . D U H ,J. Mater. Sci. 22
(1987) 3893.
8. C . J . K I MandK . N O ,ibid 28 (1993) 5765.
9. A . B . A L L E S , V . R . W . A M A R A K O O N and V . L . B U R -DI C K ,J. Am. Ceram. Soc. 72 (1989) 148.
10. W. H E Y W A N G ,ibid. 47 (1964) 484.
11. W. H E Y W A N G ,J. Mater. Sci. 6 (1971) 1214.
12. C . J . T I N G , C . J . P E N G, H . Y . L UandS . T . W U ,J. Am. Ceram. Soc. 73 (1990) 329.
13. W. D . K I N G E R Y , H . K . B O WE NandD . R . U HL MA NN , ‘‘Introduction to Ceramics’’, 2nd Edn (John Wiley & Sons, Inc., New York, 1976) p. 58.
14. A . B . A L L E SandV . L . B U R D I C K,J. Am. Ceram. Soc. 76
(1993) 401.
15. G. H . J O N K E R ,Solid State Electron. 7 (1964) 895.
16. G. H . L E W ISandC . R . A . C A T L O W ,J. Am. Ceram. Soc. 68
(1985) 555.
17. J . I L L IN G S W O R T H , H . M . A L A L L A K , A . W . B R IN K -M A NandJ . W O O D S,J. Appl. Phys. 67 (1990) 2088.
18. B . S . C H I O U , S . T . L I N, J . G . D U HandP . H . C HA NG ,
J. Am. Ceram. Soc. 72 (1989) 1967.
19. T . Y A M A M O T OandS. T A K A O ,Jpn. J. Appl. Phys. 31 (1992)
3120.
Received 18 April
and accepted 23 July 1997
976 78 BR R S AV IT H A VI JA Y A