Chiao Da Management Review Vol. 29 No. 1. 2009
pp. 139-173
公司執行長的媒體曝光度會影響公司
績效嗎?
Does CEO Media Coverage Affect Firm Performance?
池祥萱 1 Hsiang-Hsuan Chih國立東華大學 財務金融學系
Department ofFinance;National Dong Hwa University
林煜恩 Yu-EnLin
國立東華大學 企業管理研究所
Department ofBusiness Administration, National Dong Hwa University
陳韋如 Wei-RuChen
國立東華大學 國際經濟研究所
Institute ofIntemational Economics, National Dong Hwa University
周賓嵐 Pin-HuangChou
國立中央大學 財務金融學*
Department ofFinance, National Central University
摘要:本文建立屬於台灣上市公司 CEO 媒體資料庫,探討 CEO 媒體曝光度 對於公司的經營績效與市場績效的影響。我們發現, CEO 籍由大量的媒體曝 光的確會改變大眾對公司的認知,進而造成公司營運狀況的改變。而且不論 CEO 的媒體曝光度是否影響公司的營運狀況,股市投資人皆會因為 CEO 媒 體曝光度,改變其對公司股票的認知,造成公司股價報酬率的變動。主要實 證研究結果如下。第一,公司經營績效較佳、股價報酬率表現較差、公司規 模較大、公司成立時間較久以及家族集團公司的 CEO 較受到媒體的注意。第 二, CEO 媒體曝光度對於短期經營績效有正向影響,但長期有負向影響。第 三 'CEO 媒體曝光度對於公司市場績效有持續的負向影響,主要原因可能是 資訊不對稱及散戶的過度反應。第四 'CEO 若常以正面新聞曝光會顯著增加
I Corresponding author: Department of Finance, National Dong Hwa University, Hualien,
140 Do臼 CEO λ1ediaCoverage Æ戶ctFirm Performance?
公司經著績效,但市場績效卻會顯著下跌。此外,非家族集團公司的 CEO
較能籍由正面或是公司新聞曝光度增加公司的經營績效。 關鍵詞:媒體曝光度;公司績效;行為財務學
Abstract: In this paper, we provide an empirical analysis of the impact of CEO media coverage on the corporate fundamental and market value cons仕ucting the media coverage of Taiwan CEO database. We find that CEO media coverage significant affects the cognition of the public, and further influence fir尬 's
operating performance. We also find that whether CEO media coverage provides information about firm's fundamentals, it will simulate investors' trading behavior and fluctuate the stock returns. The empirical results of this paper are summarized as follows. First, the media pay more attention to the firm CEOs with be位erROA,
worse stock return, larger size, older age and group firms. Second, th巴 CEOmedia
coverage affects ROA positively in the short run because of efficient operation, while negatively in the long run because of worse profitability. Thir昌, the bigger amount of CEO' media coverage is, the larger the drop in the current and future stock returns. The main reasons are information asymmetry and the mark巳t
investors' overre通ction. Finally, if the firms have more positive media coverage, the market performance will decline but the ROA will increase. Comparing with the group firms, the non-group firms can increase ROA by increasing CEO media coverage, especially positive or company-related news.
Keywords: Media coverage; Firm performance; Behavioral finance
1.
Introduction
The impact of CEO media coverage on the public has received increasing attention in both practitioners and and academics. For example, artic1es in The Economise and Fortune3 indicate that the public is unable to calculate a firm's value correctly so as that it has a good impression of the CEOs whom often appear in the mass media. The literature on CEO media coverage has been concentrated in the fields of mass communication, organizational behavior, and
2 The Economi剖, 2002,“CEO'sFallen Idols," 3 Fortune, 2004,“Glamo叮!F血ne! Org Charts."
Chiao Da Management Review Vol. 29 No. 1, 2009 141
marketing (Garbe仗, 1988; Skolnik, 1994; Straughan, Bleske and Zhao, 1996; Graham, 1997; Eichholz, 1999; Deephouse, 2000; Roberts and Dowling, 2002; Rindova et al 2005); these studies focus on how a firm takes advantage of media coverage to strengthen a firm's image and reputation. While studies on these issues are insight削, to the best of our knowled阱, very few studies have directly examined the impact of CEO coverage on firm perfo口nance in finance field.
There are two lines of finance literature on CEO media coverage. 買le first line focuses on the impact of CEO media coverage on the firm's operating performance (Milbourn 2003; Hamilton and Zeckhaus哎" 2004; Gar旬" Gonzalez and Molina, 2004; Malmendier and Tate, 2005), and the second line examines the impact offirm media coverage, instead ofCEO, on the firm's stock return and the
investo肉個ding behavior (Urrutia and Vu, 1999; Barber and Odean, 2008; Tetlock, 2007; Bushee et al 2007).
In a truly e缸icient market, if CEO media coverage does not contain any information content about the firm's operating perfo口nance , it should not have any impact on the firm's fundamental or market value. Although the CEO media coverage makes some investors misprice the fi口n, the rational investor would implement contrarian investing to make the pricing error disappear. On the other hand, the CEO's image and might have impact on a firm's product image indirectly, so CEO media coverage could be viewed as a marketing approach, which in turn inf1uences future sales. Khurana (2002) documents CEO media reports are not only related to management but also related to public relation and image making. Kotler and Andreasen (1996) argue that the marketing public relation not only provides consumers the firm's information, but also establishes the firm's image in their mind. Dick and Basu (1994) and Nguyen and Leblanc (2001) suggest when a firm has a good image,郎 consumer loyalty would be higher and the probability of the second consumption would be larger. Under the above standpoint, CEO media coverage might inf1uence a firm's operating performance ultimately and the firm's market value.
From another viewpoint, behaviorists argue that investors might have cognitive bias that leads them to make decisions by a heuristic approach so that irrational investors' cognition about a firm might be inf1uenced by CEO media
142 Does CEO Media Coverage Affect Firm Performance?
coverage. This reflection in trading behavior would result in ove汀'eaction or underreaction, meaning CEO media coverage might influenc巴 shortor long period stock retums whether the firm operating situation changes or not. Baker, Ruback and Wurgler (2006) further suggest that a rational manager could take advantage of such market irrational reaction by taking some actions to make the firm's market value deviate from the fundamental, which can be referred to as
“caterm皂"
Based on a sample of firms listed on the Taiwan Stock Exchange, this paper investigates whether CEO media coverage can in fact change people's cognition, which in addition can influence a firm's fundamentals thereby causing a change of the operating situation. We also investigate whether investors change their cognition about a firm due to CEO media coverage or not, which makes stock retums fluctuate.
Because the CEO is the most important decision maker and often even a celebrity catching the public's eyes easily, media and the public often pay more attention on the CEO himself and less on reports about the firm (Useem, 2001; Hamilton and Zeckhauser, 2004): Compared with institutional investors, the individual investors' professional ability and information sources are inferior, so they depend more on media reports. To investigate the impact of CEO media coverage on a firm's fundamentals is more important because the majority of investors in Taiwan's stock market are individual investors. However, prior studies have neglected this issue. This paper therefore aims to fill this gap.
To measure the firm's CEO media coverage, we refer to the methodology 企om academic research and practice methods at the same time. We select the most popular newspapers to build a unique Taiwan CEO media coverage database for our research. To investigate whether the type of media report has a different impact on firm performance, we divide every report in detail. First, we divide reports into positive and negative for a firm's CEO by the tone of the report content. Then, we divide the reports into ∞rporate-related reports and CEO-related reports by the 勾rpe ofrepo此 content.
Our results highlight the CEOs with better operations, worse stock retums, bigger firm size, longer histories and group firms would have more media
Chiao Da Management Review Vol. 29 No. 1, 2009 143
coverage. A CEO having more media coverage would influence the public's cognition about the firm. Although CEO media could improve the concurrent year operating performance, the effect would tum to negative in the long period because the CEO might spend too much tim巴 in participating in media activity which makes him neglect managing the firm. Empirical evidence also documents CEO media coverage has a lasting negative impact on stock retums. This might have two reasons. First, CEO media coverage might have impact on information asymmetry, so 甘le firm of lower CEO media coverage has to get higher risk premium to compensate the problem of adverse selection. Second, investors intend to buy stock with high CEO media coverage that induces overreaction; as such, the retum of high CEO media coverage would be lower than the retum of low CEO media coverage in the future. Our evidence also shows that when a CEO has positive media coverage this would improve operating performance but decrease market performance. In addition, compared with a group firm, a CEO in a non-group firm could improve more firm operating performance by positive or corporate-related media coverage.
The rest of the paper proceeds as fol1ows. Section 2 reviews the related literature. Section 3 describes the data and the construction of CEO media coverage index. Section 4 reports the evidence of CEO media coverage index and corporate performance in which we analyze corporate performance by operating performance and market performance. Section 5 analyzes the impact of tone and type of media report on corporate performance. Finally, Section 6 concludes the paper.
2. Literature Review
Prior studies point out that CEO media coverage has a positive impact on firm operating performance. Pincus, Rayfield and Cozzens (1991), Daily and Johnson (1997) and Deephouse (2000) argue that the CEO is a symbol of the corporate leader and successor. They could not only attract more customers, investors and employees to improve sales, but they also make the public believe in the executive's management ability and firm performance. On the con仕a旬,
144 Does CEO Media Coverage Affect Firm Performance?
some literatures have different explanations. Hamilton and Zeckhauser (2004) document the negative impact of CEO media. Firms with higher CEO media coverage have no significant difference in retums on equity, and more CEO coverage by soft news often appears in negative news related to scandals or embezzlement of corporate funds. CEO even possibly increases his or her own media coverage at the expanse ofthe firm performance.
Garay, Gonzalez and Molina (2004) investigate the performance of the banking industry. They find that CEO reputation is positive depending on the number of CEO delegated as outside directorships that increase the default risk of the bank. Malmendier and Tate (2005) study CEOs who achieve
“
superstar" s個.tus 丘。m the business press. The firms of the superstars would decrease retum on assets in the subsequent three years because superstar-CEOs could promote their own compensation and the number of outside directorships, thereby spending excess time to participate in media related activities affecting firm operating performance. Milboum (2003) and Hamilton and Zeckhauser (2004) also find a CEO would promote his or her salary by CEO media coverage which influences firm performance. According to corporate goveman切, having a CEO's salary set too high would suggest weak corporate govemance. Core, Holthausen and Larcker (1999) further suggests when the s加cture of ∞rpor臨 govemance is inefficient and agency problem is serious, a CEO could receive higher compensation while the firm's operating performance and stock retum would have been lower.As for the impact of CEO media coverage on stock investors, Gaines-Ross (2000) suggests CEO image could influence the investors' thoughts about the firms, and the CEO's reputation could influence the financial analys恕,
recommendations about a firm. Many industry analysts would rate firms with high CEO reputation hold or buy. Barber and Odean (2008) show that the media has more impact on individual investors than institution investors. After comparing the different typ的 ofinvestors' behavio郎, they find that individual investors are unable to judge market signals and view
“
high-attention" stocks as“
high-quality" stocks. They would buy the stocks based on media reports, whereas institutional investors would have opposite trading. Bushee et al (2007) argue that the report ofChiao Da Management Review Vol. 29 No. 1, 2009 145
a finn from the media can assist the public in understanding the 位nn, which influences the degree of infonnation asymmetry between investors, making more individual investors trade th巳 finn's stocks. Tetlòck (2007) also documents that the media would influence investors' thoughts about stocks directly, The
pessimistic reports would induce the stock price to drop, and then the stock price would reverse
3.
Data and CEO Media Coverage Index3.1
Sample SelectionThis paper constructs a media database 丘。m January 1, 2001 through December 31, 2002. Our sample includes 1 ,402 日nn-years4• Becaus巳 a CEO media coverage database is not constructed in Taiwan, this paper constructs the database by referring to methodology from Hamilton and Zeckhauser (2004), Park and Bergerο004), Wang (1989), and Delahaye5 which is the famous media analysis company in the U.S. The reasons why we only select the years 2001 and 2002 as the study period are as follow. First, Hamilton and Zehauset (2004) document that many corporate scandals have been exposed to the public since 2001, which makes the media inspωt CEOs seriously and carefully. In addition, one of the famous magazines in Hong Kong, which began to circulate in Taiwan in 2001, and resulted in a deluge of reports on CEOs in the media industry in Taiwan. The change of media is an important concern so we select January 1, 2001 to December 31, 2002 for the media constructive period. Robinson and Levy (1996) and Gaines-Ross (2000) point out that newspapers provide the most powerful media coverage of CEOs and this has some impact on the public. This
4 Although this paper's media database period is only two years, it's longer th叩 prior litera恥res.
The media period of Eichholz (1999) 組d Wartick (1992) are one or less than one ye缸'. The number of sarnp1es is a1so more than prior papers. Fombrun and Shan1ey (\ 990) on1y se1ect 292 large firms and Harni1ton and Zeckhauser (2004) randomly select 200 firms from S&P 500 to compare
“
reputation CEO" and “non-repu祖tionCEO". In addition, the database of this paper is more comp1ete. For examp1e, Milbourn (2003) on1y gathers information from Down Jones New Retrieva1 Service, and Park and Berger (2004) only retrieve job titles from front pages and headlines.146 Do臼 CEO 蛤'diaCoverage Al知ctFirm Performance?
study also takes the complete media database of Taiwan into account; consequently, we choose the most popular newspapers in Taiwan, the UDN data,
as the source of our media database.6
The definition of CEO in this paper is the chairman of the board and general manager7. The CEO media coverage is the number of CEO appears in newspaper. We screen the reports and titles by se位ing the key word “CEO" and
“
name". For example, the report should contain“
chairman of board of TSMC" and“
Zhong-Mou, Chang" at the same time. If the content only reveals “Zhong-M凹, Chang", we drop this news. The main concern here is that there are many people having the same name in Taiwan so we set this restriction.According to Hamilton and Zeckhauser (2004), we divide news into three categories as positive, negative or neutral depending on the tone of the media report. A piece of news is c1assified a ιpositive' tone refers to a favorable report to the CEOs, and a 這egative'tone refers to a harmful report to the CEOs, whereas if we couldn't divide the reports into positive or negative, we refer these reports to as a
‘
neutral' tone.We also divide news into another three categories depending on the type of the media report: the first category is company-related involving discussing the firm's strategy, sales, margin, and earnings; the second category is CEO-related including the CE。這 lifestyle, habits and personality which is not related to the
6 UDN data includes Economic Daily News, United Daily News, United Evening Papers, Min
Sheng Daily and Stars News. We don't choose other newspapers to avoid the articles are doub1e-counted. In order 10 avoid subsamples in single newspaper systems only read by a piece of investors which may suffer selection bi帥, we choose one newspaper in di:fferent fields. For exarnple, The Economic Daily News belongs to the business 缸間, the United Daily News covers
general news, and the Min Sheng Daily covers entertainm目前, and so on. Also, different newspaper systems have their own standpoint. It might suffer some bias from only selecting UDN data. However, the standpoint of newspaper systems is from a political position, such 也atCEOs seldom have a clear political problem for operating smoothly 扭曲e impact of standpoint of newspaper syetem is Iimited.
7 甘lejob title in Taiwan's listed firms seldom has a CEO title, but uses the general manager. In most si個ations, the chairman of the board often holds the general manager position at the same time.Sometimes, the chairman of the board and general manager are not the same person. We think the importance of their impact on decision-making and influencing the market is equivalent For convenience, we call the chairman ofthe board and general manager as the CEO
Chiao Da Management Review Vol. 29 No. 1, 2009 147
Table 1
Definition ofVariables and Descriptive Statistics
前1e period of variable is 2001 個 2004, and the period of construction media database is Jan, 1,
2001 to Dec, 31, 2002. The definition ofROA is the percentage ofNet Income-Exc Dispo divided
with 前erage net asset, return on 品sets. Market is the abnormal retum by which 的ery firm is
estimated by market model. Fixgrowth is the firm's fixed asset gro附th ra阻 Media is the
percentage the CEO was mentioned in the newspapers relative 個 the number of reports for all
sarnple firm CEOs during the ye缸 t. Size is the firm's to個l 臨的 (inthousand dollars); BM is the
book 岫 marketratio. Debt is the totalliability to to個l 品sets.Age is the years from the IPO date to the period of construction media database (t). Wage is the CEO's compensation including the
sal呵. awar吐 money, transportation allowance (in tho田 and dollars). BSR is 血e ratio of ma陪m
buying to short selling. Institution is the ratio of the net buying of 也reebig inst血tional investors
(dea胎,trust and foreign investment) to the daily trading volume
2001 2002 sum ye叮 2001 2002 sum Media ROA Market Size BM Debt Age Wage BSR Institution
PanelA Summary by the Tone of Media Content
Positive Negative Neutral
3,043 674 3,265
3,349 552 2,878
6,392 1,226 6,143 (46.45%) (8.91%) (44.64%)
Panel B Summary by the Type of Media Content
Company-related CEO-re1ated others
3,998 2,696 288
4,052 2,526 201
8,050 5,222 489
(58.50%) 。7.95%) (3.55%)
Panel C Descriptive Statistics
Min Mean Median M缸
。
。.123 。 .029 11.528 戶 108.68 6.105 5.79 51.02 -30.17 1.45 0.49 116.61 205.14 19,498 5,536 2,650,078 0.155 1.158 。 938 24.93 。.035 40.45 39.665 845.33 10.153 7.083 42.8333 1.0986 5,664.01 3,624.00 13.0425。
4.247 0.72 82.8 -479.75 12.32 0.07 8925 Sum 6,982 6,779 13,761 sum 6,982 6,779 13,761 Std.Dev 。 4 8.035 5.96 71,704 1.104 16.489 10.041 11,705.17 9.611 216.38148 Does CEO Media Coverage Affect Firm Performance?
company; the third category is others which couldn 't be divided into the above two categones.
Panel A of Table 1 shows there are 13,761 reports in 2001 and 2002. As for the tone towards the CEO and company, positive news is 46.45% in total news, neutral news is 44.64% in total news and negative news is only 8.91 % in total news. Panel B of Table 1 shows the type of report: 58.5% of total news is company-related news and 37.95% oftotal news is CEO-related news.
3.2 The Construction of CEO Media Coverage Index
For the purposes of our analysis, we constructed a media coverage index for five popular newspapers in Taiwan. This index can reflect the level of media coverage of CEOs, which is defined as follows:
media,.
Media, = 一一一-,_.,- x 100%
I.
mediaj "j = 1,2...701 ra'‘、 l )
Equation (1) r晰的entsthe number oftimes finnj's CEO was mentioned in the newspapers relative to the number of reports for all sample fi口n CEOs during the year t. The larger the index 泊, the higher the degree of the CEO's media coverage.
In order to explore whether the media coverage of CEOs with a different tone has a different influence on the perfonnance of finns, we constructed another media coverage index, Mediak,t.,
media.,
Media,.. = 一一~xl00%
見,z media r (2)
Equation (2) represe臨 the number of times finn j's CEO was reported in the newspapers with tone k, i.e., positive, negative or neutral language relative to the total number of times finn j 's CEO was reported during the year t
3.3 Variables Selection
As for measuring the corporate perfonnance, the prior literatures often use two kinds ofperfonnance index: market index and accounting index. Dutta and
Chiao Da Management Review fól. 29 No. !, 2009 149
Reichelstein (2005) point out that choosing the stock price as a perfonnance indicator has a drawback; that 泊, stock price perfonnance must reflect all value-relevant factors even if some of those factors are not related to CEOs. Dutta and Reichelstein (2005) recommend both perfonnances should be used when comparing the finn perfo口nance. As a consequence, this paper uses these two index巳s to measure finn perfonnance. The accounting index we use is return on assets to measure the operating perfonnance. The market index we use is market-adjusted sωck returns (Barber and Lyon, 1997)8 to measure the finn's stock perfonnance.
We choose several finn characteristics as control variables including finn size, boot to market ratio, debt ratio, the age 仕om IPO and the CEO's
compens剖ion. Brennan and Hughes (1991) and Guay and Harford (2000) point out the degree of infonnation asymmetry in large finns is lower because the market is often concerned with large finns. Eichholz (1999) also finds the larger finns obviously are followed by the media because the impact of the decision
making 仕om larger finns is bigger. Smith and Watts (1992), Opler and Titman (1993) and Fenn and Liang (2001) use book to market ratio to measure the future investment opportunity. The higher book to market ratio means the 如何re
investment opportunity or the growth of the company is lower, and the underpricing situation is more serious. We are also concemed with the debt ratio because the debt ratio is correlated to financial distress, which might influence the company perfo口nanc巴. Adams, Almeida and Ferreira (2005) suggest that an old company might have a leaming e釘ectthat makes their perfonnance more stable. Core, Holthausen and Larcker (1999) point out when the structure of corporate management is less inefficient and has a serious agency problem, the CEO could receive a higher salary which has a negative impact on finn op釘在ting
perfonnance.
The finn characteristic variables are concurrent with company performance
8 We also use other market performances to measure the stock performance, for example, the
alpha from four factor model (Carh訓, 1997) and buy and hold retum (BHAR) (Blume and Stambaugh, 1983; Roll, 1983; Ball, Kothari, and Shank凹, 1995) to measure ye盯 market performance. The results between different retums are similar.
150 Does CEO Media Cover,α'ge Affect Firm Per:formance?
variables. The definitions are as' follows: we define the firm size (Size) measured as the log of assets. The book-to-market ratio (BM) is the ratio of the book value of equity to the market value of equity. The debt ratio (Debt) is total debt divided by total assets. The listed year (Age) calculated the year from company IPO date to the construction period. Regarding the CEO's salary (Wage) because Taiwan's data about the cash and stock bonus is not complete, this paper only discusses the CEO's cash compensation9 including sala旬, award money, and
transportation allowance.
In addition, we also include the market 甘ading proxy variables. Barber and Odean (2008) find that individual investors are more easily influenced by media than institution than institutional investors. Only the individual investors are allowed to participate in margin buying and short selling in Taiwan, so we take the ratio of margin buying to short selling (BSR) into out model. We also include the institutional investors' trading variable (Institution), to be the ratio of institutional investors' net buy to the total market 仕ading volume. AII 甘le
variables in this paper come from the Taiwan Economic Journal. To compare whether the individual and institutional investors are influenced by CEO media coverage, we take BSR and Institution into account. The higher BSR means margin buying is growing faster than short selling which implies the individual investors think the stock would go up. The higher Institution means the institutional investors think the stock would go up.
Panel C of Table 1 is the descriptive statistics for CEO media coverage, performance variables, firm characteristic variables and market trading variables. The mean and median of CEO media coverage are 0.123 and 0.029.10 The means of two performance, ROA and Market -adjusted stock reωrn (Re仙rn), are 6.11% and 1.45%. The mean of total assets is 凹,498 thousand dollars; the mean of BM
9 Liu,恥, and Liu (2005) rate the ∞mpensations of Taiwan's chairmen of the board of Iisted
firms in 2004: 由ecompensations only included sal呵,制訂dmoney, transportation allowance, as
for car, donn, and 80 on of which they think every finn has a different calculating b田e, so they
don't inc1ude it.
10 The mean and median of CEO media coverage 缸e0.123 and 0.029. This is a 1盯gedifference,
suggesting that outliers may influence empirica1 resu1ts. We de1ete firms with 血e highest 5% CEO media coverage to pe叮brma robus!ness test. The results don't have significant differences.
Chiao Da Man.α'gement Review Vol. 29 No. 1, 2009 151
is 1.158; the mean ofDebt is 40.45%; the Age is 10.153 ye訂son average; average Wage is 5
,
664.01 thousand dollars. In addition,
the average BSR and the Institution are 4.42 and 12.32%. Table 2 also shows the correlation coefficient is low b巳tween all the variables, so our regression model doesn't suffer 企om the problem of multi-collinearityll.4. CEO Media Coverage and Firm's Performance
4.1
The Factors Influencing CEO Media CoverageFirst, we analyze the factor of CEO media coverage. Because many CEOs aren't exposed to the media, in 473 of the full 1,402 observations, their CEO media coverage is O. This paper employs the Tobit model for analysis, and the results are reported in Table 3. The dependent variable is the CEO media coverage index, and the independent variables are ROA, Re削rn, Siz巴, BM, Debt, Age and dummy variable for group firrns
,
Group. If a firrn belongs to some group then Group is equal to one; otherwise, it is set at zero. We are also concerned with the impact from industry character, so we include the indus仕y dummy variable(Indus句)12.
We take Group into account because there are many firrns that are parts of group firrns, and their ownership and management cannot be separated. Their CEOs do not have restrictions on their tenure nor do they stand down for poor perforrnance. On the contrary, CEOs working for non-group firrns would be exposed to the media for their career concerns. Although the CEOs of group firrns don't have the motive to expose themselves to the media, their company size and
11 The corre1ation coefficient of BM and ROA is higher. We use the 由set growth rate to be the
proxy of inves虹nent opportunity (Farin恤, 2003), and the results don't have significant
differences
12 Vaughn (1980) points out when customers have high purchasing of a product with cost, high
social valuation and high risk, so they need more inforrnation and attention. The kind of industry is also referred to 由 ahigh involved industry; in other wor品, this is an industry in which the interest and the degree of attention are higher when customers are making a purchase decision (Mittal, 1989). 函,this paper concludes the customers or investors of high-involved industry are
more easily influenced by CEO media coverage. We thus include the high-involved industry. Schuler and Cording (2006) point out the industries of cars, elec甘ons and tinancials are high-involved industries, and we set dummy variables for these industries.
152 Does CEO Media Coverage 4加ctFirm Performance?
age are larger and longer, which can catch the media 's attention. So the motive and impact of CEOs' media coverage might have a difference between group and non-group firms.
Table 3 shows the coefficients of ROA and Return are 0.8l3 and -0.0001, both of which are significant. This represents that better operating and poor stock retum companies would attract the media. Empirical evidence shows 甘lat CEO in larger older and group firms might also more readily catch the media's attention. 4.2 CEO Media Coverage and Firm's Accounting Performance
In this section we analyze whether the CEO media coverage changes the public's cognition about a company and inf1uences the firm's fundamentals, which inf1uence a company's operating performance. We select ROA to measure the company operating perfo口nance,which is the accounting performance
Although the accounting performance could not ref1ect the change of the stock market immediately like the market performance , the accounting performance could ref1ect the CEOs' ability to manage firms. We use the ordinary least squ訂esmethod (OLS) to estimate the relation between CEO media coverage and firm accounting performance, with the results shown in Table 4.
The dependent variable of the first two columns in Table 4 is concurrent ROA. Column one shows that the larger company size, more investment opportunity, lower debt ratio, higher CEO compensation and non-group corporations hav巴 positive impact on ROA. Column two shows CEO m巴dia
coverage could positively and significantly inf1uence concurrent ROA. We also include the interaction term ofWagexMedia and GroupxMedia. The coefficient of Wage is 0.01, which has positive significant inf1uence on ROA, but the WagexMedia do巴sn't inf1uence ROA significantly. The coefficient of GroupxMedia is -0.197, which means the non-group firms could improve more concurrent ROA than the group firms. The dependent variables of column three and column four are ROA in the following year. The results show that CEO media coverage has no impact on the following ROA, but the non-group still could improve more ROA than the group firms, as the coefficient of Group is -0.114. The dependent variables of column five and column six are ROA in the
Table 2
的3心。-þ
Correlation Coefficient TablePanel A Pearson Correlation Matrix ROA
Market adjusted return 0.122***
Media 0.080*** -0.067** Size -0.07日 -0.080*** 。 278*** BM -0.384*** -0.132* 艸 悶。 .093 料* -0.062** EN F Debt -0.528材* 0.016 -0.011 0.288料* 。 193'** Age -0.288"* 0.044*** 0.096料* 0 .1 28料* 。 193"* 。 150*** MAD J 。見 Wage 0.159**' -0.083*艸 。 .111"* -0.021*** -0.105*** -0.073 -0.033*** 、 BSR 0.118'** 0.172*** 0.081* 料 0.022'** -0.193*** -0.048*" -0.111*'* 0.075** As E J Institution 0.048'" -0.028 0.010*** 0.011** -0.028 0.012*' -0.034*' -0:049 0.113 Panel B Spearman Correlation Matrix
ROA
Market adjusted return 0.162艸*
Media 0.130*'* -0.079*" Size -0.175" -0.066 。 465'" BM -0.638'*' -0.190艸* -0.243'" 0.074 Debt -0 .520艸* -0.010 0.067**' 0
.3
35'" 。 213'" Age -0.4
27'*' 0.039" 0.034*' 。.3 88' 料 。.447'" 0.187* 艸 Wage 。 174*** -0.086 。 176'" 0.198*' -0.192牌* -0.032'* -0.029 BSR 0.324*** 。 .214艸* 。.3 00艸* 。 219*** -0.552料* -0.134 -0.190*** 0.196料 Institution 0.128* 料 0.340料* 0.044艸* 0.080*** -0.169**' -0.019 0.050材 -0.021* 抖 0.158 艸* -uυs T154 Does CEO Media Coverage AifeCI Firm Performance?
Table 3
The Factors Influencing CEO Media Coverage
Dependent variable for Media index is Med肉 andthe definition is the percentage the CEO w晶
mentioned in 由enewspapers relative to the number of reports for aII sample finn CEOs during the year 1. Group is dummy variable; if finn is a group finn ,出enthe variable is equal to one, with others being equal to zero. Industry is industry dummy variable 0 The defmitions of 0出ervariables are the same in Tablel. The t value is presented in parentheses. *,料,血d 料* indicate simificantly different from zero at 10%, 5%, and 1 %.
Variable (1) (2) (3) Constant -0.715***
•
1.164**' 一1.255*** 4.264) (一1 1.470)•
12.047) ROA 0.485 0.813*** (1.340) (3.482) M缸keta甸回ted 間turn 0.0001 *'* 一0.0001***•
3.594) (-4.2 1 月 Size 0.082*** 。.117*** 。 112*** (4.868) (10.976) (10.596) BM 0.002 -0.002 0.001 (0.083)•
0.172) (0.083) Debt•
-0.0002 0.002 0.003'" 0.092) (1.628) (20810) Age 0.006* 0.006**' 0.007*** (1.956) (3.148) (3.818) Group 。 .076 0.064* 0.070* (1.220) (1.682) (1.867)lndus虹y Yes Yes Yes
Observations 1402 1402 1402
Log Iikelihood 1218.889 -612.4141 -605.6271
following two years. The results show that CEO media coverage has no impact on the ROA
,
and the non-group couldn't improve ROAComparing colunm one (three) in Table 3 and column two in Table 4,
concurrent year ROA positively and significantly inf1uence CEO media coverage. As the CEO media also has positive significant inf1uence on concurrent year ROA,
which might exist an interactive relation. We use Hausman (1978) to test endogenity and find the Lagrange Multipli巴r is 1.267
,
with the p-valu巳 of0.325Chiao Da Management Review Vol. 29 No. 1, 2009 155
Table 4
The Impact of CEO Media Coverage on Firm 's Accounting Performance
Dependent variable is ROA. The definitions of other variables are the same in Table 1. The t value is
presented in p肛entheses. *,料,叩d* 艸 indicatesignificantly different from zero at 10%, 5%, and
1%. t t+l t+2 Variable (1) (2) (3) (4) (5) (6) Constant 0.022 一 0.027 0.003 0.003 。 .096** 一0.090* (-0.565) (-0.708) (0.094) (0.077) (-2.074) (一1.931) Media 0.005 。 .225*** 0.009 0.091 0.031 *** 0.097 (-0.716) (3.706) (一1. 480) (1.359) (-4.063) (-0.864) Size 0.005* 0.004* 0.003* 0.003 0.018*** 。 .018*** (1.939) (1.656) (1.665) ( 1.534) (6.326) (6.426) BM -0.018*** -0.017*** -0.056*** -0.056*** -0.106 -0.107*** (-3.483) (-3.489) (一 10.778) (-10.768) (-7.022) (-6.973) Debt 一 0.002*** -0.002*** -0.001 *** -0.001 *** -0.002*** -0.002*** (-6.379) (一 6 .4 72) (-7.229) (-7.369) (一 10.761) (一 10.790) Wage 0.009*** 。.010*** 0.011 0.011 *** 0.009*** 0.008*** (3.786) (4.290) (5.130) (4.747) (3.351) (2.950) Group (一3.033)。 .016*** -0.007 -0.017*** 0.012** 一0.032*** -0.033*** (-1.139) (-3.579) (一2.322) (-5.116) (-5.061) Wage x Media 0.004 0.001 0.007 (-0.897) (0.224) (0.932) Group x Media 0.197*** -0.114*** 0.003 (-3.965) (一2.778) (0.039)
Industry Yes Yes Yes Yes Yes Yes
Observations 1402 1402 1402 1402 1402 1402
AdjR2
。
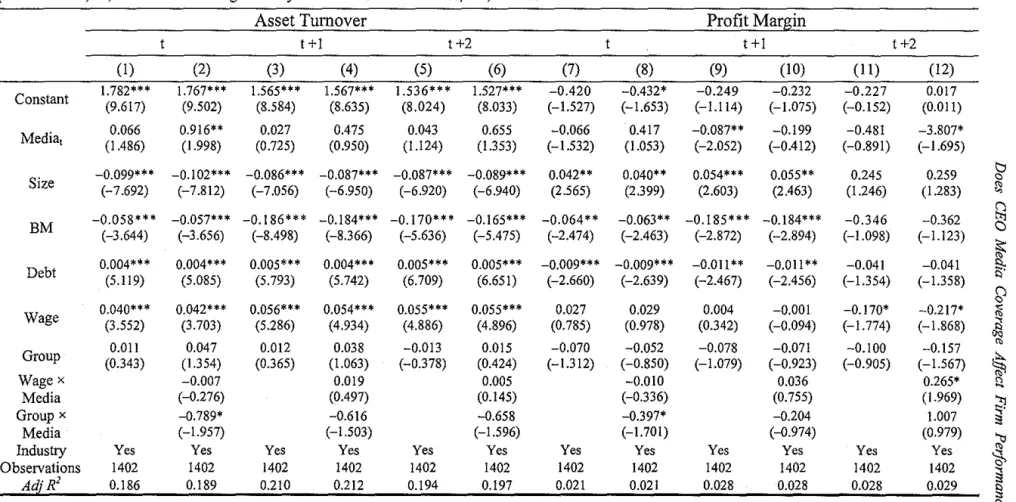
279 0.288 0.384 。 386 。 417 0.418In order to analyze the impact of CEO media coverage on ROA, we use the
concept of DuPont equation to decompose the ROA into asset tumover and profit margin. The former is to measure the management efficiency and the latter is to
measure the profitability.13 Table 5 shows the results. The Media coe宜icient is
0.916 in model (2)
,
which means CEO media coverage could positively andsignificantly influence concurrent ROA. This implies that CEO media coverage
13 The definition of ROA is the percentage of Net Income-Exc Dispo divided with average net
asset. We use the concept of DuPont equation to decompose ROA into sales divided average net
目
Table 5 tcJr、、
The Impact of CEO Media Coverage on Firm's Management Efficiency and Profitability
Dependent variables areAsset Turnover and Profit Margin. Tbe definitions of other variables are the sarne in Tablel and Table3. The t value is presented in parentheses. *,料,and 料* indicate significantly different 企omzero at 10%, 5%, and 1 %回
Asset Turnover Profit Margin
t +1 t+2 t +1 t +2 (1) (2) (3) (4) (5) (6) (7) (8) (9) (10) (11) (12) Constant 1. 782* 料(9.617) 1. 767* 牢牢(9.502) 1.5(8.584) 65*** 1.5 67 申牢牢(8.635) 1.(8.024) 536*** 1.5(8.033) 27*** -0.420 -0.432* 0.249 -0.232 -0.227 0.017 •1. 527) (-1.653) •1.1 14) (一1. 075) (-0.152) (0.011) Media
,
(1.40.066 86) 0.916** (1.998) (0.725) 0.027 (0.950) 0.475 (1.10.043 24) (1.3。 65553) (-1.-0.066 532) (1.0.4053) 17 -0.087** • 2.052) •-0.199 0.412) ←。 891)0.481 (一1.695)-3.807* Size -0.099**' -0.102"* -0.086'" 0.087'" -0.087'" -0.089*" 0.042 串串 0.040'* 0.054** 牢 0.055" 。.245 0.259。電句口、
• 7.692) 卜7.812) (一7.056) (自6.950) • 6.920) (-6.940) (2.565) 。.3 99) (2.603) (2.463) (1.246) (1.283) BM -0.058*** -0.057"* -0.186*** -0.184*** -0.170*" (-3.644) (可3.656) (-8.498) (-8.366) (-5.636) -0.165* 料(一5 .475) -0.064" (-2.474) -0.063** -0.185*** -0.184'" (一2 .463) (一2.872) 。 346 一 0.362。們悶
• 2.894) (-1.098) (一1.1 23)丸E足吋
.
Debt 0.0日 4***(5.119) 0.004'** (5.085) 0.005*'* (5.793) 0.004*** (5.742) 0.005 牢牢牢(6.709) 0.005*" (6.651) -0.009 串串串(一2.660) -0.009牢牢申(一2.639) 一0.011卜2.467)" -0.011 ** (一2.456) (一1.3 54)0.041 -0.041 •1.3 58)a
。電‘的宅z、
w、
Wage 0.040艸*(3.552) 0.042 牢牢牢(3.703) 0.056 串串串(5.286) 0.054'** (4.934) 0.055 牢牢牢(4.886) 。.055* 料(4.896) (0.785) 。 .027 (0.978) 0 日 29 (00.004 .342) -0.001 0.170' -0.217' • 0.094) •1. 774) •1. 868) 0.011 0.047 。 012 0.038 -0.013 0.015 。 .070 -0.052 0.078 -0.071 -0.100 -0.157 Group (0.343) (1.354) (0.365) (1.063) (“0 .378) (0.424) (>1.312) (-0.850) (-1.079) (-0.923) (-0.905) (一1.5 67)h
E
hk Wage x -0.007 0.019 0.005 -0.010 0.036 。 265' Media (-0.276) (0.497) (0.145) (-0.336) (0.755) (1.969)?
Group x -0.789' -0.616 -0.658 -0.397' -0.204 1.007 Media (-1.957) (-1.503) (一1.5 96) •1. 701) (-0.974) (0.979)Industry Yes Yes Yes Yes Yes Yes Yes Yes Yes Yes Yes Yes
Observations 14日 2 1402 1402 1402 1402 1402 1402 1402 1402 1402 1402 1402
凹的'0Da Management Reνiew Vol. 29 No. 1, 2009 157
could influence public cognition, which might increase the sales that could improve the management efficiency. CEO media would have a -3.807 impact on the following 訊ro years due to the decline in profitability. This means the ability to improve sales and control cost decreases.
Before including WagexMedia and GroupxMedia in Table 4 and Table 5, the impact of Media on corporate operating performance is insignificant because other variables have influence on different directions. After including the interaction terms of WagexMedia and GroupxMedia, we could observe the net effect of Media. The coefficient of Media on concurrent term is positi嗨, but negative in the following two year terms. The results mean that the CEO media coverage could improve the company reputation to attract more customers, so CEO media coverage could positively influence accounting performance in the short term. But the negative impact would appear especially on profitabi日勾r over the long period resulting from the CEO engaging to be exposed to media, which neglects the management efficiency and operating conditions ofthe company. 4.3 CEO Media Coverage and Firm's Market Performance
In order to analyze the relation between CEO media coverage and a firm's market retum, we use the OLS to estimate, and Table 6 documents the results. The dependent variable of columns one,也ree and five is the market performance in year t, t刊, and t+2, and the independent variable is CEO media coverage index. We find that the increase in CEO media coverage would lead stock retums to significantly decline in the concurrent and the next two years.
Comparing the column two (three) in Table 3 and column one (m吋 m
Table 6, the concurrent stock retum could negatively and significantly influence CEO media coverage, and the CEO media coverage also has negative significant influence on stock retums; there might be interactional influence. We use Hausman (1978) to test endogeni旬" and the result is not significant (P-value=0.452), so it doesn't produce bias estimator by using OLS.
Concurrent stock retum has negative significant influence on CEO media coverage because the CEO tries to be exposed to the media in order to change the public's impression or the media report more when a firm's stock p巴Tfo口nance IS
158 Does CEO Med.的 Coverage A.ffect Firm Performance?
poor. And that the CEO media coverage negatively and significantly inf1uences concurrent year retum might be associated with information asymmetry and stock price overreaction.
Table 6 shows that the CEO m巴diacoverage in year t would erode the stock retum m ye訂 t, t+ 1, and t+ 2. We discuss the reasons, and firstly we discuss them from the vantage of information. Merton (1987) and Easley and O'Hara(2004) point out the information risk would inf1uence the cross-sectional stock retum. Bushee et al (2007) 如此:hersuggests the company with high media coverage could improve the public's understanding for the firm that decreases the information asymmetry. Fang and Peress (2007) documents that a company with non-media coverage would perform better than a company with media coverage because media could decrease company information risk, which inf1uences the cost of capital. We think the company with low media coverage has high information asymmetry, so the investor who holds its stock should get higher risk premium to cover the problem of adverse selection. So, the relation between CEO media coverage and stock retums is negative.
From the investor trading behavior, Milboum (2003) points out the media coverage is the approach to represent the CEO's reputation. Urrutia and Vu (1999) and Klibanoff, Lamont and Wizman (1998) both find stock and fund's liquidity would significantly increase when they appear in media reports. Meschke (2004) reports that when a CEO accepts the media interview, the stock price would raise
1.65% and has higher volume; Tetlock (2007) points out the media's pessimistic report would make the stock price drop, then the price would reverse. Barber and Odean (2008) find individual investors are more easily inf1uenced by media than institutional investors. Individual investors would overreact in high media coverage stock and buy the stock at high price, which makes the stock retum decline. According to the above literatures, we include the BSRxMedia and InstitutionxMedia in column two, four and six in Table 6. After including the interaction terms, we find the impact of CEO media coverage on stock retum becomes insignificant due to the different behavior between individual and institutional investors. When BSR is higher, the stock retum is higher. After
Chiao Da Management Rev帥vv"l. 29 No. 1. 2009 159
Table 6
The Relation Between CEO Media Coverage and Firm's Market Performance
Dependent variable is market adjusted retum. The definitions of other variable are the same in
Tablel and Table3.The t value is presented in parentheses. 弋**, and 料* indicate significantly
different from zero at 10%, 5%,阻d1%
t t+l t+2 Variable (1) (2) (3) (4) (5) (6) Constant 0.814 -0.917 一0.786 。 691 1.471** 1.462** (-0.830) (-0.931) (一 0.731) (一0.645) (2.444) (2.421) Media 1. 028*** 一1. 463*** -0.535** 0.173 一0.330*** 0.296 (-4.066) (-3.106) (-2.160) (0.512) (一2.588) (一1.1 74) BSR 0.099*** 0.092*** 0.087*** 0.111*** 。 .049*** 0.053*** (5.031) (4.423) (5.327) (6.160) (6.152) (6.403) Institution 。 .018** 0.018*** 。 .019*** 0.019*** 0.009*** 。 .008*** (3.748) (3.508) (4.304) (4.151) (4.733) (3.974) BSR X Media 0.048 。 .089*** 0.011 * (1.004) (-3.098) (一1. 641) Institution x 一0.0005 0.0007 0.003 Media (-0.146) (0.238) (1.332) Size 。 421*** 0.437*** 0.061 。 .037 0.007 0.003 (4.148) (4.265) (0.610) (0.374) (0.128) (0.065) BM -0.645*** -0.646*** 0.991*** 1.009*** -1.782*** -1.767** (-5.511) (-5.518) (3.642) (3.723) (-8.451) (-8.383) Debt 0.025** 。 .025** 0.031 ** 0.032*** 0.006 -0.006 (2.485) (2.517) (3.203) (3.253) (一1.1 69) (一1.1 47) ROA 0.052** 0.052** 0.087*** 0.084*** 0.067*** 0.068*** (2.419) (2.447) (4.080) (3.975) (6.274) (6.360)
Industry Yes Yes Yes Yes Yes Yes
Observations 1402 1402 1402 1402 1402 1402
AdjR' 。 143 。 143 。 148 0.154 0.334 。 336
including the BSRxMed詞, we find that the higher is BSR an吐 CEO media
coverage, the more the stock retum would significantly decrease in the following
on巴 and two years, with the coefficients being -0.089 and 一0.01 l. We also observe higher Institution and CEO media coverage doesn 't significantly influence stock retums.
We find that CEO media coverage has lasting negative impact on market performance; the main reasons might be information asymmetry and the
investor's trading behavior. The results are summarized as follows: firs
t,
the firms160 Do臼 CEO Medl的 Coverage Affect Firm Pe份r抗nance?
stock retums are higher because of the inforrnation risk. Second, BSR could raise the stock retum, but high BSR and CEO media might decrease the stock retum. This means 也e individual investors might overreact to the company with high CEO media coverage, so the substantial decrease in BSR would make the stock retum drop significantly. Individual investors buying the stock with high CEO media coverage at high price couldn't eam positive retum.
5.
The Effects of Tone andTy
pe of Media Report on Firm's PerformanceIn addition to analyzing the impact of CEO media coverage on corporate perforrnance, this section analyzes whether the different tone and type of media report towards the CEO has impact on corporate perfo口nance
5.1 The Effects of Tone and
Ty
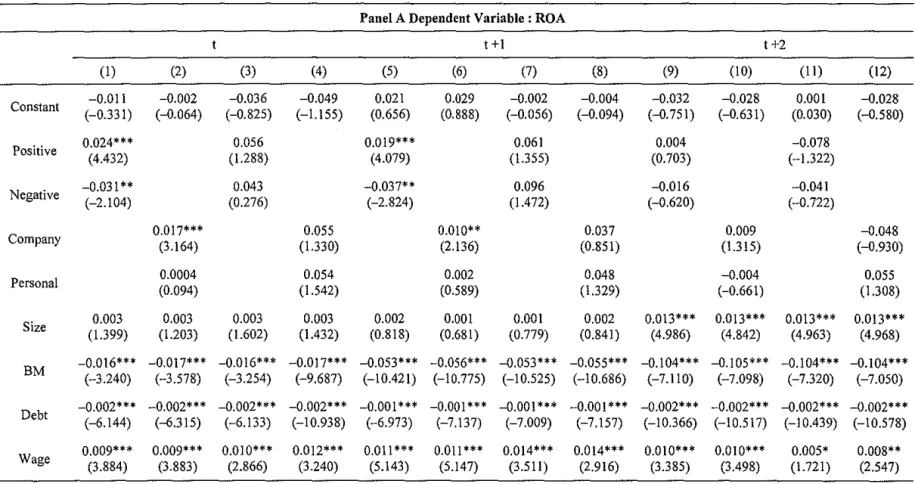
pe of Media Report on Firm's Accounting PerformanceWe analyze the impact of tone and type of media report on corporate accounting perforrnance, with the results shown in Table 7. Panel A of Table 7 shows that a CEO exposed in positive media reports would raise the concurrent and following year ROA; to the contrary, a CEO exposed in negative media reports would decline the ROA. As for the impact oftype ofmedia report on ROA, company-related would positively and significantly improve ROA, but the CEO-related has no effect on ROA. CEO in non-group firrns could improve ROA by exposing to positive and company-related media reports
We further decompose ROA, and Panel B of Table 7 shows that asset tumover would drop because the CEO is exposed in negative reports. If the CEO in group firrns is exposed in negative reports this would erode the company more easily, which drops asset tumover. A CEO in non-group firrns could improve a firrn's management e缸iciencyby exposing in company-related reports. Panel C of Table C reports the profitability would significantly improve because the CEO is exposed in positive news. The CEO in non>group firrns could improve a firrn's
Chiao Da Management Review Vol. 29 No. 1, 2009 161
5.2 The Effects of Tone and
Ty
pe of Media Report on Firm's Market PerformanceWe use OLS to estimate the impact of the tone of media report on market performance; the results are reported in Table 8. First, we analyze the impact of tone ofmedia report on firm's market performance. Table 8 shows that a positive report of the CEO has negative impact on the year t, year t+ 1, and year t+ 2 stock retum; the effect lasts two years. Negative reports of the CEO have negative impact on concurrent stock re個m, but ar巳 positive on the following year stock retum. This result is consistent with Urrutia and Vu (I999) and Tetlock (2007). In buying behavior, investors' reactions to positive reports are stronger than reactions to negative reports, so investors would buy the stock with more positive reports at higher price that raise the. stock price. This represents that investors would ov巳rprice the stock with positive CEO reports and underprice the stock with negative CEO reports, which induce the overreaction. Taking the interaction term about investor buying behavior and the tone of media report into account, the individual investors and institutional investor reverse in the next two years. The higher BSRxPositive would negatively influence the firm's market performance, and the higher InstitutionalxNegative would positively influence the firm's market performance.
In the following we discuss the effect of CEO company-related, and CEO-related media reports on firm's market performance. We find CEO company-related news would negatively and signi日cantly influence stock retur宜,
while CEO-related media coverage also negatively influences a firm's market retum, but insignificantly. After controlling investor behavior, we find higher BSRxCompany would negatively influence stock retum in the following two years.
6.
ConclusionsTraditional finance theories view people as rational agents. Being that only the CEO could change the public's cognition about the company- which changes the situation of corporate operating through media coverage- CEO media
162 Do臼 CEO Media Coverage Aifect Firm Pe份rmance?
coverage doesn't have effect on a firm's long-term stock returns. From another viewpoint, behavioral finance argues that the firm's stock return might reflect the change of the investors' valuation of a firm from a psychological factor. If CEO media coverage could change the public's cognition about a company, it also might have impact on investors' decision-making. Even though CEO media coverage couldn't change a corporation's operating situation, it does have impact on a firm's long period stock retums.
Our empirical evidence shows that having a CEO often exposed to the media would influence the public's cognition about the firm. The CEO's reputation could raise the firm's reputation thus bringing more customers, so the CEO's media coverage could positively influence concurrent year accounting performance. In the long run, however, the negative impact would appear in profitability because the CEO participates in media activity and neglects the operating situation, with the ability of controlling costs decreasing. We find the tone of the media has a large impact on accounting performance. The higher the CEO is exposed in positive media reports,也egreater the raise in profitability, and the ROA improves significantly. When the CEO has more negative media reports, however, this would decline the operating efficiency, and the ROA decreasing significantly will be different 企om the results of market performance. Even more interesting is when comparing with group finns: the CEO in non-group firms could raise more accounting performance by media coverage. As for the tone and type of media reports, the CEO in the non-group firm could improve a firm's accounting performance by positive or company-related media coverage.
The results of this paper also find firms with high CEO media coverage have lower retums than firms with low CEO media coverage. The results are summarized as follows: first, the lower the media coverage, the higher the CEO media coverage would improve the public's understanding of the firm which decreases information asymmetry. As such, the firms with low CEO media have higher information risk, and their stock retums are higher. Second, CEO media coverage could influence the stock market investors' cognition (the individual investors are influenced most) about the firm that intluences their investing behavior. The noise trader lacks information and professional knowledge, so they
Table 7
的話,函。.唔
Thelmpact ofTone and 1'ype ofMedia Reports on Firm 's AccountinE Performance
~
Dependent variables are ROA, Asset Tumover, and Profit Mar,且in.The definition ofPositive (Ne且,ative)is the percentage ofpositive (negative) reports to total reports
the definition of Company (Pe凹onal)is the percentage of company間related (pe時間-related) re戶口sto total reports in j ∞mpany. The definitions of other variables a Tablel and Table3. The t value is presented in parentheses. *,料,and 料*indicate significantly different from zero at 10%, 5%, and 1 %
Panel A Dependent Variable: ROA
t +1 t +2
~電
2
、
(1) (2) (3) (4) (5) (6) (7) (8) (9) (10) (11 ) (12) Constant -0.011 0.002 一0.036 -0.049 。.021 0.029 0.002 -0.004 -0.032 0.028 0.001 -0.028 芯片 (-0.331) (-0.064) (-0.825) (一1.1 55) (0.656) (0.888) (一0.056) (一0.094) (-0.751) (-0.631) (0.030) (-0.580) 趴~ Positive 0.024* 牢牢 0.056 0.019 牢牢牢 0.061 0.004 一0.078 宅。 (4.432) (1.2日 8) (4.079) (1.355) (0.703) (-1.322) 』 Negative 0.031 ** 0.043 -0.037** 0.096 -0.016 -0.041 趴EE E J•
2.104) (0.276) (-2.824) (1.472) (-0.620) (戶。 722) Company 0.017*** 0.055 0.010** 。 037 0.009 0.048 (3.164) (1.330) (2.136) (0.851) (1.315) (-0.930) Personal 0.0004 0.054 0.002 0.048 0.004 。.055 (0.094) (1.542) (0.589) (1.329)•
0.661) (1.308) Size (1.30.003 0.003 0.003 0.003 0.002 0.001 0.001 0.002 0.013*** 0.013*** 0.013* 料 。 013*** 99) (1.203) (1.602) (1.432) (0.818) (0.681) (0.779) (0.841) (4.986) (4.842) (4.963) (4.968) BM 一0.016*** -0.017牢牢牢 -0.016 串串串 戶0.017牢牢牢 -0 .053串串串 -0.056牢牢* -0.053* 牢牢 -0.055 申艸 -0.1 04* 牢牢 -0.105 串串串 戶0.104* 牢牢 -0.104 牢牢牢 (-3.240) (“3.578)•
3.254)•
9.687)•
10.421) (-10.775) (一 10.525) (一 10.686) (一7.1 10) (-7.098)•
7.320) (-7.050) Debt 一0.002*** -0.002*** -0.002 村串 -0.002** 車 -0.001 牢牢牢 -0.001 牢牢* -0.001 **串 戶{).001 牢牢牢 -0.002串串串 -0.002串牢牢 -0 .002牢牢牢 -0.002*** (-6.144) (-{j.315) (一6.133) (-10.938) (戶6.973) (-7.137)•
7.009)•
7.157) (一 10.366) (-10.517) (一 10 .439)•
10.578) Wage 0.009*** 0.009*** 0.010料* 0.012*** 0.011 牢牢牢 0.0 1l牢牢* 0.014 牢牢牢 0.014*** 0.010*** 0.010*** 0.005* 0.008** (3.884) (3.883) (2.866) (3.240) (5.143) (5.147) (3.511) ο.916) (3.385) (3.498) (1.721) (2.547) -cupa 、•
-0.0日 4 0.001 -0.015*** -0.016*** -0.013* -0.006 -0.031 串串串 -0 .031 串串串 -0.030 串串串 -0.024 串串串 c私r、 2.834) (-0.441) (0.143) (一3 .259) (一3.507) (-1.943)•
0.854) (-4.982) (-4.925) (-4.046) (-3.140) Wage x 0.002 -0.005 0.011 Positive (一0.443) (-0.913) (1.553) Wage x -0.008 0.017** -0.003 Negative (-0.406) (-2.326) (-0.427) Group x 心。.022** -0.004 -0.007 Positive (-1.960) (-0.461) (-0.576) Group x 0.016 0.005 0.062 Negative (-0.495) (0.185) (1.601) Wage x -0.002 -0.002 0.008 Company•
0.493) (一0.345) (1.256) b。f切
,
Wage x -1日 005 -0.005 0.006 Personal (一1.3 09) (-1.210) (一1.279) no
h Group -0.028** -0.020** 0.007k
§
xCompany (一2 .449) (一2.125)•
0.506) Group 。 015 -0.006 斗。 015o的
Q-e、E時、。
d b xPersonal (-1.392) (-0.785) (-1.128)Industry Yes Yes Yes Yes Yes Yes Yes Yes Yes Yes Yes Yes
Observations 1402 1402 1402 1402 1402 1402 14日 2 1402 1402 1402 1402 1402
可EF、
F
A 3
AdjR' 。 297 。 286 。 299 。 292 。 397 。 385 0.399 。 389 0.410 。 410 0.414 0.413
Constant Positive Negative Company Persona1 Size BM Debt Wage Group Wage x Positive Wage x Negative Group x Positive Group x Negative Wage x Company Z益丘
Pane1 B Ðepe心dentVariable : Asset Turnover
t+1 t+2 (1) (2) (3) (4) (5) (6) (7) (8) (9) (10) (11) (12) 1.597*** .1.643*** 1.555*** 1.716*** 1.46月~*** 1.513*** 1.478*** 1.563'** 1.411'** 1.455*** 1.184*** 1.185*** (9.043) (9.288) (6.423) (7.716) (8.468) (8.722) (7.456) (7.636) (7.785) (8.014) (4.843) (5.747) 0.027 月{).044 0.017 -0.148 0.024 0.362 (0.761) (-0.170) (0.458) (一0.674) (0.676) (1.398) -0.187抖 。 .802 -0.202峙 。目的 -0.200材 0.477 (一2.718) (1.328) (-2.943) (1.384) (-2.751) (1.024) 的 10 -0.074 -0.008 -0.220 0.007 0.198 (0.307) (-0.369) (一0.263) (-1.208) (0.229) (1.134) 0.012 -0.094 0.017 0.059 0.011 0.393** (0.455) (一 0 .5 52) (0.611) (0.337) (0.370) (2.213) 0.088*帥-0 .090* 艸 -0.086* 料-0 .087料*峙。 081 料* -0.083 料* -0 .079料* -0.079 料* -0.079* 料 -0.082* 料-0 .077* 料…0.078*** (一7 .3 85) (-7.465) (-M01) (一7.206) (-7.064) (-7.142) (-6.919 (-6.850) (-6.835) (-6.940) (-5.614) (一ó.703) -0.的少帥一0.058* 料一。目的 2*** -0.058*料-0.180*料臥 188*艸-0.176* 牌-0.184*材一0.161* 艸 0.170*艸 -0.156* 抖。 162**' (-3.214) (一3.623) (-4.717) (-3.593) (-8.264) (一8 .536 (-8.170 (-8.304) (-5.074) (-5.651) (-4.854) (-5.426) 。.004*** 0.004*** 0.0日 4'** 0.004**' 0.005**' 0.004*** 0.005*** 0.004*** 0.005*** 0.005*** 0.005*** 0.005*** (5.230) (5.035) (4.791) (5.160) (5.995) (5.790) (6.012) (5.811) (丘904) (6.694) (6.543) (6.836) 0.040'** 0.040*** 0.037* 0.017 0.056*** 0.056**' 0.047*** 0.034** 0.053'" 0.054'*' 0.071*" 0.070**' (3.500) (3.536) (1.847) (0.885) (5.27η(5.244) (3.061) (2.090) (4.773) (4.844) (3.743) (4.289) 0.012 0.010 0.059 0.096*' 0.013 0.011 0.052 0.096抖-0 .012 -0.013 0.047 0.096料 (0.366) (0.299) (1.309) (2.237) (0.393) (0.327) (1.240) (2.273) (-0.349) (-0.398). (1.009) (2.260) 0.015 0.025 …0.033 (0.493) (0.886) (一1.09η -0.093 -0.043 -0.047 (一 125~ (一1.1 64) (-0.867) -0.081 斗的-0 .107 (-1.143) (-0.823) •1.472) -0.338' -0.404** -0.432料 (一1. 689) (-2.338) (-2.054) 0.023 (0.935) 。 022 。 03~ (1.662) 。 002 一0.009 (-0.4 1 月 -0 .03 伊 (川 PEba-hsa§ 喜悅』兩 SEENDS LFM 唔唔 MM > BM
Personal Group xCompany
Group xPersonal
Industry Yes Yes Yes
Observatio 1402 1402 1402 ns Adj R2 0.189 。 185 0.194 (1.136) (0.097) (一1.7 09) -0.144** 一0.153** 一0.177** (一225~ (一2.272) (一2.536) -0.100 -D.079 -0.124 (一1.665) (一1.3 33) (一2.126) ~s fu fu ~s ~s ~s fu ~s ~s 1402 0.192 1402 0.214 1402 0.202 1402 0.218 1402 0.198 1402 0.203 1402 0.210 1402 0.217 1402 0.194
The Impact of Tone and Type of Media Reports on Market Performance
Dependent variable is market adjusted retum. The definition ofPositive (Negative) is the percentage ofpositive (negative) 自ports 臼 totalreports in j
company; the definition of Company (Personal) is the pe叩開tageof company-related (p前son-related) 間:ports 扭扭扭l 間portsinj company. The
definitions of other variable are the same in Tablel and Table3. The t value is presented in parentheses 弋料,叩d*** ind凹a阻 significant1y di邱b間 nt
trom zero at 10%, 5%, and 1 %.
t +1 t~ (1) (2) (3) (4) (5) (6) (7) (8) (9) (10) (11) (12) 0.136 -0.207 -0.165 -D.052 -D.099 -D.560 -D.062 -0.559 1. 790* 艸1. 566料* 1.665 艸* 1.3 85 艸 (-D.140) (-D.214) (-0.170) (-D.053) (-D.094) (-D.528) (-D.059) (-D.526) (3.020) (2.639) (2.805) (2.328) -D.007 -0.008* -0.0"*** -0.0"* 抖 -0.008* 料-D .005*料 (一1.623) (-1.771) (-3.12月 (-2.814) . (-4.257) (-2.719) -D.012 -D.叭叭 0.019艸 0.026艸 0.004 0.004 (-1.269) (一1. 801) (1.997) (2.449) (0.851) (0.641) -D.007* -0.00少* -0.007帥一0.007* -0.006*料 -0.003* (一1. 883) (-2.120) (一2.099) ←1. 830) ←3.195) (-1.659) -0.007料一0.008 料一0.005 -0.005 -0.004料一0.003 •1. 964) • 2.259) •1.5 89) (一1.5 13) (-2.347) •1. 534) 。 102*** 0.101*** 0.078** 0.048 0.087*** 0 日 88*** 0.107*** 0.093** 0.044*** 0.045*** 0.071*** 0.081*** (5.169) (5.094) 位 303) (1.348) (5.357) (5.360) (3.312) (2.553) (5.664) (5.656) 的 876) (6.485) 。 018*** 0.018*** 0.012* 0.020** 0.019*** 0.019*** 0.018*** 0.018*** 0.009*** 0.009*** 0.007** 0.008 (3.593) (3.643) (1.7 57)ο581) (4.250) (4.260) (2.830) (2.609) (4.859) (4.866)ρ549) (2.610) 0.0003 -0.0002 -D .006* 料 Constant Positive Negative Company Personal BSR Institution BSRx Table 8 HAMR NEERO 軍 KED司令 hKEhEMUnSEERV
Positive BSRx Negative Institution x Positive Institution X Negative BSRx Company BSRx Personal Institution X Company Institution × Personal Size BM Debt ROA K些盟主 Observati ons
4互
(0.682) 。.001 (1.343) 。 0001 (0.883) 0.0006 (1.523) ))51 8290 刊刊 900 戶已 3β4 炬計 444 位的仙 ra 、 rk 勻企 1.68E-05 (0.021) 。.0006 (1.267) 。因 0006 (1.357) 一2.08E-05 (-0.180) (…3.015) -0.0004 (一0.601) 1.69E-05 (0.381) 。 .0005* (1.814) 9.12E-05 (-0.206) 1.44E-05 (-0.041) -1.01E-05 (一0.088) -0.0007*** (一3 .3 84) -0.0002 (一1. 336) 2.49E-05 (0.566) 5.94E-05 3.33E-05 V o f .~ V V -7.82E-06 (0.485) (-0.287) 'V.._-,
(-0.152) 。.3 49*** 0.379*** 0.360*** 0.373*** 0.026 0.067 0.018 0.068 -0.003 0.023 -0.006 0.022 (3.470) (3.735) (3.572) (3.655) (0.262) (0 的 1) (0.178) (0.679) (-0.052) (0.451) (-0 .12月份 417) -0 .638* 料 -0.652* 帥一0.621 料* -0.655*** 0.879*** 0.967*** 0.883*** 0.970* 帥一1. 834*抖-1. 800* 料一1.787*** -1.764*** (一5 .3 13) (-5.541) (-5.150) (-5.552) (3.231) (3.549) (3.242) (3.547) (一8.740) (一-8.567) (一8.517) (-8.413) 。日 27*** 0.028*** 0.027*** 0.028*** 0.033*** 0.035*** 0.032*** 0.035*** -0.004 -0.0日 3 -0.004 -0.003 (2.654) (2.780) (2.645) (2.792) (3.335) (3.568) (3.253) (3.527) (-0.705) (-0.595) (-0.728) (-0.532) 。 .051** 0.052** 0.050** 0.052** 0.091*** 0.087*** 0.091*** 0.086*** 0.068*** 0.067*** 0.06θ*** 0.068*** (2.378) (2.408) (2.298) (2.399) (4.299) (4.080) (4.284) (4.046) (6.391) (6.292) (6.520) (6.367) ~s fu ~s ~s ~s fu ~s fu ~s ~s ~s ~s 1402 0.133 1402 0.136 1402 0.133 1402 0.136 1402 0.156 1402 0.149 1402 0.155 1402 0.147 1402 0.342 1402 0.339 1402 0.347 1402 0.346 的甘心。 bb 』 HEahnEShhnEES~NEh 。 FN 己也可 -AM 斗168 Does CEO Media Coverage A.t伶ctFirm Performance?
are easily influenced by CEO media coverage on decision making, which is according to a CEO's reputation. They would overprice the stock with high CEO media coverage and underprice the stock with low CEO media coverage, which induces the overreaction. In addition, we divide the content of CEO media coverage: CEO positive news has negative impact on the following two year stock
returr嗨, but negative news has a positive impact, which verifies the overreaction again. Investors would overprice the stock price when their CEO is often exposed in positive news and underprice the stock when their CEO is often exposed in negative news, which makes the CEO media coverage have negative impact on a firm's market performance.
Economics and Fortune both have articles arguing that people shouldn't make investment decisions by following a CEO's reputation. Instead, people should make decision according to fundamentals, and inspect the firm's financial performance and operating situation. The results of this paper also suggest that highly reputable CEOs with high media coverage are unable to raise a firm's
p巴rformance, but they do raise external costs to decrease a firm's performance with the negative impact lasting two years. The adoration of CEOs should come down.
7. References
Adams, R. 忌, Almeida, H. and Ferreira, D. (2005) ,“Powe的11 CEOs and Their Impact on Corporate Performance," Review 01 Financial Studies, 的(4),
1403-1432
Baker, M., Ruback, R. and Wurgler, J. (2006),“Behavioral Corporate Finance: A Survey", In Handbook 01 Corporate Finance: Empirical C.。中orate Finance, Espen Eckbo (ed.), Chapter 4, Amsterdam, Netherlands: North-Holland.
Ball, R., Kothari, S. and Shanken, J. (1995),“Problems in Measuring Portfolio Performance: An Application to Contrarian Investment Strategies," Journal 01 Financial Economics 38(1), 79c 107.