Infrared absorption of C 6 H 5 S O 2 detected with time-resolved Fourier-transform
spectroscopy
Li-Kang Chu and Yuan-Pern Lee
Citation: The Journal of Chemical Physics 126, 134311 (2007); doi: 10.1063/1.2713110
View online: http://dx.doi.org/10.1063/1.2713110
View Table of Contents: http://scitation.aip.org/content/aip/journal/jcp/126/13?ver=pdfcov Published by the AIP Publishing
Articles you may be interested in
Quenching of highly vibrationally excited pyrimidine by collisions with C O 2 J. Chem. Phys. 128, 054304 (2008); 10.1063/1.2825599
Infrared absorption of gaseous C H 3 O O detected with a step-scan Fourier-transform spectrometer J. Chem. Phys. 127, 234318 (2007); 10.1063/1.2807241
Infrared absorption of C H 3 S O 2 detected with time-resolved Fourier-transform spectroscopy J. Chem. Phys. 124, 244301 (2006); 10.1063/1.2211610
Tunneling chemical reactions in solid parahydrogen: Direct measurement of the rate constants of R + H 2 RH + H ( R = CD 3 , CD 2 H , CDH 2 , CH 3 ) at 5 K
J. Chem. Phys. 120, 3706 (2004); 10.1063/1.1642582
State-to-state rate constants for collision induced energy transfer of electronically excited NH 2 with NH 3 J. Chem. Phys. 117, 4878 (2002); 10.1063/1.1497965
Infrared absorption of C
6H
5SO
2detected with time-resolved
Fourier-transform spectroscopy
Li-Kang Chu and Yuan-Pern Leea兲
Department of Applied Chemistry, National Chiao Tung University, Hsinchu 30010, Taiwan; Institute of Molecular Science, National Chiao Tung University, Hsinchu 30010, Taiwan; and Institute of Atomic and Molecular Sciences, Academia Sinica, Taipei 10617, Taiwan
共Received 7 December 2006; accepted 7 February 2007; published online 5 April 2007兲
C6H5SO2 radicals were produced upon irradiation of three flowing mixtures: C6H5SO2Cl in N2, C6H5Cl and SO2 in CO2, and C6H5Br and SO2 in CO2, with a KrF excimer laser at 248 nm. A step-scan Fourier-transform spectrometer coupled with a multipass absorption cell was employed to record the time-resolved infrared共IR兲 absorption spectra of reaction intermediates. Two transient bands with origins at 1087.7 and 1278.2 cm−1 are assigned to the SO
2-symmetric and SO2-antisymmetric stretching modes, respectively, of C6H5SO2. Calculations with density-functional theory 共B3LYP/aug-cc-pVTZ and B3P86/aug-cc-pVTZ兲 predict the geometry and vibrational wave numbers of C6H5SO2and C6H5OSO. The vibrational wave numbers and IR intensities of C6H5SO2agree satisfactorily with the observed new features. Rotational contours of IR spectra of C6H5SO2simulated based on predicted molecular parameters agree satisfactorily with experimental results for both bands. The SO2-symmetric stretching band is dominated by a- and
c-type rotational structures and the SO2-antisymmetric stretching band is dominated by a b-type rotational structure. When C6H5SO2Cl was used as a precursor of C6H5SO2, C6H5SO2Cl was slowly reproduced at the expense of C6H5SO2, indicating that the reaction Cl+ C6H5SO2 takes place. When C6H5Br/ SO2/ CO2 was used as a precursor of C6H5SO2, features at 1186 and 1396 cm−1 ascribable to C6H5SO2Br were observed at a later period due to secondary reaction of C6H5SO2with Br. Corresponding kinetics based on temporal profiles of observed IR absorption are discussed. © 2007 American Institute of Physics.关DOI:10.1063/1.2713110兴
I. INTRODUCTION
The benzenesulfonyl radical共C6H5SO2兲 is an important intermediate in organic syntheses.1Although investigation of the reaction between C6H5and SO2is unreported, formation of C6H5SO2is expected to be rapid; hence C6H5SO2might also play an important role in the coupling of cycles involv-ing SOxand aromatic compounds in the atmosphere.
Previous investigations involving electron-paramag-netic-resonance共EPR兲 spectra of sulfonyl radicals produced in solutions containing arylsulphinic acid or sulphonyl ha-lides indicated that these radicals have a -type structure with the unpaired electron localized on the SO2moiety. The half-filled orbital lies approximately on a plane containing the benzene ring.2–5 Semiempirical calculations with inter-mediate neglect of differential overlap also support the character and in-plane radical structure of C6H5SO2.5 UV absorption of C6H5SO2in solution shows a broad band with an onset of ⬃500 nm and a maximum in the range of 315– 335 nm, depending on the solvent.6,7 Multiple-scattering X␣ calculations indicate that this band is associ-ated with excitation of the electron from oxygen to the half-filled molecular orbital that is effectively localized on the SO2 moiety.6 Some kinetic studies of C6H5SO2 in solution were conducted by probing its EPR spectrum8 or the UV
absorption band.7 No spectral or kinetic information of C6H5SO2in the gaseous phase has been reported. Hence it is desirable to develop a detection technique to investigate the spectra and reaction kinetics of C6H5SO2.
By coupling a step-scan Fourier-transform spectrometer 共FTS兲 with a multipass absorption cell, we have demon-strated that we can record time-resolved infrared共IR兲 absorp-tion spectra of gaseous reacabsorp-tion intermediates, such as ClCO,9ClSO,10 and CH3SO2,11and species in vibrationally excited states共HCl*and CH
4 *兲.12,13
Here we report an appli-cation of time-resolved共FTS兲 to record IR absorption spectra of the intermediate C6H5SO2 and its secondary reaction products C6H5SO2Cl and C6H5SO2Br.
II. EXPERIMENTS
In a commercial Fourier-transform spectrometer 共Thermo Nicolet, Nexus 870兲, the moving mirror is stepped, and holds its position at each step within ±0.2 nm.14 White cell with a base path length of 20 cm and an effective path length of 6.4 m was placed in the sample compartment of the spectrometer.10,11 The volume of the cell is ⬃2.0 L. The housing of the white cell accommodates two rectangular共3 ⫻12 cm2兲 quartz windows to pass photolysis beams that propagate perpendicular to multipassing IR beams. The pho-tolysis laser beam passes these quartz windows and is mul-tiply reflected between a pair of external laser mirrors. A KrF excimer laser共Lambda Physik, LPX120i, 11 Hz兲 emitting at a兲Author to whom correspondence should be addressed. Fax:
886-3-5713491; Electronic mail: [email protected]
0021-9606/2007/126共13兲/134311/9/$23.00 126, 134311-1 © 2007 American Institute of Physics
248 nm is slightly focused and employed for photodissocia-tion of C6H5SO2Cl in N2. Its typical output energy is ⬃85 mJ pulse−1, with a beam dimension of ⬃4⫻11 mm2. Another KrF excimer laser共Gam Laser, EX100H/60, 10 Hz兲 is slightly expanded and employed for photolysis of flowing mixtures of C6H5Cl/ SO2/ CO2 and C6H5Br/ SO2/ CO2. Its typical output is⬃50 mJ pulse−1, with a beam dimension of ⬃15⫻20 mm2.
Techniques to derive time-resolved difference absorption spectra from interferograms recorded with ac- and dc-coupled signals are well established.9,15 After preamplifica-tion, the ac-coupled signal from the MgCdTe detector 共20 MHz兲 was further amplified 共Stanford Research Sys-tems, Model SR560, using a bandwidth of 300 Hz– 1 MHz兲 20 times before sending to a 14 bit digitizer 共Gage Applied Technology, CompuScope 14100, 108samples s−1兲. The dc-coupled signal from the MCT detector was sent directly to the internal 16 bit digitizer共2⫻105samples s−1兲 of the spec-trometer. Typically, 800 data points were acquired at 0.2s integrated intervals 共20 dwells at 10 ns gate width兲 for a period of 160s after photolysis. The signal is typically av-eraged over 50 laser shots at each scan step. With appropriate optical filters to define a small spectral region, we performed undersampling to decrease the number of points in the inter-ferogram, hence the duration of data acquisition. For spectra in the range of 850– 1580 cm−1 at a resolution of 2.0 cm−1, 960 scan steps were completed within⬃80 min. To improve further the signal to noise ratio, we recorded and averaged seven sets of data under similar experimental conditions upon photolysis of C6H5SO2Cl. For photolysis of flowing mixtures of C6H5Br/ SO2/ CO2 and C6H5Cl/ SO2/ CO2, no average of similar spectra was performed.
We used flowing mixtures of three types: C6H5SO2Cl in N2, C6H5Cl and SO2in CO2, and C6H5Br and SO2in CO2. Experimental conditions for photolysis of C6H5SO2Cl are as follows: flow rates FC
6H5SO2Cl= 0.1 cm
3s−1 STP and F N2 = 23.6 cm3s−1 STP 共STP denotes standard temperature 273.15 K and pressure 1 atm兲, with a total pressure of ⬃72.0 Torr. In separate experiments, C6H5Cl and C6H5Br were photolyzed to yield C6H5, followed by reaction with SO2. The efficiencies of photolysis of C6H5Cl and C6H5Br are estimated to be⬃0.2% and 0.8%, respectively, based on their absorption cross sections at 248 nm共⬃1.0⫻10−19and 3.8⫻10−19cm2molecule−1 for C
6H5Cl and C6H5Br, respectively兲,16,17
the effective path length is ⬃34 cm, and the laser fluence is⬃2.0⫻1016photons cm−2. We found that vibrationally excited SO2was produced upon irradiation, and CO2 was employed as an efficient quencher to minimize in-terference due to excited SO2. For experiments with C6H5Cl/ SO2/ CO2, the flow rates were FC6H5Cl = 0.18 cm3s−1 STP, F
SO2= 1.13 cm3s−1 STP, and FCO2 = 13.7 cm3s−1 STP, and the total pressure was⬃25.1 Torr. For experiments with C6H5Br/ SO2/ CO2, the flow rates were
FC6H5Br= 0.09 cm3s−1 STP, FSO2= 1.1 cm3s−1 STP, and
FCO2= 13.8 STP cm3s−1, and the total pressure was ⬃24.1 Torr.
C6H5SO2Cl共⬎99%, Alfa Aesar兲, C6H5Cl, C6H5Br共both ⬎99%, Acros兲, SO2 共⬎99%, anhydrous, Matheson兲, and N2 共99.999%, AGA Specialty Gases兲 were used without further
purification. CO2 共99.99%, AGA Specialty Gases兲 was puri-fied on passage through a trap at 218 K. In experiments with C6H5SO2Cl, the temperature of the sample tube and the white cell was maintained at 353 K to increase the vapor pressure of C6H5SO2Cl and to avoid condensation.
III. THEORETICAL CALCULATIONS
The equilibrium geometry, vibrational wave numbers, and IR intensities of C6H5SO2 and C6H5OSO were calcu-lated with B3LYP and B3P86 density-functional theory using the GAUSSIAN 03 program.18 The B3LYP method uses Becke’s three-parameter hybrid exchange functional with a correlation functional of Lee, Yang, and Parr.19,20The B3P86 method uses Becke’s three-parameter hybrid exchange
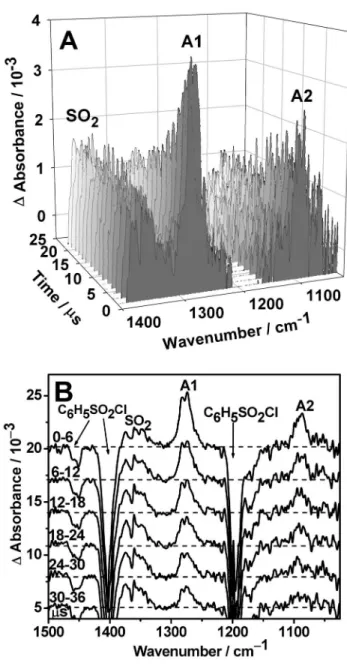
func-FIG. 1. 共A兲 Three-dimensional plot of time-resolved spectra upon laser photolysis 共248 nm, 11 Hz, 190 mJ cm−2兲 of a flowing mixture of
C6H5SO2Cl/ N2共1/240兲 at 72 Torr and 353 K. The path length is 6.4 m and
the resolution is 2.0 cm−1.共B兲 Spectra averaged at 6s intervals. The
up-ward features correspond to formation of SO2and C6H5SO2共indicated as
A1 and A2兲, whereas the downward features are due to destruction of the precursor of C6H5SO2Cl.
134311-2 L.-K. Chu and Y.-P. Lee J. Chem. Phys. 126, 134311共2007兲
tional with Perdew’s gradient-corrected correlation functional.21 Dunning’s correlation-consistent polarized-valence triple-zeta basis sets, augmented with s, p, d, and f functions共aug-cc-pVTZ兲,22,23and standard 6-311+ + G** ba-sis sets were applied in these calculations. Analytic first de-rivatives were utilized in geometry optimization, and har-monic vibrational wave numbers were calculated analytically at each stationary point. Comparison of rotational parameters of the ground and vibrationally excited 共vi= 1兲 states were performed with the B3P86/ 6-311+ G** method. Molecular parameters of C6H5SO2X共X=F, Cl, and Br兲 were predicted with B3P86/ 6-311G*.
IV. RESULTS AND DISCUSSION
As a test, conventional FTIR measurements were per-formed with a static cell containing 0.14 Torr of C6H5SO2Cl. The absorption of C6H5SO2Cl is characterized by intense bands near 1404, 1455, and 3078 cm−1.24
After laser irradia-tion at 248 nm 共10 Hz兲 for 120 s, absorption bands of SO2 共1151, 1362, and 2499 cm−1兲, HCl 共2886 cm−1兲, and C
6H5Cl 共3084 cm−1兲 as end products were observed. No absorption band detected in the static-cell experiment is ascribable to C6H5SO2.
A. Photolysis of C6H5SO2Cl in N2 and C6H5X „X=Cl or Br…/SO2 in CO2
Our previous experience indicated that upon irradiation a fraction of the precursor became highly internally excited and yielded new upward-pointing features on each side of the downward parent band in the difference absorption spec-trum. In this difference spectrum, features pointing upward indicate production, whereas those pointing downward
indi-cate destruction. In many cases these two side lobs interfere with nearby absorption bands of photodissociation products and hamper their detection. Hence we added excessive quenchers such as N2or CO2to thermalize the species in the system.
A representative three-dimensional 共3D兲 plot of tempo-rally and specttempo-rally resolved spectra at 1.5s intervals upon laser irradiation of a flowing mixture of ⬃72 Torr of C6H5SO2Cl/ N2 共⬵1/240兲 at 248 nm is shown in Fig.1共A兲 共resolution 2 cm−1兲. The spectral region 1150–1210 cm−1is not plotted because of the intense downward band of parent molecules C6H5SO2Cl. The spectra integrated over 6s in-tervals are shown in Fig.1共B兲. The downward features of the parent, at 1197, 1404, and 1455 cm−1, are due to loss upon irradiation. The SO2 absorption near 1362 cm−1 was ob-served to increase within ⬃3s and remained nearly con-stant afterwards. Two new features with maxima near 1278 and 1088 cm−1 共marked as A1 and A2, respectively兲 ap-peared immediately after irradiation, and decayed with time. These features have vibrational wave numbers similar to, but smaller than, those of the SO2-antisymmetric and SO2-symmetric stretching modes of C6H5SO2Cl at 1404 and 1197 cm−1 and of SO2 at 1362 and 1151 cm−1, respectively.25
The spectrum integrated over 5 – 57s upon photolysis of a flowing mixture of C6H5Br/ SO2/ CO2共1/12/150, total pressure⬃24.1 Torr兲 at 248 nm is shown in trace 共B兲 of Fig.
2. The absorption spectrum of the parents共C6H5Br and SO2兲
FIG. 2. Transient absorption spectra recorded upon 248 nm photolysis of three flowing mixtures:共A兲 C6H5SO2Cl/ N2共1/240兲 at 72 Torr and 353 K
共the resolution is 2 cm−1 and the averaging period is 0 − 7s兲; 共B兲
C6H5Br/ SO2/ CO2 共1/12/150兲 at 24.1 Torr and 298 K 共the resolution is
3 cm−1and the averaging period is 5 – 57s兲; and 共C兲 C
6H5Cl/ SO2/ CO2
共1/6.3/76兲 at 25.1 Torr and 298 K 共the resolution is 3 cm−1and the
aver-aging period is 5 – 57s兲. 共D兲 Stick spectra of C6H5SO2and共E兲 C6H5OSO,
both are based on unscaled harmonic vibrational wave numbers and IR intensities predicted with the B3P86/aug-cc-pVTZ method.
FIG. 3. Molecular structures predicted with B3P86/aug-cc-pVTZ and B3LYP/aug-cc-pVTZ methods for C6H5SO2 共A兲 and C6H5OSO 共B兲. The bond lengths are in angstrom and bond angles are in degree. Results from B3LYP are listed in parentheses.
is shown as downward gray lines for comparison. In this experiment, although both features near 1278 共A1兲 and 1088共A2兲 cm−1 are observed, the low-energy side of the feature near 1088 cm−1 is interfered with downward parent absorption band. The spectrum recorded over 0 – 7s after irradiation of C6H5SO2Cl/ N2is shown in trace共A兲 of Fig.2 for comparison.
The spectrum integrated over 5 – 57s upon photolysis of a flowing mixture of C6H5Cl/ SO2/ CO2 共1/6.3/76, total pressure⬃25.1 Torr兲 at 248 nm is shown in trace 共C兲 of Fig.
2. The absorption spectrum of the parents共C6H5Cl and SO2兲 is shown as downward gray lines for comparison. Because regions saturated with parent absorption overlap with that of the A2 band, only the A1 band at 1278 cm−1was observed. Among all three experiments, the quality of the spectrum recorded upon photolysis of C6H5SO2Cl is the best because absorption bands of the parent are less intense and well sepa-rated from those of the product, hence minimizing the inter-ference. This spectrum is used for comparison with spectral simulations to be discussed later.
B. Quantum-chemical calculations on C6H5SO2 and C6H5OSO
Reaction of C6H5 and SO2 might form C6H5SO2 and C6H5OSO. Geometries of C6H5SO2 and C6H5OSO calcu-lated with B3P86/aug-cc-pVTZ are shown in Figs.3共A兲and
3共B兲, respectively. Those calculated with B3LYP/aug-cc-pVTZ are listed parenthetically. For C6H5SO2, the C–S bond length of 1.794 Å predicted in this work is slightly smaller than the experimental value of 1.818 Å for CH3SH.26 The predicted SvO bond length of 1.467 Å is slightly greater than the experimental value of 1.432 Å for SO2 共Ref. 27兲 and the calculated value of 1.450 Å for ClSO2.28 For C6H5OSO, the optimized geometries derived with B3P86 and B3LYP/aug-cc-pVTZ methods are distinctly different, as indicated in Fig. 3共B兲. The two O atoms of C6H5OSO
pre-dicted with B3P86 are almost coplanar with the benzene ring, whereas the OSO and C6H5planes were predicted with B3LYP to have a dihedral angle of⬃133°. Except for this, the deviations in bond lengths and bond angles predicted with these two methods are small. For C6H5OSO.the SvO bond length of 1.478 Å predicted with the B3P86 method is similar to that of SO2, and the S–O bond length of 1.648 Å is similar to the predicted value of 1.638 Å for CH3OSO.11
Rotational parameters for equilibrium geometries of C6H5SO2 and C6H5OSO predicted with B3P86 and B3LYP methods using the aug-cc-pVTZ basis sets are listed in Table
Ifor comparison. The difference in geometries of C6H5SO2 predicted with B3LYP and B3P86 results in variations of rotational parameters less than 1.2%, whereas that of C6H5OSO is⬃12% due to greater deviations in geometry. Rotational parameters of C6H5SO2 vibrationally excited in the SO2-symmetric stretching and SO2-antisymmetric stretching modes, calculated with the B3P86/ 6-311 + + G** method, are also listed in TableI. They are useful for simu-lation of observed spectra.
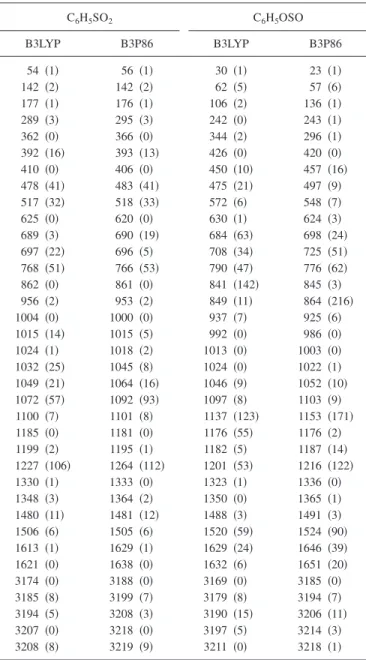
Unscaled harmonic vibrational wave numbers and IR in-tensities of C6H5SO2and C6H5OSO predicted with B3LYP and B3P86/aug-cc-pVTZ methods are compared in TableII. The two most intense bands of C6H5SO2 predicted with B3P86 共B3LYP兲 methods are at 1264 共1227兲 and 1092共1072兲 cm−1, corresponding to the SO
2-antiymmetric and SO2-symmetric stretching modes, respectively. The latter mode is mixed with some C–S stretching motion. Two me-dium intense bands predicted near 766 and 518 cm−1 are outside the range of our detection. Previous predictions of vibrational wave numbers for the SO2-antisymmetric and SO2-symmetric stretching modes of CH3SO2using the aug-cc-pVTZ basis sets deviate within 4.4% 共for B3LYP兲 and 1.4%共for B3P86兲 from experiments.11The four most intense bands of C6H5OSO predicted with B3P86共B3LYP兲 methods are at 864 共841兲, 1153 共1137兲, 1216 共1201兲, and
TABLE I. Comparison of energies and rotational parameters of C6H5SO2and C6H5OSO derived from B3LYP
and B3P86 calculations. C6H5SO2 C6H5OSO B3LYP B3P86 B3LYP B3P86 E + 780/ hartreea −0.300 697 −1.617 095 −0.321 605 −1.634 231 Equilibriuma A / cm−1 0.115 12 0.115 79 0.118 82 0.133 07 B / cm−1 0.033 29 0.033 69 0.029 29 0.028 34 C / cm−1 0.026 19 0.026 45 0.025 41 0.024 03 v = 0b A / cm−1 0.113 91 B / cm−1 0.033 37 C / cm−1 0.026 18 v = 1b SO2-sym. str. A / cm−1 B / cm−1 C / cm−1 0.113 74 0.033 36 0.026 17 v = 1b SO2-antisym. str. A / cm−1 B / cm−1 C / cm−1 0.113 68 0.033 36 0.026 17
aUsing basis sets aug-cc-pVTZ. bUsing basis sets 6 – 311+ G**.
134311-4 L.-K. Chu and Y.-P. Lee J. Chem. Phys. 126, 134311共2007兲
1524共1520兲 cm−1, corresponding to the mixed antisymmet-ric O–S and C–O stretching, SvO stretching, C–O stretch-ing, and C6H5 in-plane deformation modes, respectively. Two medium intense bands predicted near 776 and 725 cm−1 are outside the range of our detection.
The three rotational axes a, b, and c of C6H5SO2 are indicated as arrows with dashed lines in Fig.4. The c axis is nearly perpendicular to the plane containing the benzene ring. Predicted displacement vectors 共thin arrows兲 and the associated dipole derivatives 共thick arrows兲 for the SO2-antisymmetric and SO2-symmetric stretching modes of C6H5SO2 are also shown in Figs. 4共A兲 and 4共B兲, respec-tively.
C. Assignment of C6H5SO2
The major product on photolysis of C6H5SO2Cl is ex-pected to be C6H5SO2+ Cl, as was observed in EPR
experiments.8EPR experiments using selective spin traps in-dicate, however, that the other channel, C6H5+ SO2Cl, also occurs when C6H5SO2Cl is irradiated with a 500 W Hg lamp.29The major products for photolysis of C6H5X共XvCl or Br兲 are C6H5 and X.30,31 Further reaction of C6H5 with SO2might form C6H5SO2or C6H5OSO. Except for the ex-periment of C6H5Cl/ SO2/ CO2 in which parent absorption interfered strongly with the A2 band, bands A1共1278 cm−1兲 and A2共1088 cm−1兲 were observed in all experiments, indi-cating that they are due to a common product, likely C6H5SO2. These new features differ from the absorption band of SO at 1137.9 cm−1共Ref.32兲. Considering that these two new bands have wave numbers similar to, but slightly smaller than, those of SO2 at 1361.8 and 1151.4 cm−1,25
we expect that the carrier of these bands contains a SO2moiety. IR absorption spectra of C6H5SO2and C6H5OSO in the 1000– 1500 cm−1region predicted with B3P86/aug-cc-pVTZ are shown as stick diagrams in traces 共D兲 and 共E兲 of Fig.2, respectively. Unscaled harmonic vibrational wave numbers are used and predicted intensities are represented by the height of the sticks. Two most intense bands predicted at 1264 and 1092 cm−1 for C
6H5SO2fit satisfactorily with two observed new features, with errors of −1.1% and 0.4%, re-spectively. Typical errors for DFT calculations at this level are about 2%–3%. The separation of these two observed features共190 cm−1兲 is also consistent with the cal-culated separation of 172 cm−1 for SO2-symmetric and SO2-antisymmetric stretching modes. These agreements fur-ther support the assignments of these bands to C6H5SO2. The two most intense bands predicted for C6H5OSO in this spec-tral region are 1216 and 1153 cm−1, deviating from experi-mental observations by −4.9% and 6.0%, respectively.
As derivation of rotational parameters from observed spectra is unlikely to be practicable with the present spectral resolution, we simulate the band contour using the molecular parameters predicted with B3P86/ 6-311 + + G** to compare with the observed spectra. The direction of the dipole deriva-tive for the SO2-antisymmetric stretching mode of C6H5SO2 shown in Fig.4共A兲indicates that the associated rovibrational band is b type, whereas that for the SO2-symmetric stretch-ing mode 关Fig.4共B兲兴 is mainly a type, with a small
contri-bution of c type. The projections of the dipole derivatives for the SO2-antisymmetric stretching and SO2-symmetric stretching modes onto the a, b, and c axes are 0.0: 1.0: 0.0 and 0.8: 0.0: 0.2, respectively.
TABLE II. Comparison of harmonic vibrational wave numbers共cm−1,
un-scaled兲 and IR intensities 共km mol−1, listed parenthetically兲 of C
6H5SO2and
C6H5OSO derived from B3LYP and B3P86/aug-cc-pVTZ calculations.
C6H5SO2 C6H5OSO B3LYP B3P86 B3LYP B3P86 54 共1兲 56 共1兲 30 共1兲 23 共1兲 142 共2兲 142 共2兲 62 共5兲 57 共6兲 177 共1兲 176 共1兲 106 共2兲 136 共1兲 289 共3兲 295 共3兲 242 共0兲 243 共1兲 362 共0兲 366 共0兲 344 共2兲 296 共1兲 392 共16兲 393 共13兲 426 共0兲 420 共0兲 410 共0兲 406 共0兲 450 共10兲 457 共16兲 478 共41兲 483 共41兲 475 共21兲 497 共9兲 517 共32兲 518 共33兲 572 共6兲 548 共7兲 625 共0兲 620 共0兲 630 共1兲 624 共3兲 689 共3兲 690 共19兲 684 共63兲 698 共24兲 697 共22兲 696 共5兲 708 共34兲 725 共51兲 768 共51兲 766 共53兲 790 共47兲 776 共62兲 862 共0兲 861 共0兲 841 共142兲 845 共3兲 956 共2兲 953 共2兲 849 共11兲 864 共216兲 1004 共0兲 1000 共0兲 937 共7兲 925 共6兲 1015 共14兲 1015 共5兲 992 共0兲 986 共0兲 1024 共1兲 1018 共2兲 1013 共0兲 1003 共0兲 1032 共25兲 1045 共8兲 1024 共0兲 1022 共1兲 1049 共21兲 1064 共16兲 1046 共9兲 1052 共10兲 1072 共57兲 1092 共93兲 1097 共8兲 1103 共9兲 1100 共7兲 1101共8兲 1137共123兲 1153 共171兲 1185 共0兲 1181共0兲 1176共55兲 1176 共2兲 1199 共2兲 1195共1兲 1182共5兲 1187 共14兲 1227 共106兲 1264 共112兲 1201 共53兲 1216 共122兲 1330 共1兲 1333 共0兲 1323 共1兲 1336 共0兲 1348 共3兲 1364 共2兲 1350 共0兲 1365 共1兲 1480 共11兲 1481 共12兲 1488 共3兲 1491 共3兲 1506 共6兲 1505 共6兲 1520 共59兲 1524 共90兲 1613 共1兲 1629 共1兲 1629 共24兲 1646 共39兲 1621 共0兲 1638 共0兲 1632 共6兲 1651 共20兲 3174 共0兲 3188 共0兲 3169 共0兲 3185 共0兲 3185 共8兲 3199 共7兲 3179 共8兲 3194 共7兲 3194 共5兲 3208 共3兲 3190 共15兲 3206 共11兲 3207 共0兲 3218 共0兲 3197 共5兲 3214 共3兲 3208 共8兲 3219 共9兲 3211共0兲 3218 共1兲
FIG. 4. Displacement vectors共thin arrows兲 and direction of dipole deriva-tives 共thick arrow兲 predicted with the B3P86/aug-cc-pVTZ method for SO2-antisymmetric stretching共A兲 and SO2-symmetric stretching modes共B兲
of C6H5SO2. Rotational axes a, b, and c are also shown with dash axis lines.
The spectrum of the SO2-antisymmetric stretching band was simulated with theSPECVIEWprogram33using rotational parameters A, B, and C of both upper and lower states de-rived from B3P86/ 6-311 + + G** 共Table I兲, with J
max= 120,
T = 350 K, and a Doppler line shape with full width at half
maximum共FWHM兲=2.0 cm−1. Simulated a-, b-, and c-type spectra are shown in traces 共A兲-共C兲 of Fig. 5, respectively. The experimental observation shown in trace 共D兲 fits satis-factorily with the b-type band. This agreement in rotational contour further supports our assignment of this band to the SO2-antisymmetric stretching mode of C6H5SO2.
The spectrum of the SO2-symmetric stretching band was also simulated using rotational parameters A, B, and C of both upper and lower states derived from quantum-chemical calculations共TableI兲, with Jmax= 120, T = 350 K, and a Dop-pler line shape with FWHM= 2.0 cm−1. Simulated a-, b-, and
c-type spectra are shown in traces共A兲-共C兲 of Fig.6, respec-tively. A simulated spectrum of C6H5SO2using a ratio of 0.8: 0.2 for a-type and c-type components is shown in trace共D兲. Although the signal to noise ratio is worse than that of the SO2-antisymmetric stretching mode, our experimental obser-vation shown in trace共E兲 fits satisfactorily with the simula-tion in trace共D兲.
D. Assignment of C6H5SO2Br
The temporally resolved difference spectra of a 248 nm irradiated flowing mixture of C6H5Br/ SO2/ CO2 共1/4.4/118兲 at pressure 30.9 Torr, recorded at 50s inter-vals, are shown in Fig.7共A兲for the 1500– 1000 cm−1region. The features A1 and A2 have been assigned as the SO2− antisymmetric and symmetric stretching modes of C6H5SO2 in the previous section. As indicated in Fig.7共A兲, new bands B1 and B2 appeared following the decay of C6H5SO2. The contour of the B1 band at the low-energy side is interfered by the absorption of SO2. Because C6H5and Br are the main products upon irradiation of the flowing mixture
C6H5Br/ SO2/ CO2, C6H5SO2Br and 共C6H5兲2SO2 are the most likely products in the secondary reactions of C6H5SO2 with Br and C6H5, respectively.
The vibrational wave numbers of 共C6H5兲2SO2 in the 1100– 1500 cm−1 region showed four intense bands near 1105, 1155, 1311, and 1450 cm−1,24
which are distinctly dif-ferent from our observed bands near 1396 and 1186 cm−1. Infrared spectrum of C6H5SO2Br is unreported. The infrared absorption spectrum of C6H5SO2Br predicted with B3P86/ 6-311G* is shown as a stick diagram in Fig. 7共B兲. FIG. 5. Comparison of simulated and observed spectra of the
SO2-antisymmetric stretching mode of C6H5SO2. The fitted parameters are T = 350 K, Jmax= 120, 0= 1278.2 cm−1, A⬙= 0.113 91 cm−1, B⬙
= 0.033 37 cm−1, C⬙= 0.026 18 cm−1, A⬘= 0.113 68 cm−1, B⬘
= 0.033 36 cm−1, and C⬘= 0.026 17 cm−1.共A兲 a-type component, 共B兲 b-type
component,共C兲 c-type component, and 共D兲 spectrum recorded at a resolu-tion of 2 cm−1and integrated for 0 – 6s after 248 nm laser irradiation of a
flowing mixture of C6H5SO2Cl/ N2共1/240兲 at 353 K and 72 Torr.
FIG. 6. Comparison of simulated and observed spectra of the SO2-symmetric stretching mode of C6H5SO2. The fitted parameters
are T = 350 K, Jmax= 120, 0= 1087.7 cm−1, A⬙= 0.113 91 cm−1, B⬙
= 0.033 37 cm−1, C⬙= 0.026 18 cm−1, A⬘= 0.113 74 cm−1, B⬘
= 0.033 36 cm−1, and C⬘= 0.026 17 cm−1.共A兲 a-type component, 共B兲 b-type
component,共C兲 c-type component, 共D兲 simulated spectrum using a combi-nation of a and c types with a ratio of 0.8: 0.2, and共E兲 spectrum recorded at a resolution of 2 cm−1and integrated for 0 – 6s after 248 nm laser
irradia-tion of a flowing mixture of C6H5SO2Cl/ N2共1/240兲 at 353 K and 72 Torr.
FIG. 7. 共A兲 Temporally resolved spectra averaged at 50s intervals upon photolysis 共248 nm, 10 Hz, 17 mJ cm−2兲 of a flowing mixture of
C6H5Br/ SO2/ CO2共1/4.4/118兲 at 30.9 Torr. A1 and A2 bands are attributed
to C6H5SO2. B1 and B2 bands are assigned to C6H5SO2Br.共B兲 Stick spec-trum of C6H5SO2Br based on unscaled harmonic vibrational wave numbers
and IR intensities predicted with the B3P86/ 6-311G*method.
134311-6 L.-K. Chu and Y.-P. Lee J. Chem. Phys. 126, 134311共2007兲
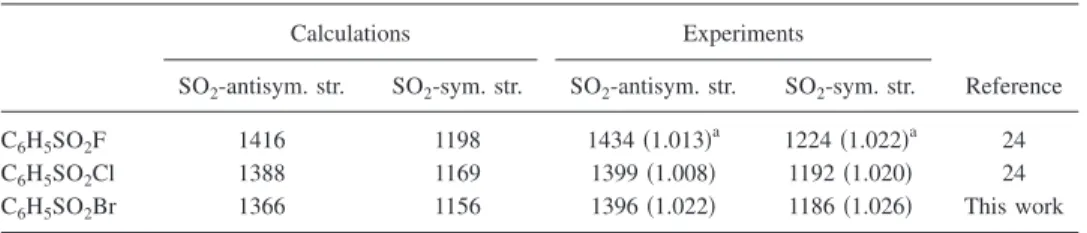
Unscaled harmonic vibrational wave numbers are used and the height of the stick represents the IR intensity in km mol−1. Observed features at 1396 and 1186 cm−1 in Fig. 7共A兲agree with predicted wave numbers of C6H5SO2Br sat-isfactorily. Vibrational wave numbers of SO2-symmetric and SO2-antisymmetric stretching modes of C6H5SO2F and C6H5SO2Cl have been reported.24TableIIIcompares experi-mental and calculated 共B3P86/6-311G*兲 wave numbers of these two vibrational modes of C6H5SO2X共XvF, Cl, and Br兲. The ratio of experimental to the calculated vibrational wave numbers of both the SO2-antisymmetric and SO2-symmetric stretching modes of C6H5SO2F and C6H5SO2Cl are in the range of 1.008–1.022. Corresponding ratios of 1.022 and 1.026 for the assignment of observed features at 1396 and 1186 cm−1 to C
6H5SO2Br agree satis-factorily with those of C6H5SO2F and C6H5SO2Cl. Hence, we assign the bands near 1396 and 1186 cm−1 to be the SO2-antisymmetric and SO2-symmetric stretching modes of C6H5SO2Br, respectively.
E. Further reaction of C6H5SO2
1. Photolysis of C6H5SO2Cl in N2
As can be seen in the 3D plot of Fig.1共A兲, intensities of these two new features 共A1 and A2兲 near 1278 and 1088 cm−1 decay with time. Integrated spectra in Fig. 1共B兲 show more clearly the temporal behavior of these features. Not as obviously shown as those two features, absorption intensity of C6H5SO2Cl gradually recovered with reaction time after the initial depletion, as indicated in the downward features in the first few time slices of Fig. 1共B兲. Temporal profiles of bands corresponding to C6H5SO2共integrated over 1255– 1295 cm−1兲, SO
2共1330–1380 cm−1兲, and C6H5SO2Cl 共1390–1420 cm−1兲 are shown in Fig.8.
A simple mechanism is proposed for photolysis of C6H5SO2Cl, C6H5SO2Cl + h→ C6H5SO2+ Cl, ⌬H = 300 kJ mol−1, 共1a兲 C6H5SO2Cl + h→ C6H5+ ClSO2, ⌬H = 453 kJ mol−1, 共1b兲 C6H5SO2Cl + h→ C6H5+ SO2+ Cl, ⌬H = 497 kJ mol−1, 共1c兲 C6H5SO2+ Cl→ C6H5SO2Cl, ⌬H = − 300 kJ mol−1, 共2兲 in which reaction共2兲represents the recombination of Cl and C6H5SO2. At 298 K, the enthalpy of formation of C6H5SO2Cl, C6H5SO2, C6H5, SO2, Cl, and ClSO2 are −334,34 −155,35 339,36 −297,37 121,37 and −220 kJ mol−1,28 respectively. The photon energy of 482 kJ mol−1 at 248 nm is greater than the enthalpy changes of reactions 共1a兲 and
共1b兲, but slightly smaller than that of reaction共1c兲.
The reaction of C6H5SO2 with C6H5 to form 共C6H5兲2SO2 might be unimportant,
C6H5SO2+ C6H5→ 共C6H5兲2SO2,
⌬H = − 298 kJ mol−1, 共3兲 because we did not observe features attributable to 共C6H5兲2SO2. The reaction of Cl with C6H5SO2 to form C6H5Cl and SO2,
C6H5SO2+ Cl→ C6H5Cl + SO2,
⌬H = − 204 kJ mol−1, 共4兲 is expected to be negligible because it is expected to have a large barrier.
We fit the decay profile of C6H5SO2with a single expo-nential function and derive a first-order rate coefficient k2I =共3.1±0.1兲⫻104s−1. The listed errors represent one stan-dard deviation in fitting. An exponential rise with a rate
co-TABLE III. Comparison of SO2-antisymmetric and SO2-symmetric stretching wave numbers 共cm−1兲 of
C6H5SO2X共X=F, Cl, and Br兲 derived from B3P86/6–311G*calculations and from experiments.
Calculations Experiments
Reference SO2-antisym. str. SO2-sym. str. SO2-antisym. str. SO2-sym. str.
C6H5SO2F 1416 1198 1434共1.013兲a 1224共1.022兲a 24
C6H5SO2Cl 1388 1169 1399共1.008兲 1192共1.020兲 24
C6H5SO2Br 1366 1156 1396共1.022兲 1186共1.026兲 This work
aRatios of experimental to calculated vibrational wave numbers are listed in parentheses.
FIG. 8. Temporal profiles of共A兲 C6H5SO2, integrated for 1255– 1295 cm−1,
共B兲 C6H5SO2Cl, integrated over 1390– 1420 cm−1, and共C兲 SO2, integrated
over 1330– 1380 cm−1, all bands were recorded upon photolysis of a flowing
mixture of C6H5SO2Cl/ N2共1/240兲 at 353 K and 72 Torr. The fitted results
are represented by solid lines, see text.
efficient of k2I= 3.1⫻104s−1was employed to fit the experi-mental temporal profile of C6H5SO2Cl. The fitting is satisfactory. We are unable to determine the concentration of the Cl atoms, hence precluding determination of an accurate bimolecular rate coefficient k2. A rough estimate of 关Cl兴=共1–5兲⫻1014molecules cm−3 yields k
2=共2–10兲 ⫻10−11cm3molecule−1s−1, consistent with the expectation of a radical-radical reaction.
The production of SO2follows first-order kinetics with a rate coefficient k5I=共5.0±0.6兲⫻105 s−1; the listed errors rep-resent one standard deviation in fitting. The rapid time con-stant derived from the temporal profile of SO2is unlikely to be attributed to the three-body dissociation channel关reaction
共1c兲兴 because this channel is energetically disfavored. It is likely that SO2 is generated from the secondary reaction of ClSO2and C6H5,
C6H5+ ClSO2→ C6H5Cl + SO2,
⌬H = − 362 kJ mol−1, 共5兲 which is expected to be rapid. The concentration of SO2 remains nearly constant at the later period. The presence of this rapid reaction is also consistent with the absence of ClSO2absorption in observed spectra.
2. Irradiation of C6H5Br/ SO2/ CO2
In the experiment with C6H5Br/ SO2/ CO2 共1/4.4/118兲 with a total pressure of ⬃30.9 Torr, the temporal profile of the SO2-antisymmetric stretching band of C6H5SO2 共inte-grated over 1260– 1296 cm−1兲 is shown in Fig. 9共A兲. Fitting the temporal profile of C6H5SO2 to a simple model with first-order rise共rate coefficient kIf兲 and decay 共rate coefficient
kdI兲 yields kIf=共1.2±0.3兲⫻105s−1 and k
d I
=共2.1±0.2兲 ⫻104s−1, respectively. The listed errors represent one stan-dard deviation in fitting.
The rise is associated with the reaction
C6H5+ SO2共+ M兲 → C6H5SO2共+ M兲, 共6兲 whereas the decay is expected to be associated mainly with the reaction
C6H5SO2+ Br共+ M兲 → C6H5SO2Br共+ M兲. 共7兲 Assuming that the reaction is in the high-pressure regime and 关SO2兴=3.5⫻1016molecule cm−3, and considering possible systematic errors, we estimate the bimolecular reaction coef-ficient k6=共3.4±1.2兲⫻10−12cm3molecule−1s−1. This rate coefficient of the reaction C6H5+ SO2was unreported. Com-pared with the bimolecular rate coefficient 共2.9±0.4兲 ⫻10−13cm3molecule−1s−1 for the reaction of CH
3+ SO2 共Refs.38and39兲 at 298 K, k6is greater by approximately an order. In contrast, k6is about one-half of the rate coefficient 8⫻10−12cm3molecule−1s−1 for the reactions of C6H5 with NO2 共Ref.40兲.
The temporal profile shown in Fig. 9共B兲 for the SO2-symmetric stretching band of C6H5SO2Br 共integrated over 1176– 1216 cm−1兲 was fitted with a single exponential rise to yield kI=共3.0±0.8兲⫻104s−1. This value is similar to the kd
I
=共2.1±0.2兲⫻104s−1 derived from the decay of C6H5SO2. This result supports that C6H5SO2Br is formed via the secondary reaction of C6H5SO2and Br关reaction共7兲兴.
V. CONCLUSION
We demonstrate an application of time-resolved Fourier-transform absorption technique to detect the SO2-symmetric and SO2-antisymmetric stretching bands of the transient spe-cies C6H5SO2upon photolysis of gaseous C6H5SO2Cl in N2 and mixtures of C6H5X 共XvCl or Br兲, and SO2 in CO2. Although a fully resolved rotational spectrum is unavailable, our spectrum conforms satisfactorily to a simulation based on rotational parameters derived from quantum-chemical calculations. Observed vibrational wave numbers 1087.7 and 1278.2 cm−1 and relative IR intensities are also consistent with those of the SO2-symmetric and SO2-antisymmetric stretching modes, respectively, of C6H5SO2 predicted with theoretical calculations. Absorption of C6H5SO2Br and C6H5SO2Cl was also observed at the later period after laser irradiation. C6H5SO2Br and C6H5SO2Cl were produced from secondary reactions of C6H5SO2 with Br and Cl, respec-tively. Absorption bands of C6H5SO2, SO2, C6H5SO2Br, and C6H5SO2Cl were probed to provide kinetic information. Rate coefficient of the reaction C6H5+ SO2 was determined for the first time.
ACKNOWLEDGMENTS
The authors thank the National Science Council of Tai-wan 共Grant No. NSC95-2119-M-009-032兲, the MOE-ATU Project of the National Chiao Tung University for support, and V. Stakhursky and T. A. Miller for providing the SPEC-VIEWsoftware for spectral simulation.
1S.-F. Wang, C.-P. Chuang, and W.-H. Lee, Tetrahedron 55, 6109共1999兲. 2M. McMillan and W. A. Waters, J. Chem Soc. B 1966, 422.
3A. G. Davies, B. P. Roberts, and B. R. Sanderson, J. Chem. Soc., Perkin
Trans. 2 1973, 626.
4M. Geoffroy and E. A. C. Lucken, J. Chem. Phys. 55, 2719共1971兲. 5C. Chatgilialoglu, B. C. Gilbert, and R. O. C. Norman, J. Chem. Soc.,
Perkin Trans. 2 1979, 770.
6C. Chatgilialoglu, D. Griller, and M. Guerra, J. Phys. Chem. 91, 3747
共1987兲.
7H. H. Thoi, O. Ito, M. Iino, and M. Matsuda, J. Phys. Chem. 82, 314
共1978兲. FIG. 9. Temporal profiles of共A兲 the A1 band of C6H5SO2, integrated over
1260– 1296 cm−1 and 共B兲 the B2 band of C
6H5SO2Br, integrated over
1176– 1216 cm−1, both bands were recorded upon 248 nm photolysis of a
flowing mixture of C6H5Br/ SO2/ CO2共1/4.4/118兲 at 30.9 Torr at 298 K.
The fitted results are represented by solid lines, see text.
134311-8 L.-K. Chu and Y.-P. Lee J. Chem. Phys. 126, 134311共2007兲
8J. E. Bennett, G. Brunton, B. C. Gilbert, and P. E. Whittall, J. Chem. Soc.,
Perkin Trans. 2 1988, 1359.
9S.-H. Chen, L.-K. Chu, Y.-J. Chen, I.-C. Chen, and Y.-P. Lee, Chem.
Phys. Lett. 333, 365共2001兲.
10L.-K. Chu, Y.-P. Lee, and E. Y. Jiang, J. Chem. Phys. 120, 3179共2004兲. 11L.-K. Chu and Y.-P. Lee, J. Chem. Phys. 124, 244301共2006兲. 12J. Eberhard, P.-S. Yeh, and Y.-P. Lee, J. Chem. Phys. 107, 6499共1997兲. 13Y.-J. Chen, L.-K. Chu, S.-R. Lin, and Y.-P. Lee, J. Chem. Phys. 115,
6513共2001兲.
14E. Y. Jiang, Spectroscopy共Eugene, Or.兲 17, 22 共2002兲.
15W. Uhmann, A. Becker, C. Taran, and F. Siebert, Appl. Spectrosc. 45,
390共1991兲.
16P. Grammaticakis, Bull. Soc. Chim. Fr. 16, 761共1949兲.
17M. Rasmusson, R. Lindh, N. Lascoux, A. N. Tarnovsky, M. Kadi, O.
Kühn, V. Sundström, and E. Åkesson, Chem. Phys. Lett. 367, 759 共2003兲.
18M. J. Frisch, G. W. Trucks, H. B. Schlegel et al.,
GAUSSIAN 03Revision A.7, Gaussian Inc., Pittsburgh, PA, 2003.
19A. D. Becke, J. Chem. Phys. 98, 5648共1993兲.
20C. Lee, W. Yang, and R. G. Parr, Phys. Rev. B 37, 785共1988兲. 21J. P. Perdew, Phys. Rev. B 33, 8822共1986兲.
22T. H. Dunning, Jr., J. Chem. Phys. 90, 1007共1989兲.
23D. E. Woon and T. H. Dunning, Jr., J. Chem. Phys. 98, 1358共1993兲. 24NIST/EPA Gas-Phase Infrared Database, NIST Standard Reference
Data-base 35, U. S. Department of Commerce, National Institute of Standards and Technology, Gaithersburg, MD, 2004.
25L. S. Rothman, C. P. Rinsland, A. Goldman et al., J. Quant. Spectrosc.
Radiat. Transf. 60, 665共1998兲.
26R. W. Kilb, J. Chem. Phys. 23, 1736共1955兲. 27M. H. Sirvetz, J. Chem. Phys. 19, 938共1951兲.
28M. Bahou, S.-F. Chen, and Y.-P. Lee, J. Phys. Chem. A 104, 3613共2000兲. 29I. I. Kandror, R. G. Gasanov, and R. Kh. Freidlina, Tetrahedron Lett. 14,
1075共1976兲.
30T. Ichimura, Y. Mori, H. Shinohara, and N. Nishi, Chem. Phys. 189, 117
共1994兲.
31H. Zhang, R.-S. Zhu, G.-J. Wang, K.-L. Han, G.-Z. He, and N.-Q. Lou, J.
Chem. Phys. 110, 2922共1999兲.
32C. Clerbaux and R. Colin, J. Mol. Spectrosc. 165, 334共1994兲. 33V. Stakhursky and T. A. Miller, 56th OSU International Symposium on
Molecular Spectroscopy, Columbus, Ohio, 2001 共unpublished兲; SPEC-VIEW: Simulation and Fitting of Rotational Structure of Electronic and Vibronic Bands, http://www.chemistry.ohio-state.edu/~vstakhur
34C. Chatgilialoglu, D. Griller, J. M. Kanabus-Kaminska, and F. P. Lossing,
J. Chem. Soc., Perkin Trans. 2 1994, 357.
35S. W. Benson, Chem. Rev.共Washington, D.C.兲 78, 23 共1978兲. 36W. Tsang, in Energetics of Organic Free Radicals edited by J. A. M.
Simoes, A. Greenberg, and J. F. Liebman共Academic, London, 1996兲, p. 22.
37M. W. Chase, Jr., J. Phys. Chem. Ref. Data Monogr. 9, 1共1998兲. 38F. C. James, J. A. Kerr, and J. P. Simons, J. Chem. Soc., Faraday Trans.
1 69, 2124共1973兲.
39A. J. Frank and F. Turecek, J. Phys. Chem. A 103, 5348共1999兲. 40M. Preidel and R. Zellner, Ber. Bunsenges. Phys. Chem. 93, 1417
共1989兲.