國立交通大學
電子物理系所
碩士論文
利用飛秒光譜檢測具應變釔錳氧薄膜內
錳離子d-d能隙與尼爾溫度之研究
Mn
3+d-d Energy Difference and Néel Temperature
in Strained YMnO
3Thin Films
Probed by Femtosecond Spectroscopy
研究生 :陳耀宗
指導教授:吳光雄 教授
中華民國九十九年六月
誌謝 誌謝 誌謝 誌謝 兩年多的研究生生涯伴隨論文定稿劃下休止符,這段期間承蒙吳光雄教授不辭辛勞 地給予我許多研究上的建議,以及帶領我解決許多實驗上遇到的問題,在此致上由衷的 感謝。另外要感謝固態研究群的莊振益教授、林俊源教授、溫增明教授、羅志偉教授以 及台大物理系傅昭銘教授對本論文仔細地審核並提供寶貴的建議,讓本論文更臻於完 善。感謝加州大學電機系劉佳明教授除了給予我在共軛焦顯微鏡架設的指導外,研究與 經驗上的分享也使我有很深刻的學習。 研究期間,特別感謝伍道樑總教官、李佐文教官、簡泰淇教官、李昭麟教官、李耀 威教官、楊恭賜教官、鄧惠成教官、陳天生教官、鄒立宇教官、馬毓君教官與劉美華教 官對於我的愛護及生活上的照顧。感謝陳裕仁學長、石訓全學長、林宗漢學長、朱培源 學長與陳龍羿學長在實驗上提供寶貴的建議與協助,另外感謝黃彥智同學於同步輻射量 測的協助、林俊宇同學協助薄膜成長、吳東引學長、周書楷學長與曾俊斌學弟於光學量 測上的協助。感謝實驗室的夥伴們陳學儒同學,王雅卿同學、即將念博士的廖佑廣同學 以及人數非常眾多的碩一與剛進入實驗室的學弟妹無論是實驗的協助或是營造實驗室 歡樂的氣氛,都讓生活變得更豐富。 最後,要感謝我的家人以及汪佳慧對我的支持與關懷,讓我能夠順利完成學業,在 此將這份成就及喜悅獻給我最摯愛的家人。 陳耀宗 於新竹交通大學 西元 2010 年 6 月
利用飛秒光譜檢測具應變釔錳氧薄膜內
利用飛秒光譜檢測具應變釔錳氧薄膜內
利用飛秒光譜檢測具應變釔錳氧薄膜內
利用飛秒光譜檢測具應變釔錳氧薄膜內
錳離子
錳離子
錳離子
錳離子d-d能隙與尼爾溫度之研究
能隙與尼爾溫度之研究
能隙與尼爾溫度之研究
能隙與尼爾溫度之研究
研究生 : 陳耀宗 指導教授 : 吳光雄 教授
國立交通大學 電子物理系所
摘
摘
摘
摘 要
要
要
要
此論文中,我們利用脈衝雷射鍍膜系統分別於 MgO(100),
MgO(111)與 YSZ(111)三種基板上成功地製備沿 c 軸(001)成長的釔
錳氧化物薄膜。並以 X 光繞射儀、四環繞射儀等量測晶格不匹配
所對應樣品的晶格結構以及其應變效應。進一步,我們藉由可變
波長之飛秒雷射激發-探測系統(OPOP)研究這些磊晶應變效應對
釔錳氧化物錳離子之間 d 軌域躍遷能隙(E
dd)以及尼爾溫度(T
N)的影
響。
Mn
3+d-d Energy Difference and Néel Temperature
in Strained YMnO
3Thin Films
Probed by Femtosecond Spectroscopy
Student: Yao-Tsung Chen Adviser: Kaung-Hsiung Wu
Abstract
In this thesis, we prepared pure (001)-oriented h-YMnO
3thin
films on (100)MgO, (111)MgO and (111)YSZ substrates by pulsed
laser deposition(PLD), respectively. And we get the crystal structure
and strain effect of these thin films by X-ray diffraction and phi-scan.
In further, we will show the results of the ultrafast dynamics in these
samples probed by the tunable wavelength optical pump-optical probe
technique. Especially, the influence of epitaxial strain due to lattice
mismatch between the substrate and h-YMO films on the magnitude
of E
ddand Néel temperature (T
N).
Contents
Abstract (in Chinese) i
Abstract (in English) ii
Contents iii
List of Figures v
List of Tables ix
List of Equations ix
Chapter 1 Introduction 1-1 What’s the multiferroics 1
1-2 Hexagonal phase of RMnO3 3
1-3 Motivation 6
Chapter 2 Sample preparation and basic properties measurement 2-1 The preparation of h-YMnO3 films 2 - 1 - 1 A n a l y si s o f la t t i c e mi s ma t c h 8
2-1-2 Pulse laser deposition (PLD) 9
2-2 The measurement of the physical properties 2-2-1 X-ray diffraction 10
2-2-2 Φ-scan 14
2 - 2 -3 S Q UI D 1 6 Chapter 3 Optical pump-optical probe (OPOP) 3 - 1 O PO P b a c kg ro u n d 2 2 3 - 2 S y s t e m o f O P O P 2 4 3-3 Cooling system 26
3-4 Time delay zero point positioning 27
Chapter 4 Experimental Result and Discussion
4-1 Epitaxial-strain effect on Mn3+ d-d energy difference 30
4-1-1 Pump-Probe results (Fix wavelength) 31
4-1-2 Pump-Probe results (Tunable wavelength) 42
4-1-3 ∆R/R Signal analysis 53
4-2 Epitaxial-strain effect on Néel temperature shift 61
Chapter 5 Summary and future work 5-1 Summary 69
5-2 Future work 70
List of figures
Fig.1-1 Relationship between multiferroic and magnetoelectric materials [2]. Fig.1-2 h-YMO ferroelectric (FE) phase and paraelectric (PE) structure [10].
Fig.1-3 (a) Side view of h-YMnO3 structure, (b) Top view of h-YMnO3 structure along
c-axis.
Fig.2-1 h-YMnO3 thin film thickness (Pulse number: 9KP).
Fig.2-2 these schematics show the in-plane arrangements between the h-YMnO3 thin
films (red line) and substrates (black line). Left hand side shows h-YMnO3/MgO
(111); Right hand side shows h-YMnO3/YSZ(111).
Fig.2-3 The illustration of pulsed laser vacuum deposition system.
Fig.2-4 XRD patterns of (a) h-YMnO3/MgO(100), (b) h-YMnO3 single crystal, (c)
h-YMnO3/MgO(111) and (d) h-YMnO3/YSZ(111) samples.
Fig.2-5 XRD patterns of the different thickness of h-YMnO3/YSZ(111).
Fig.2-6 shows the relationship of c-axis lattice constant and pulse number. Fig.2-7 show Φ-scan result of h-YMO/MgO(100) [13].
Fig.2-8 show Φ-scan result of h-YMO/MgO(111). Fig.2-9 show Φ scan result of h-YMO/YSZ(111).
Fig.2-10 The growth situation of h-YMO/MgO(100). The structure of YMnO3 is
hexagonal, MgO(100) substrate is square.
Fig.2-11 show magnetization vs temperature (M-T) curves and the reciprocal
magnetization vs temperature (1/M-T) for h-YMO/MgO(100) with FC and ZFC parallel to the film surface.
Fig.2-12 show susceptibility vs temperature (χ-T) curves and the inset is reciprocal susceptibility vs temperature (1/χ-T) for h-YMO single crystal l [14]. Fig.2-13 show magnetization vs temperature (M-T) curves and the reciprocal
magnetization vs temperature (1/M-T) for h-YMO/MgO(111) with FC and ZFC parallel to the film surface.
Fig.2-14 show magnetization vs temperature (M-T) curves and the reciprocal
magnetization vs temperature (1/M-T) for h-YMO/YSZ(111) with FC and ZFC parallel to the film surface.
Fig. 3-1 The setup of pump-probe spectroscopy. AOM: acousto-optic modulator. P: polarizer. CCD: CCD camera. PD: photodiode. M: multimeter. RF: RF driver. F: function generator. D: delay controller. The solid and dashed lines
represent the laser beam path and the dotted lines stand for the electrical signal connection [15].
Fig. 4-1 The transient reflectivity ∆R/R curves of h-YMnO3/MgO(100) samples
measured at various temperatures (Part of Fig.4-1 data).
Fig.4-3 The transient reflectivity ∆R/R curves of h-YMnO3 single crystal samples
measured at various temperatures.
Fig.4-4 The transient reflectivity ∆R/R curves of h-YMnO3 single crystal samples
measured at various temperatures (Part of Fig.4-3 data).
Fig.4-5 The transient reflectivity ∆R/R curves of h-YMnO3/MgO(111) samples measured
at various temperatures.
Fig.4-6 The transient reflectivity ∆R/R curves of h-YMnO3/MgO(111) samples measured
at various temperatures (Part of Fig.4-5 data).
Fig.4-7 The transient reflectivity ∆R/R curves of h-YMnO3/YSZ(111) samples measured
at various temperatures.
Fig.4-8 The transient reflectivity ∆R/R curves of h-YMnO3/YSZ(111) samples measured
at various temperatures (Part of Fig.4-7 data).
Fig.4-9 (a) The amplitude of ∆R/R as a function of temperature at 800nm taken from
Fig.4-8 at zero delay time. (b) Energy difference of the Mn3+ energy levels in
the local environment MnO5 for photon energy above and below Edd. (c)
Orbital-resolved densities of states of Mn 3d orbitals and the in-plane O 2p
orbital for YMnO3 [15].
Fig.4-10 it illustrates the splitting of the Mn3+ energy levels in the local environment
MnO5.
Fig.4-11 Three primary features of dynamics in the ∆R/R curves.
Fig.4-12 The transient reflectivity ∆R/R curves of h-YMnO3/YSZ(111) samples measured
with the same pump and probe beam wavelength(815nm) at various temperatures.
Fig.4-13 The transient reflectivity ∆R/R curves of h-YMnO3/YSZ(111) samples measured
with the same pump and probe beam wavelength(800nm) at various temperatures.
Fig.4-14 The transient reflectivity ∆R/R curves of h-YMnO3/YSZ(111) samples measured
with the same pump and probe beam wavelength(785nm) at various temperatures.
Fig.4-15 The transient reflectivity ∆R/R curves of h-YMnO3/YSZ(111) samples measured
with the same pump and probe beam wavelength(777nm) at various temperatures.
Fig.4-16 The transient reflectivity ∆R/R curves of h-YMnO3/YSZ(111) samples measured
with the same pump and probe beam wavelength(770nm) at various temperatures.
Fig.4-17 The transient reflectivity ∆R/R curves of h-YMnO3/YSZ(111) samples measured
with the same pump and probe beam wavelength(755nm) at various temperatures.
Fig. 4-18 Normalized amplitude of ∆R/R as a function of temperature of
h-YMnO3/YSZ(111) at various wavelengths (λ) at zero delay time.
Fig. 4-19 Normalized amplitude of ∆R/R as a function of temperature of h-YMnO3 single
crystal at various wavelengths (λ) at zero delay time.
Fig.4-20 The energy gap Edd as a function of temperature T(K). Edd is estimated from the
different wavelengths (755,770,785,800,815nm). The black line is the TN (Néel
temperature) for the YMnO3 single crystal to be a standard sample.
Fig.4-21 Optical conductivity spectra of hexagonal HoMnO3, DyMnO3, TbMnO3, and
GdMnO3 thin films. For clarity, the spectra have been plotted with offsets of
1250 Ω−1 cm−1 vertically between each curve, and the base line for each curve is
shown by the horizontal dashed line. The arrows in the TbMnO3 spectrum
indicate the three peak positions where optical absorption occurs. The vertical
dotted line indicates the first optical transition peak position of YMnO3 [15].
Fig.4-22 Schematic representation of the crystal field splitting changes due to flattening
of the MnO5 triangular bipyramid. The flattening occurs due to the increase of
the rare earth ionic radius with the fixed c-axis lattice constant. As the
flattening occurs, due to the orbital symmetries, the d3z2−r2 orbital will shift to
higher energy, whereas the dxy and dx2−y2 orbitals stay the same [15].
Fig.4-23 the lattice constant ratio (ac, filled symbols) and the in-plane lattice constant (a,
empty symbols) of bulk hexagonal RMnO3 <circles, R=Lu, Yb, Tm, Er, Y, and
Ho [24]>, and film hexagonal RMnO3 (squares, R=Dy, Tb, and Gd).
Fig.4-24 shows the fitting of h-YMnO3. There are fast, slow1, slow2 and oscillation
components. When T<TSO, we added a slow 2 component for magnetization.
Fig.4-25 Amplitude of slow 2 component as various temperatures.
Fig.4-26 Strain pulse model (Interference between surface and strain layer). Fig.4-27 Coherent acoustic phonon mode measured at 140 K in (a) and at various
temperatures in (b).
Fig.4-28 The amplitude (Ao) of coherent acoustic phonon mode at various temperatures.
Fig.4-29 The period of coherent acoustic phonon mode at various temperatures
Fig.4-30 The energy gap Edd as a function of T (K) for h-YMnO3/MgO(100).
Fig.4-31 The slope (dEdd/dT) as a function of T (K) for h-YMnO3/MgO(100).
Fig.4-32 The energy gap Edd as a function of T (K) for h-YMnO3/Single Crystal.
Fig.4-33 The slope (dEdd/dT) as a function of T (K) for h-YMnO3/ Single Crystal.
Fig.4-34 The energy gap Edd as a function of T (K) for h-YMnO3/Single Crystal.
Fig.4-35 The slope (dEdd/dT) as a function of T (K) for h-YMnO3/MgO(111).
Fig.4-36 The energy gap Edd as a function of T (K) for h-YMnO3/YSZ(111).
Fig.4-37 The slope (dEdd/dT) as a function of T (K) for h-YMnO3/YSZ(111).
function of the normalized temperature TNn (=T/TN). Temperature values of
56, 70, 60, 75, and 90 K were used as TN and the energy values of 1.9725, 1.77,
1.785, 1.7711, and 1.7249 eV were used as the peak energy values at TN for
R=Gd, Tb, Dy, Ho, and Lu, respectively. (b) Absolute value of normalized peak position differentiated to normalized temperature [25].
Fig.4-39 Temperature dependence of the peak energy (Blue circle) of the 1.7 eV feature and its spectral weight (Red square) [26]
List of tables
Table 2-1 The substrate temperature and oxygen pressure.
Table 2-2 The lattice mismatch between substrate and h-YMnO3 thin film.
Table 2-3 c-axis lattice constants, a/c ratio and ratio of out-of-plane.
Table 2-4 c-axis lattice constant of different thickness of h-YMnO3/YSZ(111) thin films.
Table 4-1 The parameter of a/c ratio, c-axis lattice constant (Å), T(K, ∆R/R=0) at 1.55eV,
and Edd at 200K of h-YMO/MgO(100), h-YMO/single crystal,
h-YMO/MgO(111) and h-YMO/YSZ(111), respectively.
Table4-2 The parameter of T (K), ∆R/R=0 at 1.55eV and 1.58eV of h-YMO/MgO(100),
h-YMO/single crystal, h-YMO/MgO(111) and h-YMO/YSZ(111), respectively.
List of equations
Eq. 2-1 Bragg’s law
Eq. 2-2 (hkl) planes the lattice constants for hexagonal structure
Eq. 3-1, Io(t) is DC voltage signal that it stand for the intensity of reflectivity. And ∆I(t) is
stand for the change (∆R) of reflectivity.
Chapter 1 Introduction
1-1 What’s the multiferroic?
Multiferroics have been defined as materials that exhibit more than one primary ferroic order parameter simultaneously (i.e. in a single phase) [1]. And ferroics as two or more states exist and can be shifted by field [2].
The four basic primary ferroic order parameters are ferromagnetism, ferroelectricity, ferroelasticity and ferrotoroidicity, the latter still being under debate.
Fig.1-1 Relationship between multiferroic and magnetoelectric materials [2].
Ferromagnets (ferroelectrics) form a subset of magnetically (electrically) polarizable materials such as paramagnets and antiferromagnets (paraelectrics and antiferroelectrics). The intersection (red hatching) represents materials that are multiferroic. Magnetoelectric coupling (blue hatching) is an independent phenomenon that can, but need not, arise in any of the materials that are both magnetically and electrically polarizable. In practice, it is likely to arise in all such materials, either directly or via strain.
or deformation. In a multiferroic crystal with both electric and magnetic order, interdependence between the two orders may exist: An applied electric field induces a linear change of magnetization and an applied magnetic field induces a linear change of polarization. This kind of coupling is called a magnetoelectric (ME) effect and was predicted 1894 and observed first in 1960[3]. The microscopic origins of the ME effect is twofold:
(1) The magnetic ordering is driven by (super)exchange interactions whose strength depends sensitively on the overlap of magnetic orbitals, that is, on bond lengths and bond angles.
(2) These structural parameters may be changed in an applied electric field, because the metal cations and the ligand anions move in opposite directions.
1-2 Hexagonal Phase of RMnO3
A major series that show ferroelectricity along with magnetic ordering consist of materials of the general formula RMnO3 (R = Y, Lu, Ho, Er, Tm, Sc,
Yb etc.). Base on the structural point, magnetic ordering occurs in both hexagonal (space group P63cm) and orthorhombic (space group Pnma)
manganites, whereas ferroelectric ordering occurs only in hexagonal phase which is noncentrosymmetric. Hexagonal RMnO3 compounds have
antiferromagnetic ordering with the Néel temperature TN < 70-130 K, and
ferroelectric ordering at much higher temperature TE < 600-900K [4-6].
The hexagonal YMnO3 exhibit the ferroelectric transition at high
temperature, TC~ 910K [7] and become A-type antiferromagnetic below the Neél
temperature in single crystalline, TN ~70K [8,9]. Above 910K, the paraelectric
(PE) phase has the hexagonal structure with P63/mmc space group symmetry,
and the ferroelectric (FE) phase has the hexagonal structure in P63cm symmetry.
Fig.1-2 h-YMO ferroelectric (FE) phase and paraelectric (PE) structure [10].
These MnO5 blocks are connected two dimensionally through their corners and
the triangular lattice of Mn3+ ions with S=2 are formed. There are two magnetic transition temperature (TN=70K and TSR=40K). The first temperature, Mn
3+
ions interact antiferromagnetically below TN=70K and lead to geometrical frustration
(GF) in the system [10]. The second temperature is due to Mn3+ ions spin reorientation (SR).
Moreover, the ferroelectric polarization is caused by MnO5 blocks tilt and
Fig.1-3 (a) Side view of h-YMnO3 structure, (b) Top view of h-YMnO3 structure along c-axis.
(a)
1-3 Motivation
The hexagonal multiferroic manganites have attracted much scientific attention in recent years because they exhibit a wide variety of exotic physical properties, include the origins of ferroelectric ordering and magnetic frustration, the significant coupling between the magnetic and electric order parameters (magnetoelectric ME effect), and the anomalous dielectric constant and blueshift of the absorption peak (~ 1.7 eV) in the optical spectra near the Néel temperature (TN).
Recently ultrafast optical pump-optical probe (OPOP) spectroscopy provides a powerful tool to investigate the strongly correlated electron materials since the relative contributions of electron, phonon and spin dynamics in these materials can be directly resolved temporally. We have studied the ultrafast dynamics in h-HoMnO3 single crystal by the OPOP technique previously [11].
The temperature dependences of on-site Mn d-d transition energy Edd(T), the
anomalous blueshift near TN and how they related to the magnetic ordering and
the magnetization dynamics have been revealed and discussed in the experiment. An open question that is of current interest is whether the above properties
(and thus the ME effect) can be changed/controlled by introducing the strain into the system [12].
In this work, we prepared pure (001)-oriented h-YMnO3 thin films on
respectively. We will show the results of the ultrafast dynamics in these samples probed by the OPOP technique, especially. The influence of strain due to lattice mismatch between the substrate and h-YMnO3 films on the magnitude of Edd.
We found that Edd change slightly due to the small change of the ratio of lattice
Chapter 2 Sample preparation and basic properties measurement
2-1 The preparation of YMnO
3films
h-YMnO3 thin films were successfully grown on MgO (100), MgO (111),
and Y-stabilized ZrO2,YSZ (111) substrates by pulse laser deposition (PLD).
Using a KrF excimer laser (wavelength 248 nm and pulse duration about 30 ns) operating at a repetition rate of 5 Hz, pulse number 9K and with an energy density around 3-5 J.cm−2. The substrate temperature and oxygen pressure are show in Table 2-1.
MgO(100) MgO(111) YSZ(111)
Temperature (℃) 860 860 880
Oxygen pressure (Torr) 0.003 0.3 0.1
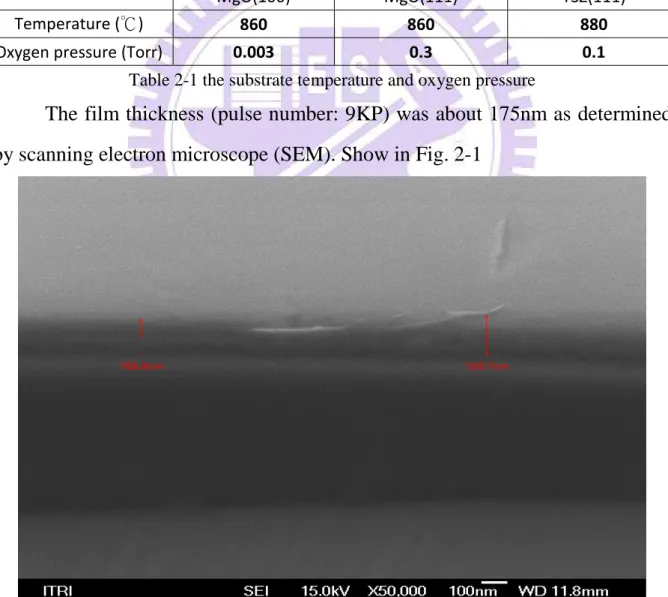
Table 2-1 the substrate temperature and oxygen pressure
The film thickness (pulse number: 9KP) was about 175nm as determined by scanning electron microscope (SEM). Show in Fig. 2-1
2-1-1 Analysis of lattice mismatch
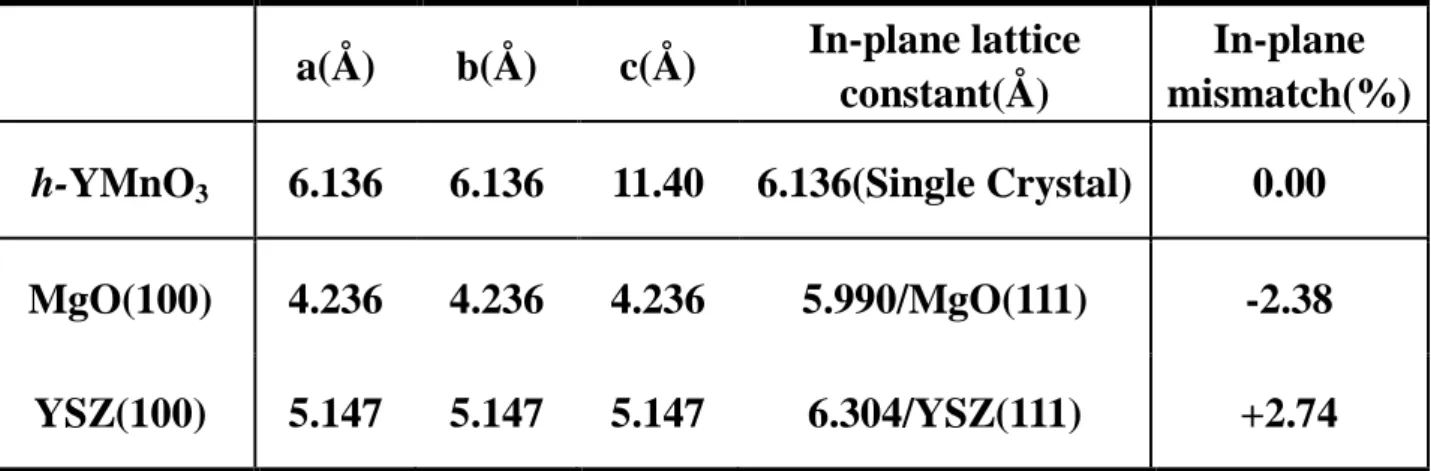
a(Å) b(Å) c(Å) In-plane lattice constant(Å)
In-plane mismatch(%)
h-YMnO3 6.136 6.136 11.40 6.136(Single Crystal) 0.00
MgO(100) 4.236 4.236 4.236 5.990/MgO(111) -2.38 YSZ(100) 5.147 5.147 5.147 6.304/YSZ(111) +2.74
Table 2-2 the lattice mismatch between substrate and h-YMnO3 thin film.
According to the above comparison, MgO(100), MgO(111) and YSZ(111) substrates have the least mismatch, these substrates are suitable to deposit
h-YMnO3 thin films. We predict MgO(111) will get rise to compressive strain
with the mismatch value (-2.38%) while YSZ(111) will have the tensile strain with mismatch value (+2.74%).
Fig. 2-2 These schematics show the in-plane arrangements between the h-YMnO3 thin films (red line) and substrates (black line). Left hand side shows h-YMnO3/MgO (111); Right hand side shows h-YMnO3/YSZ(111).
h-YMnO3/MgO (111): -2.38%
(Compressive strain on in-plane)
h-YMnO3/YSZ(111) : +2.74%
2-1-2 Pulse laser deposition (PLD)
Fig.2-3 the illustration of pulsed laser vacuum deposition system.
Pulse laser deposition is one of technology of depositing thin films. Fig.2-3 is the pulse laser deposition (PLD) system. Before the deposition, we need to clean the substrate by acetone、methanol and D. I. Water in order to getting superior quality thin films. Using the mechanism and turbo pump to decrease the vacuum pressure below 1×10⁻⁶ torr. Then we start to heat the substrate temperature, filling oxygen gas into the chamber.
Next, we guide the laser beam to the YMnO3 target and rotate the target.
When pulse laser beam hit the target, it will form plasma to deposit on the substrate. After the deposition, close the heater and E. M. Valve, then filling a great deal of oxygen gas to do quench process.
2-2 The measurement of the physical properties
2-2-1 X-ray diffraction
The structure of YMnO3 thin films and single crystal were determined by
X-ray diffraction (XRD). As Fig.2-4 show, we successfully growth only c-axis direction peaks of YMnO3, except for the substrate peak.
M g O (2 0 0 ) (0 0 0 6 ) (0 0 0 4 ) (0 0 0 4 ) (0 0 0 4 ) (0 0 0 4 ) (0 0 0 2 ) YMO-MgO(100) (a) (b) M g O (1 1 1 ) (0 0 0 8 ) (0 0 0 6 ) (0 0 0 6 ) (0 0 0 2 ) YMO-Single Crystal (c) Y S Z (2 2 2 ) Y S Z (1 1 1 ) M g O (2 2 2 ) (0 0 0 8 ) (0 0 0 8 ) (0 0 0 6 ) (0 0 0 2 ) YMO-MgO(111) 5 10 15 20 25 30 35 40 45 50 55 60 65 70 75 80 85 (d) M g O (1 0 0 ) (0 0 0 8 ) (0 0 0 2 ) YMO-YSZ(111) In te n s it y (a rb .u n it s ,l o g s c a le ) 2θ θ θ θ (degrees)
Fig.2-4 XRD patterns of (a) h-YMnO3/MgO(100), (b) h-YMnO3 single crystal, (c)
h-YMnO3/MgO(111) and (d) h-YMnO3/YSZ(111) samples
The c-axis lattice constants of YMnO3 thin films were calculated according
to Bragg’s law and (hkl) planes the lattice constants for hexagonal structure (Eq. 2-1 and Eq. 2-2):
2
d
h k ls i n
θ
=
n
λ
Where 2 2 2 2 2
1
4
3
hklh
hk
k
l
d
a
c
+
+
=
+
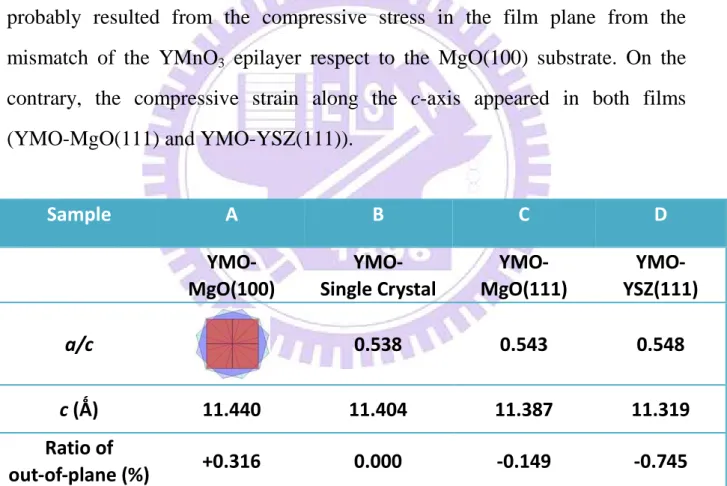
Using above formula, Table 2-3 show the c-axis lattice constants calculated from the position of (0004) peak for YMO-MgO(100), YMO-Single Crystal , YMO-MgO(111) and YMO-YSZ(111) are 11.440Å, 11.404 Å, 11.387Å
and 11.319Å, respectively. Moreover, a/c ratio for YMO-Single Crystal, YMO-MgO(111) and YMO-YSZ(111) are 0.538, 0.543 and 0.548, respectively. In YMO-MgO(100) thin film, the observed tensile strain along the c-axis is probably resulted from the compressive stress in the film plane from the mismatch of the YMnO3 epilayer respect to the MgO(100) substrate. On the
contrary, the compressive strain along the c-axis appeared in both films (YMO-MgO(111) and YMO-YSZ(111)).
Sample A B C D YMO- MgO(100) YMO- Single Crystal YMO- MgO(111) YMO- YSZ(111) a/c 0.538 0.543 0.548 c (Ǻ) 11.440 11.404 11.387 11.319 Ratio of out-of-plane (%) +0.316 0.000 -0.149 -0.745
Table 2-3 c-axis lattice constants, a/c ratio and ratio of out-of-plane.
Except for using the mismatch between film and substrate, we also control the thickness of h-YMnO3 thin film. The different thickness thin film will suffer
the different strain effect. Fig.2-5 shows the XRD patterns of different thickness from 9KP to 1.5KP of h-YMnO3. 5 10 15 20 25 30 35 40 45 50 55 60 65 70 75 80 85 1 10 100 1000 10000 100000 1000000 1E7 Y S Z (2 2 2 ) Y S Z (1 1 1 ) Y M O (0 0 0 8 ) Y M O (0 0 0 6 ) Y M O (0 0 0 4 ) Y M O (0 0 0 2 ) S-1.5KP F-1.5KP S- 3KP F- 3KP S-4.5KP F-4.5KP S- 6KP F- 6KP S-7.5KP F-7.5KP S- 9KP F- 9KP In te n s it y (a rb .u n it s ) 2θ θ (θ θ degrees) h-YMnO 3-YSZ(111)
Fig.2-5 XRD patterns of the different thickness of h-YMnO3/YSZ(111).
Fig.2-6 shows the relationship of c-axis lattice constant and pulse number. When the pulse number decrease from 9KP to 1.5KP, c-axis lattice constant become smaller from 11.3193 Å to 11.2969 Å (~0.0224 Å), ratio of out-of-plane change from -0.739% to -0.936% (~0.2%).
1000 2000 3000 4000 5000 6000 7000 8000 9000 11.295 11.300 11.305 11.310 11.315 11.320
c-a
x
is
l
a
tt
ic
e
c
o
n
st
a
n
t
(a n g s tr o m )Pulse number(times)
Fig.2-6 shows the relationship of c-axis lattice constant and pulse number.
Table 2-4 c-axis lattice constant of different thickness of h-YMnO3/YSZ(111) thin films.
h-YMnO3/YSZ(111) 2θθθθ (0004) c(Å) Ratio of out-of-plane change (%)
Pulse number 9000 31.60o 11.3193 -0.739 7500 31.62o 11.3161 -0.767 6000 31.64o 11.3097 -0.823 4500 31.65o 11.3065 -0.851 3000 31.66o 11.3033 -0.880 1500 31.68o 11.2969 -0.936
2-2-2 Φ-Scan
0 60 120 180 240 300 360 0.0 0.5 1.0 1.5 2.0 2.5 In te n s it y (a .u .) φ-scan(degree) h-YMO(0002)/MgO(100) φ-scan of MgO(220) φ-scan of h-YMO(112)Fig.2-7 show Φ-scan result of h-YMO/MgO(100) [13]
0 50 100 150 200 250 300 350 0.01 0.1 1 10 In te n s it y (a .u .) φφφφ−−−−scan(degrees) h-YMnO 3 / MgO(111) φφφφ−−−−scan of MgO(200) φφφφ−−−−scan of h-YMnO3(112)
-50 0 50 100 150 200 250 300 350 0.01 0.1 1 10 100 In te n s ity (a .u .) φφφφ−−−−scan(degrees) h-YMnO3 / YSZ(111) φφφφ−−−−scan of YSZ(220) φφφφ−−−−scan of h-YMnO3(112) Fig.2-9 show Φ scan result of h-YMO/YSZ(111).
From the Φ-scan results, it shows the epitaxial relationship between film and substrate. Moreover, we can also know the orientation characteristics.
h-YMO/MgO(111) and h-YMO/YSZ(111) are six-fold symmetry, but
h-YMO/MgO(100) is twelve-fold symmetry. Hence, the YMnO3 growth on
MgO(100) substrate maybe along MgO(011) or MgO(0-11) direction. It’s show in Fig.2-10
Fig.2-10 The growth situation of h-YMO/MgO(100). The structure of YMnO3 ishexagonal, MgO(100) substrate is square.
2-2-3 SQUID
The temperature dependent magnetization (M(T)) along various crystalline axes was measured in a Quantum Design® superconducting quantum interference device (SQUID) with a small applied magnetic field parallel to the in-plane (perpendicular to the c-axis) to delineate the possible magnetism anisotropy in this material.
Temperature dependent magnetization (M(T)) showed the magnetic behavior of the h-YMO/MgO(100), h-YMO/MgO(111), h-YMO/YSZ (111) thin films and h-YMO single crystal. All the thin films are collected with an applied field 500 Oe. Single crystal was measured with applied field 5000Oe [14]. Both the zero field cool (ZFC) and field cool (FC) schemes were measured in Fig.2-11, Fig.2-13 and 2-14.
There are two magnetic phase transitions (around TN=70K and TSR=40K,
respectively) that might be regarded as the intrinsic Néel temperature and a super spin-glass-like (SSG) transition associated with disorder-coupled spin reorientation behavior. But in most of cases, we just observe the Néel temperature, spin-glass-like (SSG) transition can’t if it’s less disorder in sample. Fig.2-11, Fig.2-12 and Fig.2-14 show magnetization vs temperature (M-T) curves and the reciprocal magnetization vs temperature (1/M-T) for
h-YMO/MgO(100), h-YMO/MgO(111), and h-YMO/YSZ(111) thin films with
FC and ZFC parallel to the film surface. Fig.2-13 shows the susceptibility vs temperature (χ-T) of h-YMO single crystal [14]. The reciprocal magnetization vs temperature (1/M-T) show the Néel temperature of h-YMO/MgO(100), h-YMO single crystal, h-YMO/MgO(111) and h-YMO/YSZ(111) are 63K, 70K, 103K and 140K. Why the Néel temperature shift from 63K to 140K? We think it’s to
be in connection with the strain effect. In chapter 4, we will use optical pump-optical probe to confirm this discover further.
0 20 40 60 80 100 120 140 160 180 200 220 240 260 3 6 9 12 15 18 h-YMnO3/MgO(100)-500Oe H//ab-plane(FC) H//ab-plane(ZFC) M (e m u *1 0 -6 ) T(K) 28K 0 20 40 60 80 100 120 140 160 180 200 0 1 2 3 4 5 1 /M (e m u -1 *1 0 5 ) T(K) H//ab-plane(FC) 63K
Fig.2-11 show magnetization vs temperature (M-T) curves and the reciprocal magnetization vs temperature (1/M-T) for h-YMO/MgO(100) with FC and ZFC parallel to the film surface.
Fig.2-12 show susceptibility vs temperature (χ-T) curves and the inset is reciprocal susceptibility vs temperature (1/χ-T) for h-YMO single crystal [14].
0 20 40 60 80 100 120 140 160 180 200 220 2 4 6 8 10 M (e m u *1 0 -6 ) T(K) h-YMnO3/MgO(111)-500Oe H//ab-plane(FC) H//ab-plane(ZFC) -20 0 20 40 60 80 100 120 140 160 180 200 220 2.0 2.2 2.4 2.6 2.8 1 /M (e m u -1 *1 0 5 ) T(K) H//ab-plane(FC) 103K
Fig.2-13 show magnetization vs temperature (M-T) curves and the reciprocal magnetization vs temperature (1/M-T) for h-YMO/MgO(111) with FC and ZFC parallel to the film surface.
0 50 100 150 200 250 0 2 4 6 8 10 12 14 16 18 20 22 24 h-YMnO3/YSZ(111)-500Oe H/ab-Plane-FC H/ab-Plane-ZFC M o m e n t( e m u *1 0 -6 ) T(K) 42.45K 0 20 40 60 80 100 120 140 160 180 200 220 240 260 280 300 0 5 10 15 H//ab-plane(FC) 1 /M (e m u -1 *1 0 5 ) T(K) 140K
Fig.2-14 show magnetization vs temperature (M-T) curves and the reciprocal magnetization vs temperature (1/M-T) for h-YMO/YSZ(111) with FC and ZFC parallel to the film surface.
Chapter 3 Optical pump-optical probe (OPOP) 3-1 OPOP Background
In optical pump-optical probe measurement, we separate the pulse laser beam into pump and probe beam, separately. The ratio of intensity between pump and probe beam is (60mW): (2mW).
First, we adjusted the optical path difference to control the time difference of pump and probe beam reaching the sample, this way we called delay time. When pump beam reached the sample, it will cause an event, n(t), its lifetime between two pulses must not exceed 13ns between two pulses.
Since n(t) is triggered by a laser (pump) pulse train, n(t) shows its replica with a period of 13 ns. Assuming that the n(t) could be related to the index of reflection, the reflection(or transmission) intensity of probe pulses from sample will vary with n(t) while the probe pulses temporally overlapped with n(t). However, this change due to n(t) is very small, typically between 10-5 ~ 10-7, and is very difficult to detect directly under the noisy background (including laser noise, electronic noise, mechanic vibration etc.) by photodiode.
Hence, the lock-in amplifier was usually used to remove the background noise and amplify the signals. Accordingly, we also added an acousto-optic modulator (AOM) on the pump path with modulating at 97.733 KHz, the frequency is the same with lock-in amplifier where the noise was smaller and the gain of the narrow band amplifier was maximum. By varying the time delay (t) between pump and probe pulses, ∆I(t) would change as a function of time delay. It’s show as Eq.3-1, Io(t) is DC voltage signal that it stand for the intensity
of reflectivity. And ΔI(t) is stand for the change (ΔR) of reflectivity. Finally,
( )
( )
( )
0r r
Pump Pump i Pump i Pump r Pump r Pump Open Closed Open Closed Open Closed
Pump Pump r r Closed cloesd Pump i Closed
I
I
R
R
I
I
I
I
R
I
R
R
I
I
I
I
−
−
−
∆
=
=
=
=
∆
where
( )
i Pump( )
i PumpOpen Closed
I = I and
( )
r Pump 0Closed
I ≡I [15]
Eq. 3-1, Io(t) is DC voltage signal that it stand for the intensity of reflectivity. And ∆I(t) is stand for the change (∆R) of reflectivity.
3-2 System of OPOP
Fig.3-1 the setup of pump-probe spectroscopy. AOM: acousto-optic modulator.
P: polarizer. CCD: CCD camera. PD: photodiode. M: multimeter. RF: RF driver. F: function generator. D: delay controller. The solid and dashed lines represent the laser beam path and the dotted lines stand for the electrical signal connection [15].
Fig. 3-1 is the pump-probe system. The light source is Ti: sapphire laser, excited source is Coherent Verdi V5 solid-state laser, wavelength is 532nm and the maximum output is 5W. After mode-lock, the central wavelength of pulse laser is 800nm. Pulse width is about 20fs, and its repetition rate is 75.5MHz.
Although the pulse width is 20fs, it will broaden the pulse width after pulse laser go through a series of optical components. For example, lens, reflector, gold mirror, acousto-optic modulator, polarizer, half-wave plates and quartz windows of the chamber…etc. These optical components will get rise to positive group velocity dispersion. Hence, we will add a pair of prisms to pre-chirp the pulses. That is two prisms provide negative group velocity dispersion to cancel out the positive group velocity dispersion.
It can make sure the pulse width to reach the sample is same as output pulse width from the laser. In brief, we used a pair of prisms to add in the optical components with negative GVD to compensate the positive GVD. Next, we used beamsplitter to get pump beam (60mW) and probe beam (2mW).
Pump beam
First, pump beam will go through an acousto-optic modulator (AOM), and it will be driven by the RF driver and modulated the pump beam at 97.733 KHz. At the same time, it also sent the same frequency into lock-in amplifier.
Then, pump beam will pass time delay stage. This stage is composed of retroreflector and high precision stage. By varying the position of stage, we have the function of time-resolve to control the relative e time between pump and probe beam when these beams reached the sample. The stage we used is Newport PM500 series. Next, pump beam will pass the λ/2 plate and polarizer; it allowed us to adjust the intensity and polarization (electric field, E) of pump beam, respectively.
Probe beam
In the beginning, probe beam also go through the same AOM like pump beam. We will not modulate the frequency, because we just made the same compensate dispersion on pump and probe beams. Next, probe beam will pass beamsplitter to separate two beams, one is go through a polarizer and detect by photodetector directly as reference signal. The other is like pump beam, pass the λ/2 plate, polarizer to control the direction of polarization and intensity, respectively. The spatial overlap of pump and probe beams on the sample was monitored by the CCD camera. The reflection of the probe beam (its sample signal) was received by the photodiode. It will transform photon signal into electric signal. The
multimeter and the lock-in amplifier took the DC (R) and AC (ΔR) components
in the signal, respectively. Finally, we used the computer to control the delay stage and measured the data (ΔR/R(t)).
3-3 Cooling system
In order to measuring properties of the sample under low temperature, we established a cooling system. First, we put the sample on the holder, and then put them into the chamber. Using mechanic and turbo pump to lower the pressure into 10-6 torr. Moreover, the systems of cooling we used are open cycle and close cycle. In controlling temperature, we used Lake Shore 331, it is a 25Ω heater was used to control the temperature. The variable temperature range in this system was from 20 K to 300 K.
3-4 Time delay zero point positioning
In our experiments, when pump beam and probe beam hit the sample simultaneously, they must get to the time and spatial overlap. The spatial overlap of pump and probe beams on the sample was monitored by the CCD camera. The reflection of the probe beam was received by the photodiode. In other way, we can use a nonlinear second harmonic crystal, BBO (Beta-Barium Borate) to do the time overlap. The pump and probe beam were focused and crossed on the BBO crystal. Under the phase-matched condition, it could radiate the maximum of the second harmonic generation (SHG), the wavelength is 400nm, it could be detected by photomultiplier tube (PMT) behind the BBO crystal. And the phase-matched position, we called time delay zero point positioning.
3-5 Experimental methods and process
After setup the OPOP system, we can start to do the measurement of ultrafast laser spectroscopy. And the detail experiment steps are showed below:
I. Open the laser power:
Ti-sapphire laser needed two hours from the beginning to stabilization, and it should notice the temperature of cooling system and water flow. Then, let the laser under mode-locked operation and write down the power, beam profile and position. Using the spectroscopy to check if CW term still exist. After checking the situation of the laser, the high S/N (signal to noise) ratio of spectra will be achieved.
II. Paste samples:
We put the sample on the holder by double coated carbon conductive tapes. Because carbon conductive tapes have thickness, we must do the best to paste it evenly. It could avoid the error.
III. Guide the light:
After pasting samples and putting into the chamber, we adjusted the light path, and made sure pump beam and probe beam would reach the sample surface accurately. Then, we adjusted the reflected mirrors, it let probe beam reflect to the photo detector. But we must avoid the pump beam reflect to the detector, we would put a polarizer in front of the detector to reduce it. After double checking the light path, we opened the pump, lowering the pressure under 10-6 torr.
IV. Spectrum measurement under room temperature:
In experiment process, we measured the direction of polarization and power of pump beam and probe beam by adjusting polarizer and λ/2 plate, respectively. In this experiment, the power of pump and probe beam are 60mW and 2mW. And the angle of the polarization direction of both the pump and probe pulses are 90o. However, the reference signal must be twice larger than the reflective signal in order to lower the background noise. The spot would be a little bit shifted after delay stage working. In general, we would let the pump beam spot is larger than probe beam spot. After doing this, we could make sure the overlap of pump and probe pulses, even if there were a little bit shift.
V. Spectrum measurement under lower temperature:
We controlled the flow of liquid Helium and liquid Nitrogen in cooling the sample, and 25Ω heater was used to control the temperature. We could do the spectrum measurement under lower temperature by repeating step IV when it reached the temperature we wanted.
Chapter 4 Experimental Result and Discussion
4-1 Epitaxial-strain effect on Mn3+ d-d energy difference
We already prepared pure (001)-oriented hexagonal YMnO3 (h-YMO) thin
films on (100)MgO, (111)MgO and (111)YSZ substrates by pulsed laser deposition, respectively. We will show the results of the ultrafast dynamics in these samples probed by the OPOP technique, especially, the effect of strain due to lattice mismatch between the substrate and h-YMO films on the magnitude of
Edd. We found that Edd change due to the small change of the ratio of lattice
constant a/c.
In this chapter, we will show a series of results by using the same wavelength (800nm) and tunable wavelength (755 nm, 770 nm, 777 nm, 785 nm, 800 and 815nm) of pump and probe beam wavelength.
4-1-1 Pump-Probe results (Fix wavelength) 0 50 100 150 200 250 300 350 400 450 500 0.0 0.5 1.0 1.5 2.0 2.5 3.0 3.5 4.0 4.5 5.0 5.5 6.0 6.5 40 K 30 K 90 K 150 K 155 K 140 K 120 K 100 K 50 K 70 K 80 K 60 K 110 K 130 K 180 K 170 K 160 K 165 K 190 K 200 K 220 K 240 K 260 K 280 K ∆∆∆∆ R /R
(
1 0 -3)
Delay Time (ps) 290 Kh-YMnO
3-MgO(100)
Fig. 4-1 The transient reflectivity ∆R/R curves of h-YMnO3/MgO(100) samples measured at various temperatures.
0 5 10 15 20 25 30 35 40 45 50 55 60 0.0 0.5 1.0 1.5 2.0 2.5 3.0 3.5 4.0 4.5 5.0 5.5 6.0 6.5
150 K
155 K
100 K
180 K
160 K
200 K
240 K
∆∆∆∆ R /R(
1 0 -4)
Delay Time (ps)290 K
h-YMnO
3-MgO(100)
0 50 100 150 200 250 300 350 400 450 500 0.0 0.5 1.0 1.5 2.0 2.5 3.0 3.5 4.0 4.5 5.0 5.5 6.0 6.5
h-YMnO
3-Single Crystal
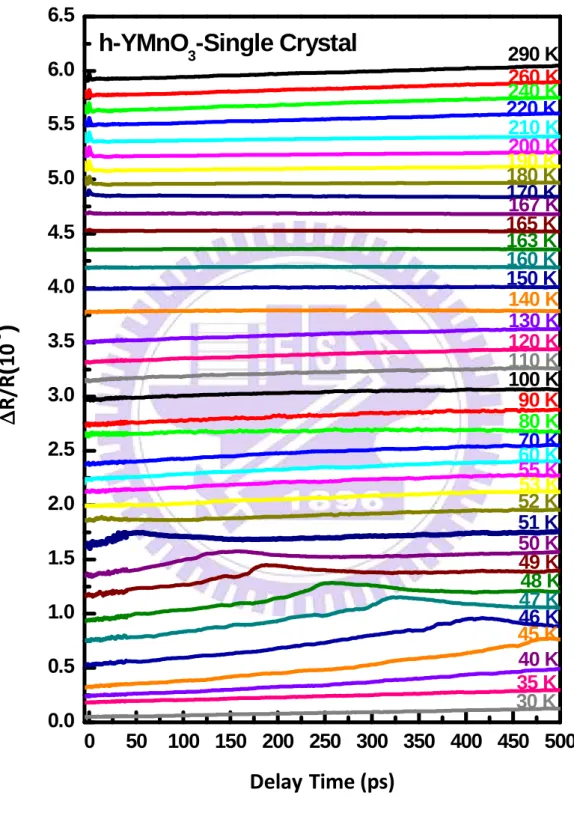
30 K35 K 45 K 40 K 46 K 47 K 49 K 48 K 51 K 50 K 53 K 52 K 70 K 55 K 120 K 100 K 90 K 110 K 80 K 60 K 130 K 150 K 140 K 160 K 165 K 163 K 170 K 167 K 190 K 180 K 210 K 200 K 240 K 220 K 260 K ∆∆∆∆ R /R(
1 0 -3)
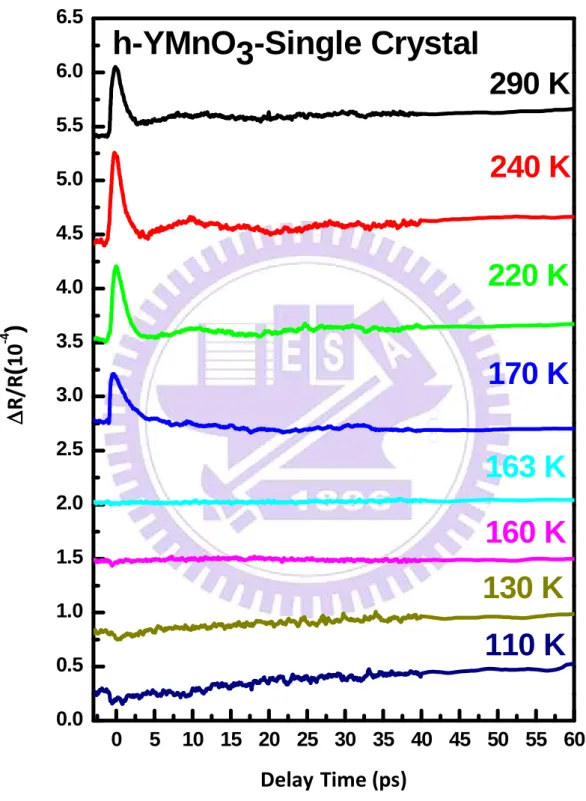
Delay Time (ps) 290 KFig. 4-3 The transient reflectivity ∆R/R curves of h-YMnO3 single crystal samples measured at various temperatures.
0 5 10 15 20 25 30 35 40 45 50 55 60 0.0 0.5 1.0 1.5 2.0 2.5 3.0 3.5 4.0 4.5 5.0 5.5 6.0 6.5
130 K
h-YMnO
3
-Single Crysta
l
110 K
160 K
163 K
170 K
240 K
220 K
∆∆∆∆ R /R(
1 0 -4)
Delay Time (ps)290 K
0 50 100 150 200 250 0.0 0.5 1.0 1.5 2.0 2.5 3.0 3.5 4.0 4.5 5.0 5.5 6.0 6.5
h-YMnO
3-MgO(111)
27 K 30 K 25 K 23 K 50 K 70 K 90 K 110 K 100 K 150 K 130 K 120 K 170 K 190 K 203 K 160 K 207 K 202 K 200 K 208 K 204 K 260 K 210 K 230 K ∆∆∆∆ R /R(
1 0 -3)
Delay Time (ps) 290 KFig. 4-5 The transient reflectivity ∆R/R curves of h-YMnO3/MgO(111) samples measured at various temperatures.
-5 0 5 10 15 20 25 30 35 40 45 50 55 60 0.0 0.5 1.0 1.5 2.0 2.5 3.0 3.5 4.0 4.5 5.0 5.5 6.0 6.5
120 K
207 K
h-YMnO3-MgO(111)
190 K
203 K
200 K
208 K
260 K
230 K
∆∆∆∆ R /R(
1 0 -4)
Delay Time (ps)290 K
0 50 100 150 200 250 300 350 400 450 500 0.0 0.5 1.0 1.5 2.0 2.5 3.0 3.5 4.0 4.5 5.0 5.5 6.0 6.5
h-YMnO
3-YSZ(111)
40 K 30 K 45 K 50 K 42 K 70 K 120 K 90 K 80 K 100 K 60 K 260 K 200 K 160 K 140 K 180 K 240 K 220 K 263 K 250 K 270 K 267 K 265 K 280 K 275 K ∆∆∆∆ R /R(
1 0 -3)
Delay Time (ps) 290 KFig. 4-7 The transient reflectivity ∆R/R curves of h-YMnO3/YSZ(111) samples measured at various temperatures.
0 10 20 30 40 50 60 0.0 0.5 1.0 1.5 2.0 2.5 3.0 3.5 4.0 4.5 5.0 5.5 6.0 6.5
h-YMnO3-YSZ(111)
100 K
260 K
160 K
220 K
265 K
280 K
275 K
∆∆∆∆ R /R(
1 0 -4)
Delay Time (ps)290 K
Base on the Fig. 4-8 at zero delay time, the amplitude of ∆R/R as a function of temperature of h-YMnO3/YSZ(111) at 800nm show in Fig. 4-9(a). The amplitude of the ∆R/R
appears to remain constant above 280K until it starts to drop noticeably from T=275 K. At T=265 K the amplitude of the excitation component has diminished completely and with T=260 K it even becomes negative. When the excitation component has diminished, the Edd is equal to the photon energy at the moment. Fig.4-9(b) it’s show energy difference of the Mn3+
energy levels in the local environment MnO5 for photon energy above and below Edd.
Fig.4-9(c) it’s show orbital-resolved densities of states of Mn 3d orbital’s and the in-plane O
2p orbital for YMnO3 [16], the range between two red lines we called Mn3+ d-d energy
difference(Edd). 0 50 100 150 200 250 300 -6 -4 -2 0 2 4 6 8 10 A m p li tu d e o f fa s t c o m p o n e n t A f (* 1 0 -5 ) T (K)
Fig.4-9 (a) The amplitude of ∆R/R as a function of temperature at 800nm taken from Fig.4-8 at zero delay time. (b) Energy difference of the Mn3+ energy levels in the local environment MnO5 for photon energy above and below Edd. (c) Orbital-resolved densities of states of Mn
3d orbitals and the in-plane O 2p orbital for YMnO3 [16].
(a)
(b)
(c)
Fig.4-10 It illustrates the splitting of the Mn3+ energy levels in the local environment MnO5.
The electrons residing on the e2g orbital (dxy and dx2−y2) can transfer to the
unoccupied a1g orbital (d3z2−r2) by absorbing pumping photons with energy exceeding Edd.
0 5 10 15 20 25 30 35 40 D e lt a R /R ( a rb . u n it s ) Delay Time(ps)
Fig.4-11 Three primary features of dynamics in the ∆R/R curves.
As show in Fig.4-11, the typical temperature-dependent ∆R/R for the
h-YMnO3/YSZ(111). The initial excitation component <1>, the relaxation
component <2> and the oscillation component <3> is show Fig.4-11 process.
For example, YMnO3/YSZ(111) show in Fig.4-8, the amplitude of the
excitation of the ∆R/R process 1 appears to remain constant at high temperature until it starts to drop noticeably around T=280 K. At T=265K, it has diminished, and T=260K it even becomes negative.
The relaxation of the ∆R/R process 2 is higher than the beginning level above 290K, and it will be negative ∆R/R which appears to grow gradually with decreasing temperature.
The oscillator of the ∆R/R process 3 appears above T=265K. We can see in Fig.4-8, when there is positive excitation component, it will cause the oscillator component. The oscillation period is about 15ps.
<1>
<2>
<3>
YMnO3-Single Crystal
4-1-2 Pump-Probe results (Tunable wavelength) 0 5 10 15 20 25 30 35 40 45 50 55 60 0.0 0.5 1.0 1.5 2.0 20 K 40 K 80 K 120 K 150 K 180 K 210 K 240 K 270 K 300 K 330 K 360 K 380 K 400 K 420 K 440 K 460 K 480 K ∆∆∆∆ R /R ( 1 0 -3 ) Delay time(ps) 500 K
Fig. 4-12 The transient reflectivity ∆R/R curves of h-YMnO3/YSZ(111) samples measured with the same pump and probe beam wavelength(815nm) at various temperatures.
0 5 10 15 20 25 30 35 40 45 50 55 60 0.0 0.8 1.6 2.4 3.2 4.0
20 K
40 K
60 K
80 K
100 K
120 K
140 K
160 K
180 K
200 K
220 K
240 K
250 K
260 K
270 K
280 K
300 K
320 K
340 K
360 K
380 K
∆∆∆∆ R /R(
1 0 -3)
Delay time (ps)
400 K
Fig. 4-13 The transient reflectivity ∆R/R curves of h-YMnO3/YSZ(111) samples measured with the same pump and probe beam wavelength(800nm) at various temperatures.
0 10 20 30 40 50 60 0.0 0.5 1.0 1.5 2.0 2.5 3.0 3.5
20 K
40 K
60 K
80 K
100 K
120 K
140 K
150 K
160 K
180 K
200 K
220 K
240 K
260 K
280 K
∆∆∆∆ R /R(
1 0 -3)
Delay time (ps)
300 K
Fig. 4-14 The transient reflectivity ∆R/R curves of h-YMnO3/YSZ(111) samples measured
0 5 10 15 20 25 30 35 40 45 50 55 60 0 1 2 3 4 5 6 7
20 k
40 k
60 k
80 k
100 k
110 k
115 k
120 k
140 k
160 k
180 k
200 k
220 k
240 k
260 k
∆∆∆∆ R /R(
1 0 -3)
Delay time(ps)
290 k
Fig. 4-15 The transient reflectivity ∆R/R curves of h-YMnO3/YSZ(111) samples measured with the same pump and probe beam wavelength(777nm) at various temperatures.
0 5 10 15 20 25 30 35 40 45 50 55 60 0 1 2 3 4 5 6
20 K
40 K
60 K
95 K
80 K
105 K
110 K
90 K
100 K
120 K
140 K
160 K
180 K
200 K
220 K
240 K
260 K
∆∆∆∆ R /R(
1 0 -3)
Delay time(ps)
290 K
Fig. 4-16 The transient reflectivity ∆R/R curves of h-YMnO3/YSZ(111) samples measured
0 5 10 15 20 25 30 35 40 45 50 55 60 0 1 2 3 4 5 6 7
20 K
40 K
95 K
60 K
80 K
90 K
100 K
110 K
120 K
140 K
160 K
180 K
200 K
220 K
240 K
260 K
∆∆∆∆ R /R(
1 0 -3)
Delay time(ps)
290 K
Fig. 4-17 The transient reflectivity ∆R/R curves of h-YMnO3/YSZ(111) samples measured with the same pump and probe beam wavelength(755nm) at various temperatures.
0 50 100 150 200 250 300 350 400 450 500 550 600 650 700 -0.8 -0.6 -0.4 -0.2 0.0 0.2 0.4 0.6 0.8 1.0 755nm 770nm 785nm 800nm 815nm N o rm a il iz e d a m p li tu d e o f ∆∆∆∆ R /R Temperature(K) T(K)=375K
Fig. 4-18 Normalized amplitude of ∆R/R as a function of temperature of h-YMnO3/YSZ(111) at various wavelengths (λ) at zero delay time.
0 50 100 150 200 250 300 350 400 450 -1.0 -0.8 -0.6 -0.4 -0.2 0.0 0.2 0.4 0.6 0.8 1.0 755nm 770nm 785nm 800nm 815nm N o rm a il iz e d a m p li tu d e o f ∆∆∆∆ R /R Temperature(K) T(K)=294K
Fig. 4-19 Normalized amplitude of ∆R/R as a function of temperature of h-YMnO3 single crystal at various wavelengths (λ) at zero delay time.
0 50 100 150 200 250 300 350 400 1.52 1.54 1.56 1.58 1.60 1.62 1.64 1.66 h-YMnO3-MgO(100) h-YMnO3-Single Crystal h-YMnO3-MgO(111) h-YMnO3-YSZ(111) E n e rg y G a p , E d d ( e V ) T (K) 70K
Fig.4-20 The energy gap Edd as a function of temperature T(K). Edd is estimated from the different wavelengths (755,770,785,800,815nm). The black line is the TN (Néel temperature) for the YMnO3 single crystal to be a standard sample.
Fig.4-20 show the energy gap Edd as a function of temperature T (K). Edd is estimated from the different wavelengths (755,770,785,800,815nm). The black line is the TN (Néel temperature) for the h-YMnO3 single crystal to be a standard sample.
Table 4-1 The parameter of a/c ratio, c-axis lattice constant (Å), T (K, ∆R/R=0) at 1.55eV, and
Edd(eV) at 200K of h-YMO/MgO(100), h-YMO/single crystal, h-YMO/MgO(111) and
h-YMO/YSZ(111), respectively.
Due to Table 4-1 and Fig. 4-20, when a/c ratio increase from 0.538 to 0.548, the temperature of ∆R/R=0 at 1.55eV will increase from 165K to 255K; the
Edd(eV) at 200K is relative to the a/c ratio increase from 1.542 eV to 1.565 eV
(about 23meV change if ∆(a/c)=0.01).
In the reference [16], the position of the first peak shows a systematic change between 1.61 eV and 1.81 eV, depending on the R (rare earth) ion. The vertical dotted line in Fig.4-21 indicates the first peak position of YMnO3. As the radius of the R ion increases from Y to Gd, the position of the first peak shifts to higher energy. The shift in peak position becomes significant for
artificially fabricated h-RMnO3 films, especially h-GdMnO3. The systematic
change of the sharp optical transition peak in h-RMnO3 implies that there should
be systematic variations in their electronic structures depending on the radius of the R (rare earth) ion.
Sample YMO- MgO(100) YMO- Single Crystal YMO- MgO(111) YMO- YSZ(111) a/c ratio 0.538 0.543 0.548
c-axis lattice constant(Å) 11.440 11.404 11.387 11.319
T(K), ∆R/R=0 at 1.55eV 149 165 208 255